Death penalty in the United States: an unbalanced practice( Télécharger le fichier original )par Julie Rérolle Université Aix-Marseille 1 - M1 Langues Etrangères Appliquées 2007 |

II Geographical analysis of the application of death penalty
Among the retentionist States, the criminal systems differ according to the type of offense, and the method and application of death penalty. To take this study further would require comparing the criminal law systems of to each jurisdiction in their entirety, however this paper will focus its analysis on the capital crimes and the various execution methods used, putting aside the different processes used during the trial and appeal phase. 1) Offenses subject to the death penalty At the federal level, capital punishment can result from 42 offenses, including 38 related to homicide. However, some states have stricter laws that apply in other cases. As shown in the appendix on page 8126(*), crimes subject to the death penalty vary by jurisdiction. All the jurisdictions which use capital punishment (38 retentionist states, the U.S. Government and U.S. Military) designate the highest grade of murder as a capital crime. In addition, there are a growing number of states that allow the execution of convicted child molesters. In Oklahoma, a bill was enacted that permits the death penalty for anyone convicted of rape, forced sodomy, lewd molestation or rape of a child under 14 years of age. In addition, most jurisdictions require additional aggravating factors for homicide-related cases. Treason is also a capital offense in several jurisdictions. In California, for example, the death penalty also can be imposed for wrecking a train, high treason and committing perjury that results in death. Other capital crimes include: aggravated kidnapping in Georgia, Idaho, Kentucky and South Carolina; train wrecking which leads to a person's death, and perjury which leads to a person's death in California; aircraft hijacking in Georgia and Mississippi; aggravated rape of a victim the under age of 12 in Louisiana; capital sexual battery in Florida; and capital narcotics conspiracy in Florida and New Jersey. At the federal level, death penalty crimes include various degrees and types of murder as well as treason, espionage, large scale drug trafficking, kidnapping across State lines resulting in the victim's death, and attempting to kill any officer, juror, or witness in cases involving a continuing criminal enterprise. Under U.S. Military law; there are 14 crimes subject to the death penalty. Some of them, such as desertion, are only applicable in times of war. Despite the variety of capital crimes among the various criminal systems, no one has been executed for a crime which was not a homicide since the reinstatement of the death penalty in 1976. The last execution for a rape was in 1964. 1) The different methods of execution used Five methods of execution are prescribed in the United States: the lethal injection (in most cases27(*)), the electric chair, the gas chamber (or lethal gas), hanging, and the firing squad. a) Description - Lethal injection The procedure of lethal injection is the most common, and varies from state to state. However, in most jurisdictions, a combination of three drugs is used. The first is a barbiturate that makes the prisoner unconscious. The second one is a muscle relaxant that paralyzes the diaphragm and lungs. Finally, the third causes cardiac arrest. Each chemical is fatal in the amounts administered and the procedure is supposed to last between three and seven minutes after the first injection. Nevertheless, sometimes it can happen that a vein collapses or the injection cannot be properly inserted. Some states give an extra sedative injection to facilitate the insertion. Lethal injection is considered as the most `humane' method, in comparison with the other methods, but it has been more and more criticized due to problems with the executions. For example, on May 3rd 2006, Joseph Clark was executed in Ohio in such inadequate conditions that the prison's authorities decided to close the curtain so that the witnesses would not see the results. The execution lasted one and a half hours instead of a few minutes. Just before this event, The Lancet, a British medical review, had published an article about the process used, claiming that «there was no assessment of the depth of anesthesia before the paralyzing agent and potassium chloride were injected.»28(*) According to the journal, in most cases the convicted dies «awake, paralyzed, unable to move, to breathe, while potassium burned through your veins». The article denounces the conditions with which prisoners convicted to death are executed as insufficient even for veterinarians to kill an animal. «Data from autopsies following 49 executions in Arizona, Georgia and North and South Carolina, showed that concentrations of the drug in the blood in 43 cases were lower than that needed for surgery. Twenty-one prisoners had drug levels that were consistent with awareness.»29(*) Another example the same year, on the 13th of December, 2006, with the execution of Angel Diaz in Florida, renewed the debate on the lethal injection method. It required 34 minutes and a second dose of chemicals. The extensive debates concerning this method of execution have contributed to a moratorium being declared in one pro-capital punishment state. - Electric chair The electric chair is the second most used method of execution. The procedure is generally divided into three different electrocutions. The first one lasts eight seconds, programmed at 2,300 volts, followed by 1,000 volts for 22 seconds, then 2,300 volts for eight seconds. If the offender is not pronounced dead, the execution cycle is then repeated from the beginning. The most common problems encountered are burning parts of the body, and a failure to cause death despite repeated shocks. If it is seen as violent, the electric chair is still the second most commonly used method right up till 2006, in Virginia. In October 2001, the Supreme Court of Georgia claimed that the electric chair was a cruel and unusual punishment and forbade the method in the state. - Lethal gas For the lethal gas method, the inmate is strapped down on different parts of his body (chest, waist, arms, and ankles), and wears a mask. The room is equipped with metal containers where a sulphuric acid solution and cyanide pellets are placed. If the prisoners take a deep breath, they are unconscious within a few seconds. However, if they hold their breath, it can take much longer, and the prisoner usually goes into convulsions. Death usually occurs within 6 to 18 minutes of the lethal gas emissions caused by hypoxia, the cutting-off of oxygen to the brain. For this method, the most common problems are the obvious agony suffered by the inmates and the length of time before they actually die. A federal court in California found this method to be a cruel and unusual punishment. - Hanging For execution by hanging, the "drop" must be tailored to the prisoner's weight, to deliver the precise force to the neck (1260 lbf² [pounds per square foot]) to ensure a quick death. The rope is then placed around the convict's neck. If properly done, the inmate dies by dislocation of the third and fourth cervical vertebrae, or by asphyxiation. If the rope is too long, the inmate could be decapitated, and if it is too short, the strangulation could take as long as 45 minutes. However, instantaneous death rarely occurs with this method. - Firing squad The last method, firing squad, which is the least used, is also the least precise and can last very long. The offender is bound to a chair and has a white cloth circle attached by Velcro to the area over the offender's heart. The chair is surrounded by sandbags to absorb the inmate's blood. The squad, made up of three to six shooters, fires simultaneously. One of them has blank rounds in his weapon but no one knows which member has them. The shooters aim at the chest, because it is easier to hit than the head, causing rupture of the heart, large blood vessels, and lungs, so that the inmate dies of hemorrhage and shock. Sometimes, the officer in charge gives the prisoner a pistol shot into the head to finish them off after the initial volley has failed to kill them. b) The application of each method The majority of retentionist states utilize the lethal injection method. Among the 38 States with death penalty statutes, 19 States and the federal government only authorize lethal injection as the sole method of execution and 18 others offer this method as an alternative method of execution, to be used depending on the inmate's choice, the sentence, or the unconstitutionality of the main method. Electrocution is the sole option in 10 States (Alabama, Arkansas, Florida, Illinois, Kentucky, Nebraska, Oklahoma, South Carolina, Tennessee, and Virginia). In the remaining 8 States, the gas chamber, hanging, or a firing squad are the alternatives to lethal injection. Execution by lethal gas is an alternative method in four States: Arizona, California, Missouri and Wyoming; while in New Hampshire and Washington hanging is an alternative. Finally, death by firing squad is an alternative method in Idaho and Oklahoma. Nebraska is the only State where electrocution is the sole method of execution. Fig. 11) Methods of Executions and their Frequency Since 197630(*)
Since 1976, lethal injection has been the method most commonly used, as displayed in the table above. Of the 1072 inmates executed since 1976, 903 were killed by lethal injection, representing more than 84% of the total. The electric chair has been the second most used method since 1976 (14% of the total), the last electrocution being in Virginia, in 2006. The gas chamber was last used in Arizona in 1999. Hanging and firing squad were carried out for the last time in 1996, in Delaware and Utah, respectively. Even if lethal injection has been questioned lately, it remains the least `inhumane' or at least the quickest and a priori less painful method, which explains why only a few prisoners have ever requested one of the alternative methods. Between the beginning of this year and the end of April 2007, all 15 executions carried out were done by lethal injection.
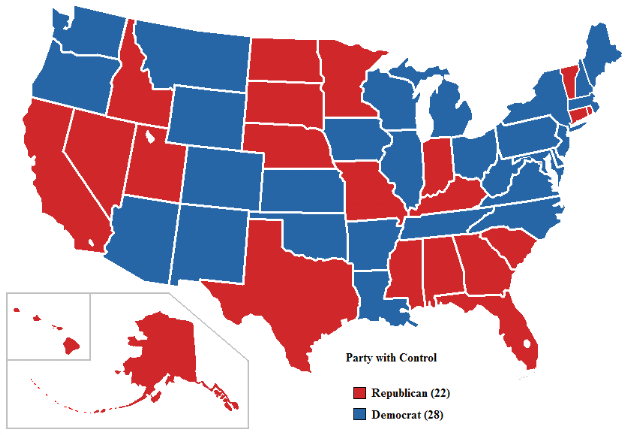
As we saw earlier, there have been many more executions and death row inmates in the south of the United States than in the north. As previously outlined, 392 of the 1072 executions were carried out in the single state of Texas, representing 36.5% of the total. Together, the states of the South gather 879, i.e. almost 82% of the total executions. The regions of the Northeast and West have the lowest number of executions, with only 69 since 1976, being 6.4% of the 1072 total. Such observations on geographical disparities date back from the beginning of the history of death penalty. How can such differences by region be explained? Many studies have been carried on to discover the reason. Before proposing the explanation of racial discrimination and the unbalanced criminal law (with the case study of Texas), let's have a look at the other ones that have been analyzed. 1) Is there a link between the Republican Party and the death penalty? It is also important to recall that, even if we have a picture of the Republican Party as a very right-winger one, it «was born from a spontaneous revolution against slavery, [but] it proclaimed itself in favor of «law and order», that is to say in favor of a rigorous policy on the racial issue.»31(*) According to J.P Lassale, The Republican Party is influenced by «the «new right wing», and the religious fundamentalism which supports it. (...) Today, the Republican values correspond to the strongly conservative tendencies of American public opinion.»32(*) Some studies have tried to establish a link between the political parties and the presence or absence of the death penalty as well as its application. Such investigations have been carried out to determine precisely why or why not the death penalty is employed. According to the conservatives, deterrence is the best antidote for crime: The threat of the death chamber will save many innocent victims from criminal violence. But liberals believe that crime is caused by inequitable conditions (...), so they are skeptical about harsh sanctions. (...) We expect more death sentences where conservative values dominate.33(*) Thus, a parallel can be done between the Republican Party, the most conservative one, and a strict application of the death penalty. Let's now try to analyze the facts. Fig. 12) Party control, Governors as of January 200734(*)
At the beginning of the year 2007, 22 states were ruled by Republican governors and 28 by Democrat ones. Since 1975, the District of Columbia has been ruled by a popularly elected mayor and city council, but there is no governor. Adrian Fenty, the current mayor, is a Democrat. In 6 of the 13 jurisdictions which have no death penalty statutes, the party in office is Democrat (Iowa, Maine, Michigan, West Virginia, Wisconsin and the District of Colombia), and in the seven others, the Republican Party is governing. Within the 38 retentionist states, 16 are Republican and 22 are Democrat. Thus, we cannot conclude that there is a link between the Republican Party and the application of the death penalty. Nevertheless, one can observe that among the states with the highest number of executions (see figure 9 on page 20) the majority of them are ruled by the Republican Party. Indeed, among the nine states most likely to execute (Texas, Virginia, Oklahoma, Missouri, Florida, North Carolina, Georgia, South Carolina, and Alabama), six are governed by a Republican political majority (Texas, Missouri, Florida, Georgia, South Carolina, Alabama). There may be a link between the Republican Party and death penalty, considering where it is applied, but apparently, not concerning its presence or absence in the law. It would be interesting to continue this analysis of death penalty's conspicuity in the law, but we will stop it there in order to pursue another hypothesis. 2) The historical explanation for a stricter application in the South Various studies also have been carried out to show the link between the more widespread application of the capital sentence in the southern states and the fact that they were pro-slavery before the American Revolution. In the article `Vigilantism, Current Racial Treat, and Death Sentences', from The American Sociological Review, a group of scholars attempted to highlight the link between the slavery past of the southern States and the fact that they use the death penalty more strictly and more often. «The states that once had the highest lynching rates now appear to use the death sentence most often. (...) Death sentences [are] especially likely in states with the largest minority populations that also had a history of frequent vigilante violence.»35(*) They also explain the stricter application of death sentences in the south by what they call the `racial threat'. «Larger black populations produce increased votes for anti-minority candidates (...), who often support harsh punishments.» In From Lynch Mobs to the Killing State, a collection of essays edited in 2006, Timothy Kaufman-Osborn makes an insightful and well-developed examination of the contention that pervasive racism in the criminal justice system renders the contemporary execution of African-American men as unjust as the historical lynchings that occurred throughout the United States. Ultimately, he uses the term «lynching» to describe the contemporary capital punishment, which «conceals as much as it reveals.» It is clear that some authors believe racism is a root cause of discrimination in the capital justice system. Thus, racial discrimination seems to be at the origin of such differences of application of death penalty. In order to justify such a hypothesis, we will try to compare death penalty numbers to other figures, related to social, economic and racial parameters.
As we have seen, the figures show that the southern states use the death penalty more often than the northern ones36(*). But it is necessary to use demographic, racial and economic parameters to prove any discrimination. This section will compare the death row population and the number of executions to the number of inhabitants by state before putting forward a hypothesis that the southern states use death penalty more readily or more discriminatorily. It will also analyze the composition of the prison population by race and compare the figures of the death row inmates to the inequality of income to provide evidence of a racial, social and economic discrimination. Finally, we will present the crime rates by region. 1) Demographic analysis a) Proportion of death row inmates related to state population According to the following spreadsheet, the overall number of death row inmates in the population of each State varies considerably, with disparities reaching 400%. This ratio between the death row population and the total population of each state is a better source of information with which to compare the number of death row inmates. Indeed, it permits to rationalize the number of inmates in California, which is the highest nationwide with 660 prisoners in death row, in comparison with the national average of 86.95. Due to the large population in California, when measured in terms of inmate proportionality, the state of California holds the 11th position. Conversely, the state of Alabama, which is less populous but counts only 195 death row inmates, occupies the first position of inmates per person. The State rate, 4.24 inmates per 100,000, is almost 4 times superior to the average of 1.14. Fig. 13) Number of Inmates per 10.000 Inhabitants in 200637(*)
It is interesting to notice that, aside from Nevada, the states where the number of death row prisoners per inhabitant is the highest are situated in the South (as Oklahoma, Mississippi, Florida, North Carolina...). Concurrently, this table also verifies that the majority of States where the proportion of inmates per inhabitant is the lowest are situated in the Northeast: New Hampshire, New York, Illinois, and New Jersey. This first comparison of the number of inmates per inhabitant of each state confirms the hypothesis that the southern states apply death penalty more freely than in the north. b) Actual number of executions per inhabitant The same comparison can be done taking into account the number of executions per inhabitant. Indeed, as shown in the following spreadsheet (figure 14), the states of Oklahoma, Texas, Delaware, Virginia, Missouri, Arkansas and South Carolina, all of whom are situated in the southern part of the country, are examples of states with a higher incidence of executions per inhabitant. It is important to relate the number of executions to the population because the measurement is much more relevant. Oklahoma, for example, which has only executed 84 prisoners since 1976, is the first state in term of execution rate per inhabitant, with 2.35 executions per 100,000 inhabitants. Fig. 14) State Execution Rates (2006)38(*)
These tables were put together in order to take into account the number of executions of death row inmates per inhabitant of each state. In doing so, one notices the ostensible predisposition of the southern states to sentence an inmate to death, and to execute more liberally. The differences between the two spreadsheets can be explained by the different durations spent on death row due to different trial procedures, especially in appeal. For example in California the high number of death row prisoners is not enough on its own to denounce the criminal system, because as seen from the other table, it condemns and executes relatively less than other states. It is also interesting to compare the death row population to the total population and the execution rate. If the classification of the state of Oklahoma in the two spreadsheets is almost at the same level (in 3rd and 1st position) provides a convincing snapshot of their position on the issue, relative to the other states, this is not the same for Texas. The state of Texas, which has a relatively low population on death row in comparison to the other retentionist states, is in second position for the number of executions per person. This dissimilitude can be explained by the fact that trials and appeal processes are very expeditious in this state. We will study the case of Texas in more detail in the third part of the paper. The analysis of the differences among the retentionist States
shows how difficult it is to deal with the United States capital sentence in
its entirety, due to State by 2) Racial analysis a) The United States society, a heterogeneous composition First of all, the composition of the population of the United States is extremely varied. Due to migration waves since the creation of the country, the population is often described as a `melting pot'. However, as can be seen in the following table Fig.15, the majority of Americans are white (75.1%). The black or African-American and Hispanic populations represent only 12.3% and 12.5% of the total, respectively. There is also 3.6% of Asian people as well as 5.5% of `some other race'. The phenomenon of the melting pot and the mixing of the different communities have resulted in 2.4% of inhabitants being considered as having `two or more races'. Fig. 15) Population of the United States by Race and Hispanic Origin (2000)39(*)
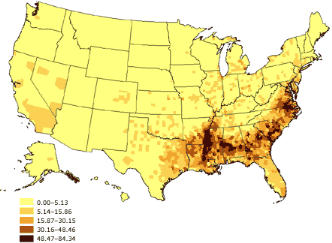
As shown in the following map, the repartition of the different communities varies geographically. The majority of the black population lives in the Southeast of the country. It is interesting to notice that the concentration of the African American community corresponds to the same areas where death penalty is most used (see figure 9 on page 20 `Executions by state'): Texas, Louisiana, Mississippi, Alabama, Georgia, South Carolina, North Carolina and Virginia. We will see further that this repartition is somewhat echoed by the racial distribution of the prison population. Fig. 16) Percentage of Black or African American (2000)40(*)
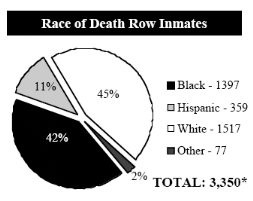
b) Death row, a demographic account It is interesting to compare the composition of the national population (detailed in the previous spreadsheet) to the death row population (in the following pie chart). One notices that although the proportion of African Americans in the country is 12.3%, this minority is much more represented on death row41(*). Indeed, 42% of the total death row population is black i.e. 1397 inmates of the 3350 total nationwide. This difference also exists conversely for the white population: although they account for 75.1% of the population, only 45% of the death row population is white. This means that 0.004% of the black community in the United States is on death row in comparison to only 0.0007% for the whites and 0.001% for the Hispanics. Fig. 17) Race of Death Row Inmates (2007)42(*) Fig. 18) Race of Defendants Executed
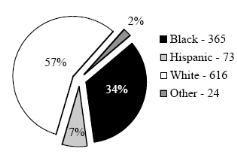
*including inmates sentenced by both the US Government and the US Military. 7 inmates were sentenced in more than one state, resulting in a total slightly higher than 3,344 when the individual states are combined. By comparing the death row population (figure 17) and the race of the defendants executed (figure 18), one notices that the composition is very different. This must be the result of exonerations. Black people, then, are more often exonerated, because, as we will see further in this essay, trials involving African Americans, who are generally poorer, are unbalanced and expeditious, and the court appointed lawyers are not experienced or sometimes not even specialized in criminal law. c) State by State composition of the death row population Having shown that African Americans are over represented in the death row, this paper will now study the composition of the death row population State by State. As we have seen in figure 17, the repartition of black and white inmates is similar (45% of white and 42% of black) but the following spreadsheet shows that the repartition of the death row population by race varies significantly according to the State. Indeed, in 16 States (in bold in the following spreadsheet), the percentage of black people is above the national average, reaching 100% in the state of New York. Most of the States where the percentage of black inmates among the death row population is superior to the national average are situated in the south. Indeed, the States of Alabama (with 48% of black people in the death row), Arkansas (with 62%), Colorado (50%), Georgia (47%), Louisiana (63%), Mississippi (53%), North Carolina (57%), and Virginia (60%) all are situated in the Southeast and have a higher proportion of black people on death row. Fig. 19) Death Row Populations by Race and by State (2007)43(*)
Considering the state of California, the following table extracted from a study44(*) carried out in 2005, shows that within the death row population of the State - the largest of the United States - the different communities are not represented in prison in the same proportions as in the whole State. Here, as in the south-east, the African American community is much more represented (36%) in comparison with the population (6.7%). This raises the question of whether death sentencing rates for African Americans are disproportionate to the rate of involvement of African Americans in capital offenses. According to Human Right Watch, in twelve states, between 10% and 15% of adult black men are in jail.45(*) Fig. 20) Racial Breakdown of California Death Row Inmates and State Population
d) Racial discrimination by function of the defendant and the victim In order to discover if there actually is racial discrimination at work in the application of the death penalty, this paper will investigate the role of race in capital sentencing, and in particular, whether the race of the defendant or victim influences the likelihood of the death sentence. «Of the 205 people executed for inter-racial murders in the USA, for example, 193 were black defendants charged with killing a white person, while only 12 were white defendants charged with killing a black individual.»46(*) According to a study47(*) carried out by the Federal Bureau of Investigation, «in homicides where the race of the offender was known, 50.0 percent were black, 47.6 percent were white, and 2.4 percent were other races.» By comparing these rates to the composition of the death row population, we can see that 42% of death row inmates are black. It seems that death sentence is not given more quickly to black offenders. One can also investigate the race of the victims in criminal cases. The same study carried out California shows clear regional disparities in death sentencing, with counties in California that have a lower population density and a higher proportion of non-Hispanic whites in their populations to have the highest rates of death sentences. California leads the country in the number of homicides perpetrated (in 2001, there were 2,206 homicides in the state, followed by 1,332 in Texas, 986 in Illinois, 960 in New York, and 874 in Florida). Between 1980 and 1997, 37.6% of the homicide victims were Hispanic (while they represent 25.8% of the population), 29.4% were African Americans (for 7.4% of the population), 27.6% were white (43.2% of the population), and 5.4% were Asian or from another community (representing 23.6% of the population of the state). According to the study, African Americans are therefore more likely to be a victim of a homicide. The victimization rate for African Americans in California is high, but not unusual. National estimates from the National Crime Victimization Survey in 2000 show that African Americans reported 34.1 instances of victimization from violent crime per 1,000 population, compared to 27.9 for Hispanics, 26.5 for whites, and 8.4 for Asians. The study also found that those who killed whites were over 3 times more likely to be sentenced to death than those who killed blacks and over 4 times more likely than if a Hispanic had been killed. Fig. 21) Race of Victim in Death Penalty Cases (2006)48(*)
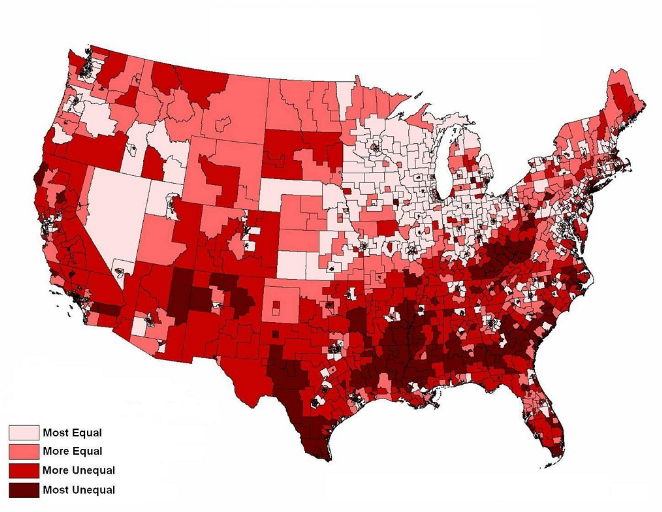
According to a study established by the Death Penalty Information Center, while 14% of cases resulting to a capital sentence involve a homicide in which the victim was black, this figure rises by 79% when it involves a white victim. These figures could simply show that in a big majority of murder cases, the victim is white. But according to the Federal Bureau of Investigation, in 2004, only 49.8% of murder victims are white and 47.6 percent are black50(*). According to these figures, a murder involving a black victim results less often in the offender being sentenced to death. Indeed, in 47.6% of the homicides cases, the victim is black, whereas only 14% of the cases involving a black victim results to a death sentence. According to a study51(*) conducted in 2003 by Baldus and Woodworth, «cases involving black defendants and white victims are treated more punitively than cases with all other defendant/victim racial combinations». Another study shows that "the post-Furman remnants of racism are most apparent in cases involving black defendants and white victims."52(*) Such occurrences are even more obvious in rape cases. This phenomenon is called the `race-of-the-victim effect' by the General Accounting Office53(*). Thus, criminal courts are stricter in the application of the death penalty when the victim is white, which is in itself discriminative. Justice should be equal towards each citizen, according to the 14th Amendment of the Constitution which stipulates, in Section 1, that a state government should not deny «to any person within its jurisdiction the equal protection of the laws.» This equal protection clause should protect individuals from arbitrary discrimination by government officials. Despite this Amendment, it is known that black Americans do not enjoy equal protection of the laws. In the past already, the 1896 Supreme Court decision in Plessy v. Ferguson exemplified the denial of equality to black Americans in its sanction of «separate but equal» treatment of people based on race. Both before and after Plessy, racial segregation was a firmly established fact of American life, with the separate facilities for blacks hardly ever equal to those provided for white Americans, in front of economic and social conditions, education, work and, of course, justice. According to the authors of `The Rope, the Chair and the Needle'54(*), black defendants are much more likely to be sentenced to death in interracial rapes than white rapists and black murderers who rape their victims before killing them are the most likely of any group to receive death penalty. A comprehensive study55(*) of the death penalty in North Carolina also scrutinized all homicide cases that occurred in the state over a five-year period, from 1993 to 1997 in order to attempt to identify which homicides are more likely to end in the death sentence. Among the 3,990 homicide cases that took place during that period, 99 first-degree murder cases eventually received death sentences, and 303 first-degree cases received life sentences. The study, carried out in 2001, finally found that the chances of receiving a death sentence in North Carolina rose by 3.5 times among those defendants whose victims were white. 3) Economic influence concerning death penalty and its application The following map demonstrates the inequality of income in the United States. It is interesting to compare this map to figure 16, `Percentage of Black or African Americans', on page 40, which shows that the areas where there is a concentration of the Black community correspond to those where the economic disparities are more important. This paper will not go further on this line of study but will consider that this population is the poorest of American society. Figure 21 goes further still, highlighting links between States where economic disparities are the lowest, and where the death penalty has been abolished (see figure 7 `Death Penalty Statutes in the United States' on page 18). Indeed, most of the abolitionist states--such as North Dakota, Minnesota, Wisconsin, Iowa, Michigan, Rhode Island, Massachusetts and Vermont--which are situated in the Midwest and Northeast of the country, correspond to those where there are the fewest income inequalities. In Kansas and New York State, where there have been no executions since 1976, the level of disparity is considered as the `most equal' or at least `more equal'. In the same time, the map also shows that the region of the Southeast has a more unequal income distribution. One could pose the hypothesis that economic inequalities are at the origin of a stricter application of death penalty due to a certain racism and conflict between the different communities which compose American society. Fig. 22) Household Income Inequality in the United States (2000)56(*)
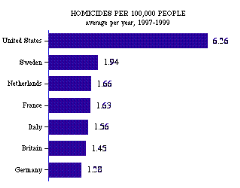
Many studies have proven that poor people coming from minority populations are more likely to be sentenced to death, resulting in an equally poor representation during the trial. Indeed, most of the time a poor defendant -- often from a minority -- cannot afford a lawyer and is represented by a lawyer appointed by the State. Not only do economic disparities create social unbalance, but they also create inequality before the justice system. 4) Criminal rate and deterrent effect As we know from different studies, films and documentaries, the United States is an uncommonly violent country. As we can see below, the homicide rate is about three times higher than it is in most of the Western European countries. It is difficult to give a reason for such a figure. Fig. 23) Murders in Europe and the United States57(*)
Film-maker Michael Moore has suggested that the omnipresence of arms in the country and the general mistrust and fear of the American citizens could be the source of this violence. In his documentary Bowling for Columbine (2002), he seeks the reasons for such high rates of violence and the legality of bearing arms. In 1997, 32,436 persons died because of a firearm, and 64,207 were injured. In the United States, death by firearms is the second cause of mortality after car accidents. «In Great-Britain, 19 people per year are killed; in France, they are 109; in the United States, 5285.»58(*) The right to bear arms is almost a fundamental one, written in the United States Constitution in the Second Amendment «A well regulated militia, being necessary to the security of a free state, the right of the people to keep and bear arms, shall not be infringed.» Organizations such as the National Rifle Association fervently defend this right and form a powerful firearm lobby. In his book `Death penalty in the United States', André Kaspi, considered as the specialist on American society, proposes the explanation of drugs as a factor of violence. «Drug addicts with withdrawal symptom, looking for the necessary money to buy their daily dose, steal, burglarize and kill.»59(*) Kaspi also suggests that racism can explain the existing violence. As shown in the following document60(*), the crime rate is much higher in the South than in any other region, with 6.2%, in comparison with 4.7%, the national rate. Economic disparities are a factor in the unbalance, confirming a link between relative poverty and crime. Fig. 24) Murder and Non Negligent Manslaughter
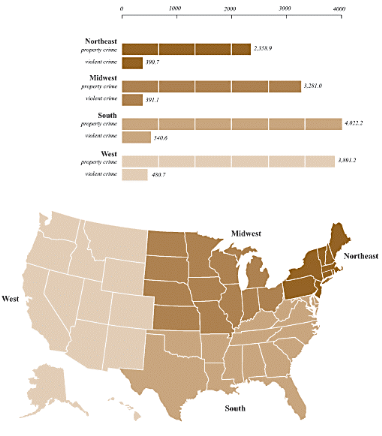
The following document established by the Federal Bureau of Investigation confirms that the South is the region of the country where there is the bigger number of property crimes as well as violent crimes. According to the institution, the South accounts for over 80% of executions. The Northeast, which has less than 1% of all executions, again had the lowest murder rate. Fig. 25) Regional Crime Rates per 100,000 Inhabitants61(*) (2004)
The question of deterrence has been widely studied by organizations such as the National Coalition to Abolish the Death Penalty. «The average murder rate per 100,000 people in U.S. states with capital punishment is about 8%, while it is only 4.4% in abolitionist states. (...) In California, between 1952 and 1967, there was an average of one execution every two months. From 1968 to 1991 there were no executions. The homicide rate was twice as high in the earlier period than it was in the latter. In New York, between 1907 and 1964, 692 executions were carried out. On average, over this 57 year period, one or more executions in a given month added a net increase of two homicides to the total committed in the next month.»62(*) In 2000, The New York Times carried out a study63(*) on 10 of the abolitionist states. It appeared that the average murder rate in death penalty states was higher than the average rate in non death penalty states. «Wisconsin was the first state to abolish death penalty, in 1853. Twice less crimes are committed there, than in Texas, the state that account for the larger number of executions.»64(*) In 1976, Canada has abolished death penalty and the murder rate declined slightly the following year (from 2.8 per 100,000 to 2.7) and since, the general trend is clearly downwards. It seems that the existence of death penalty does not deter crime. We will not go further into this analysis of the effectiveness of death penalty as deterrent, but it is clear that the general trend is that the death penalty is not an effective tool for the judicial system. * 26 See appendix 5 `Capital Offence By State 2005' on page 81 * 27 See figure 11 on page 30 * 28 http://www.mcadp.org/LancetEditorial4_05.htm * 29 http://www.handsoffcain.info/bancadati/index.php?tipotema=arg&idtema=9000520 * 30 http://www.clarkprosecutor.org/html/death/usexecute.htm * 31 Leon, Enrique (1998). Démocrates et Républicains aux États-Unis au XXe siècle, Partis politiques et groupes de pression. Paris : Colin. Page 46 * 32 Lassale, Jean-Pierre (1997). Les Institutions des Etats-Unis. Paris : La Documentation Française. Page 42 * 33 Jacobs, David; Stephanie, Ken; Jason, Carmichael (August 2005). «Vigilantism, Current Racial Threat and Death Sentences», American Sociological Review. Page 661 * 34 Source: http://en.wikipedia.org/wiki/Image:Governors.PNG * 35 Jacobs, David; Stephanie, Ken; Jason, Carmichael (August 2005). «Vigilantism, Current Racial Threat and Death Sentences», American Sociological Review. Page 657 * 36 See figure 10 on page 21. * 37 http://www.deathpenaltyinfo.org/article.php?did=477&scid=8 * 38 http://www.deathpenaltyinfo.org/article.php?did=477&scid=8 * 39 US Census Bureau, Census 2000 http://www.census.gov/prod/2001pubs/cenbr01-1.pdf * 40 http://www.cdc.gov/pcd/issues/2006/jan/images/05_0055_02.gif * 41 Even if the figures concerning the national population and the death row population are not from the same dates, such conclusions can be done today, since the composition of the population of the United States has not drastically changed. * 42 Both these pie chart were established by the Death Penalty Information Center http://www.deathpenaltyinfo.org/FactSheet.pdf * 43 Source: http://www.deathpenaltyinfo.org/article.php?scid=5&did=184 Author : Julie Rérolle * 44 http://www.deathpenaltyinfo.org/CaRaceStudy.pdf * 45 http://www.hrw.org/backgrounder/usa/race/ * 46 http://www.mcadp.org/LancetEditorial4_05.htm * 47 Federal Bureau of Investigation http://www.fbi.gov/ucr/cius_04/offenses_reported/violent_crime/murder.html * 48 http://www.deathpenaltyinfo.org/FactSheet.pdf * 49 http://www.fbi.gov/ucr/cius_04/documents/CIUS_2004_Section2.pdf * 50 http://www.fbi.gov/ucr/cius_04/offenses_reported/violent_crime/murder.html * 51 Baldus, David C; George Woodworth (2003). Race Discrimination in the Administration of the Death Penalty: An Overview of the Empirical Evidence with Special Emphasis on the Post-1990 Research 39 Criminal Law Bulletin 194-226. * 52 Marquart, James; Sheldon, Ekland-Olson; Jonathan, Sorensen (1994). The Rope, the Chair, and the Needle: Capital Punishment in Texas. Austin: University of Texas. Page 184 * 53 «Death Penalty Sentencing: Research Indicates Pattern of Racial Disparities», GAO-GGD (February 1990) * 54 Marquart, James W.; Ekland-Olson, Sheldon and Sorensen, Jonathan R. (1993). The Rope, the Chair, and the Needle: Capital Punishment in Texas, 1923-1990. Houston: University of Texas Press. * 55 Carried out by Prof. Jack Boger and Dr. Isaac Unah, University of North Carolina, 2001 * 56 Data source: US Census 2000 http://www.carseyinstitute.unh.edu/images/photos/US_income_Inequal_5-15-2006_rev.jpg * 57 Source: British Home Office http://www.deathpenaltyinfo.org/euusdeter.GIF * 58 Kaspi, André (2003). La peine de mort aux Etats-Unis. Paris: Plon. Page 33 * 59 Kaspi, André (2003). La peine de mort aux Etats-Unis. Paris : Plon. On page 100 * 60 Source: http://www.fbi.gov/ucr/05cius/data/table_30.html author: Julie Rérolle * 61http://www.fbi.gov/ucr/cius_04/images/content_images/2.16.gif * 62 http://www.ncadp.org/html/fact5.html * 63 "States With No Death Penalty Share Lower Homicide Rates", www.nytimes.com/2000/09/22/national/22STUD.html * 64 http://www.revoltes.org/projetabolition.htm |
| |||||||||||||||||||||||||||||||||||||||||||||||||||||||||||||||||||||||||||||||||||||||||||||||||||||||||||||||||||||||||||||||||||||||||||||||||||||||||||||||||||||||||||||||||||||||||||||||||||||||||||||||||||||||||||||||||||||||||||||||||||||||||||||||||||||||||||||||||||||||||||||||||||||||||||||||||||||||||||||||||||||||||||||||||||||||||||||||||||||||||||||||||||||||||||||||||||||||||||||||||||||||||||||||||||||||||||||||||||||||||||||||||||||||||||||||||||||||||||||||||||||||||||||||||||||||||||||||||||||||||||||||||||||||||||||||||||||||||||||||||||||||||||||||||||||||||||||||||||||||||||||||||||||||||||||||||||||||||||||||||||||||||||||||||||||||||||||||||||||||||||||||||||||||||||||||||||||||||||||||||||||||||||||||||||||||||||||||||||||||||||||||||||||||||||||||||||||||||||||||||||||||||||||||