|
An assessment of plankton diversity as a water
quality
indicator in small man-made reservoirs in
the Mzingwane Catchment, Limpopo
basin,
Zimbabwe
B y
Lefranc BUSANE Basima
A thesis submitted in partial fulfillment of the requirements for
the degree of Masters in Integrated Water Resources Management
University of Zimbabwe Department of Civil Engineering

AN ASSESSMENT OF PLANKTON DIVERSITY AS A WATER QUALITY
INDICATOR IN SMALL MAN-MADE RESERVOIRS IN THE MZINGWANE CATCHMENT, LIMPOPO
BASIN, ZIMBABWE
By
Lefranc BUSANE Basima
A thesis submitted in partial
fulfillment of the requirements for the
degree of Masters in Integrated
Water Resources Management
Supervisor: Prof. B. Marshall
Co-supervisor: Dr. A.
Senzanje
Department of Civil Engineering
University of Zimbabwe
ABSTRACT
Land use changes are believed to have considerable impacts on
water quality of reservoirs, which is at present a global issue considering its
implications to humanity. This thesis reports on a study carried out in the
southern part of Zimbabwe in the Mzingwane catchment, Limpopo basin to
investigate the impacts of land and water use on the water quality and
ecosystem health of eight small man-made reservoirs. Four reservoirs were
located in communal lands while the remaining four were located in a National
Park (Matopos) considered pristine. Plankton community structure was identified
in terms of abundance and diversity as an indirect assessment of water quality
and ecosystem health. In addition, phosphorus, nitrogen, pH, transparency,
electroconductivity and hardness were analysed. The results obtained indicate
that the communal lands' areas have not gone through major land and water use
changes that impact on the quality of reservoirs since no significant
difference was obtained between communal lands and the National Park in terms
of plankton community (P>0.05). Though the highest phytoplankton abundance
was observed in April, February showed the highest number of taxa (highest
diversity). Chlorophytes was the major group in both periods with 29 genera in
February and 20 in April followed by Diatoms with 17 genera in February and 12
in April. The zooplankton community was less diverse and less abundant and did
not show any seasonality pattern. Normal levels of phosphorus (0.022#177;0.037
mg/l) and nitrogen (0.101#177;0.027 mg/l) were obtained and comply with the
natural levels in fresh water and WHO guidelines for drinking water. The
transparency of water was very low (ca. 27 cm secchi depth) in 75% of the
reservoirs with some having a whitish (milky) colour with a likely effect of
reducing light penetration and therefore photosynthesis in addition to low
nutrient levels. The thesis concludes by acknowledging an acceptable status of
the communal lands vis-à-vis the water quality and ecosystem health of
reservoirs but urges water managers to continuously monitor these multipurpose
reservoirs in order to be assured of their quality as well as to prevent
possible detrimental land and water uses.
DECLARATION
I, Lefranc Busane Basima, declare to the senate of the
University of Zimbabwe that this thesis is my original work and all other
sources of material used are duly acknowledged. This work has not been
submitted to any other university for any academic award.
Signature
Lefranc Busane Basima University of Zimbabwe
Dept of Civil Engineering Zimbabwe
July 2005
DEDICATION
To my father Busane Chentwali Lambert who guided my first steps
in assiduity at work;
To my mother Buhendwa Brigini Nabintu who showed me, through
perseverance and abnegation, the way of salvation and of hard work;
To Prof. Muhigwa Bahananga, J-B who taught me to think and dream
big and who opened the «English world» to me;
To all those who have endured sacrifices in one way or another
to make me complete this work. May you learn that «sacrifice is the
great work of joy, the filial act par excellence, the act through which a
profane thing becomes sacred, a lost being can find himself again, a temporal
thing becomes eternal, and something soiled is consecrated».
To all those «Epris de Justice et de Paix»
«Take away from me the noise of your songs... but let
justice roll down like waters, and righteousness like an overflowing
stream». Amos 5,21-24
ACKNOWLEDGEMENTS
This work has been the fruit of the efforts of many people to
whom we feel greatly indebted.
A sincere acknowledgment is made to Prof. B. Marshall from the
Biology Dept. who kindly accepted to supervise this work and to generously
provide equipments, manuals and other facilities in addition to his valuable
guidance.
I am greatly indebted to the co-supervisor Dr A. Senzanje who
made everything
possible. His great sense of humanity and understanding,
availability and
disposition to assist, and his allocation of working
facilities will never be forgotten.
Chhatra Mani Sharma (PhD candidate at the NORAGRIC/Sweden) and
Kate Shick (Montana/USA) kindly revised the manuscripts. Prof. Muhigwa
Bahananga Jean-Berckmans (from the University of Kisangani-CUB) assisted in the
statistical analysis of our data. Ass. Mulongaibalu Mbalassa (MAKERERE
University) helped us in the identification of macrophytes.
The fieldwork was made possible by the unconditional
assistance of Lennart Woltering (TU Delft/Netherlands), Terry Marima (SSAE-UZ)
and Sawunyama Tendai.
The kind assistance of David Love with accommodation at
ICRISAT-Bulawayo, Mrs Elisabeth Munyoro with books and lab materials, Chief
technician T. Tendayi for the physico-chemical analysis and The National Parks
offices in Harare and Bulawayo in allowing us to sample in the Matopos National
Park was greatly appreciated.
Many thanks to the support in any kind of Prof Muhigwa
(UNIKIS-CUB), Papa Lunanga (UNIKIS-CUB), Dr Trinto Mugangu, Prof Bashwira S.,
Jean de Dieu Boroto (GWP-SA), Dr Kim Prochazka (IOSA-SA), Anton Earle
(IWMI-SA), Ian Ford (UWC), Me Wenceslas Busane Ruhanamirindi, Bellarmin B.
Ntaboba, Emmanuel B. Aganze, Sr Bertille B. Bintu, Flle Lambertine B. Lola,
Flle Jacques Birugu and Solange Bashwira.
Last but not least, I am very grateful to Prof. Simbi (Dean of
Faculty of Engineering), without whom this work could have never been started.
His great paternal sense and understanding, allowed me to become what I am
today. May you feel rewarded by this humble acknowledgement!
The CPWF Small Reservoirs Project (SRP) PN46 sponsored this
thesis fieldwork while WATERnet sponsored our studies in IWRM Masters program
in collaboration with UNESCO-IHE/Netherlands.
TABLE OF CONTENTS
LIST OF TABLES x
LIST OF FIGURES xi
LIST OF FIGURES xi
LIST OF ANNEXES xii
I. Introduction 1
1.1 Background 1
1.3 Hypotheses 6
1.4 Objectives 7
II. Materials and Methods 8
2.1 Study area 8
2.1.1 Land and water use in the communal Lands 13
2.1.2 Land and water use in the National Park 15
2.2 Data collection 16
2.2.1 Plankton samples 16
2.2.2 Physical and chemical data 16
2.2.3 Water samples 18
2.3 Data analysis 19
III. Results 20
3.1 Land and water use in the area 20
3.2 Water quality 22
3.3 Plankton community composition 23
3.3.1 Phytoplankton 23
3.1.2 Zooplankton 28
3.1.3 Overall plankton abundance 33
3.1.4 Relationships between physico-chemical parameters and
plankton species in
the studied reservoirs 35
IV. Discussion 38
4.1 Water quality aspects, land and water use 38
4.2 Plankton commun ity composition, divers ity and abundance
in relation to
land and water use 40
4.2.1 Seasonal variation in plankton diversity and abundance
40
4.2.2 Plankton composition 42
4.2.3 Study limitations 44
4.2.4 Management implications 45
V. Conclusion 46
VI. References 47
Annexes Error! Bookmark flot defifled.
LIST OF TABLES
Table 2.1. Limpopo basin: areas and rainfall by country 9
Table 2.2. Some characteristics of small reservoir the studied
reservoirs in the communal
lands, Insiza district, Zimbabwe. 13
Table 2.3. Rainfall
pattern in Filabusi district and Sibasa village area during 2004/2005
(Insiza District) 14
Table 3.1. Littoral soil samples Color,
pH and Electro conductivity (uS/cm), water colour
and littoral vegetation score (estimated) 21
Table 3.2. Texture of soils around the studied small reservoirs
21
Table 3.3 Water quality of the studied reservoirs (for April 2005
samples) 22
Table 3.4. Composition and density (ind. l-1) of the
phytoplankton in eight reservoirs
located on communal lands and National Park in rural Zimbabwe.
24
Table 3.5. Phytoplankton diversity: number of taxa recorded in
the study area 25
Table 3.6. Simpson's diversity index calculated on February and
April samples 26
Table 3.7. Abundance of major groups for February samples (no.
l-1) 26
Table 3.8. Abundance of major groups for April samples (ind.
l-1) 27
Table 3.9. Abundance of zooplankton (no.l-1) for the
samples of February and April 29
Table 3.10. Abundance of major zooplankton groups/February 31
Table 3.11. Abundance of major zooplankton groups /April 31
LIST OF FIGURES
Fig. 2.1. Map of the Limpopo basin (from Encarta library 2003)
9
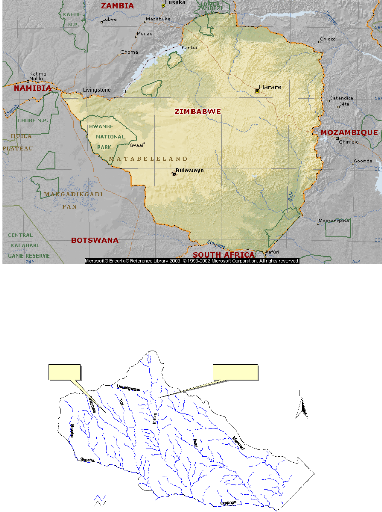
Fig 2. 2. Map of Zimbabwe (from Encarta Library 2003) 10
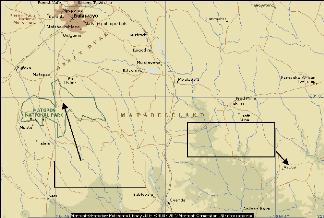
Fig. 2. 3. Map of the Mzingwane Catchment (Limpopo basin in
Zimbabwe) 10
Fig 2.4. Location of the study sites 12
Fig.2.5 Location of reservoirs in the Mzingwane catchment 12
Fig 3.1 Abundance of major groups in February 28
Fig. 3.2 Abundance of major groups in April 28
Fig. 3.3. Zooplankton species distribution and abundance (numbers
of zooplankton per litre in the right) among the 8 reservoirs/ February
30
Fig. 3.4. Zooplankton species distribution and abundance (numbers of
zooplankton per
litre in right) among the reservoirs/ April 31
Fig. 3.6 Abundance of zooplankton major groups in the study area
33
Fig. 3.9 Clustering of stations according to the overall plankton
abundance/ February 34
Fig. 3.10 Clustering of stations according to the overall
plankton abundance/ April 35
Fig. 3.11 Relationship between chemistry and zooplankton in the
studied reservoirs 36
Fig. 3.12 Relationship between chemistry and phytoplankton in the
studied reservoirs 37
LIST OF ANNEXES
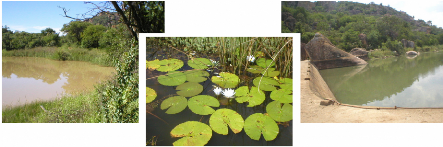
Annex 1. Fig. A to F: A. Whitish color of Sibasa reservoir
waters; B. Algal bloom in Chitampa reservoir; C. Sibasa reservoir; D. Mpopoma
reservoir; E. Maleme reservoir dam wall; F. Dewa reservoir Error!
Bookmark not defined.
Annex 2. Fig. G-H-I-J: Littoral and floating dominant
vegetation in Mezilume reservoir. G: Polygonum sp., H. Numpheae
sp, Cyperus sp. and Ceratophyllum sp.; I:
Myriophyllum sp. and J. Numphaea sp. Error! Bookmark
not defined.
Annex 3. Fig. K-P. Examples of phytoplankton taxa identified.
K: Rhizosolenia; L: Anabaena; M: Ceratium; N:
Pediastrum; O: Phacus; P: Micrasterias sp
Error! Bookmark not defined.
Annex 4. Fig. Q-V. Examples of Zooplankton taxa identified. Q:
the rotifer Brachionus sp.; R: the cladoceran Bosmina
sp.; S: a cladoceran (Daphnia???); T: the rotifer
Keratella sp.; U: the copepod Cyclops sp.;
V: the rotifer Keratella sp. Error! Bookmark not
defined.
Annex 5. Water colors influence. Analysis of variance
(combiapr.sta) Marked effects are
significant at p< 0.05) Error! Bookmark not
defined.
Annex 6. Influence of soil classes. Analysis of variance
(combiapr.sta) Marked effects
are significant at p< 0.05) Error! Bookmark not
defined.
I. Introduction
1.1 Background
Water quality is at present a global issue, especially when
considering its implications to humanity in terms of water borne diseases
(Ongley, 1996). The deterioration of water quality has led to the destruction
of ecosystem balance, contamination and pollution of ground and surface water
resources (Ongley, 1996). Very soon quality will become the principal
limitation for sustainable development in many countries. The crisis of
freshwater quality is predicted to have the following global dimensions
according to Ongley (1996): decline in sustainable food resources due to
pollution; cumulative effect of poor water resources management decisions
because of inadequate water quality data in many countries; many countries can
no longer manage pollution, leading to high level of aquatic pollution,
escalating cost of remediation and potential loss of
«creditworthiness». It is widely accepted nowadays that land use
changes have a huge impact on the water quality of reservoirs. In the Great
Lakes of America for example, rapid population growth, intensive industrial and
agricultural activities, and sprawling urban development have resulted in
significant stress to the near-shore ecosystem (Thorp et al., 1996).
Anthropogenic development of Lake Kivu's shoreline in the Bukavu basin has
resulted in a change of littoral aquatic biota of the area, many of the species
having disappeared (Basima et al., 2005).
Water quality can be defined as an ensemble of physical,
chemical and biological (including bacteriological) characteristics of the
given water (Straskraba and Tundisi, 1999). Which characteristics are
considered important depend on the intended use of the corresponding water;
safe drinking water has to fulfil many restrictions, for example. Water quality
investigations are carried out to provide information on the health of water
bodies and for developing strategies that help in better management of
catchment and water resources. In particular, they may assist in preparing an
impact assessment, forecasting `what if' scenarios, and assessing the state of
the ambient water environment and trends. The investigations may be a single
study to tackle a particular water quality
related issue, or they may be an ongoing program to monitor
water quality and understand long-term impacts of land uses and other
activities in the catchment (Brainwood et al. 2004).
A number of techniques are available, which use the response
of different biological species to assess water quality. These techniques
include the South African Scoring System (SASS) developed by Dr Mark Chutter
(Davis and Day, 2002), The British River Invertebrate Prediction Classification
(RIVPACS), The Australian National River Health Programme (AusRivAS)
(Muthimkulu, 2004) and The Nepalese Biotic Score (NEPBIOS) (Sharma, 2003). The
biological assessment of surface waters started more than a century ago and
consisted mainly of the analysis of the differences of organisms living in
clean waters from organisms living in polluted waters (Rosenberg and Resh,
1993, Sharma and Moog, 1996 in Sharma, 2003). It is known that ecosystem
functioning reflects the collective life of plants, animals, and microbes and
the effect their activities-, such as feeding, growing, moving, and excreting
waste, -have on the physical and chemical conditions of their environment
(Naeem et al. 1999).
Plankton constitute the foundation of the food web in aquatic
ecosystems and represent one of the most direct and profound responses to
pollution entering reservoirs1. Plankton is regarded as the
community of plants and animals adapted to suspension in the sea or in
freshwater, which is liable to passive movement by wind and current (Reynolds,
1984). These microscopic plants and animals are conveniently segregated into
the terms «phytoplankton» and «zooplankton» respectively,
though there are differences in opinion where the dividing line is drawn
(Cander-Lund and Lund, 1995). The plankton proliferation is greatly affected by
the water quality (Schindler, 1978) and the predatorprey relationships in the
reservoir (Arcifa et al., 1986). Water quality is in turn affected by
land use and water sources. Brainwood et al. (2004) presented evidence
to suggest that within reservoirs, chemical trends are strongly linked with the
differing water sources. Trends were evidenced by quite distinct patterns of
water chemistry (Brainwood et al. 2004), which are related to nutrient
inputs.
1
http://www.dnr.state.md.us/bay/monitoring/mon_mngmt_actions/chapter5.html
The great majority of Zimbabwean rural population lives in
areas where the mean annual rainfall is below 80 mm and extremely erratic.
Soils in this region tend to be infertile sands to sandy loams (Moyo, 1995;
Grant, 1981). This unfortunate status makes small, man-made water reservoirs
important in Zimbabwe. Their importance is indicated by the fact that 7,000
such reservoirs have been constructed since independence in response to
recurrent droughts (Senzanje and Chimbari, 2002). Reservoirs are classified in
Zimbabwe as small, medium, large or major in consideration of the maximum
height above cleared foundation level and gross capacity (Kabell, 1986). Kabell
(1986) defines small reservoirs as one below 106 m3 of capacity and
a dam wall height below 8 m. Straskraba and Tundisi (1999) classify reservoirs
according to their size capacities. A reservoir was considered small if it had
an area of 1 to 100 km2 and a capacity of 1 million to 100 million
m3 (106-108 m3). Straskraba and
Tundisi (1999) call very small reservoirs those of less than one million
m3 of capacity and an area of less than 1 km2. Small
reservoirs in Zimbabwe are often neglected though they support a number of
activities in many parts of the country. This is shown by the fact that very
little information exist on the capacities, year of construction, water storage
capacity, depth of water, sedimentation and most of all about their ecosystems
health. Water quality is not monitored and it is difficult to state whether the
quality is acceptable or not with regard to the intended uses.
The small reservoirs that are the object in this study are of
a size less than three million cubic meters (3 x 10⁶ m3) of capacity
and a maximum height of eight (8) m. These reservoirs are multipurpose in use
and the main functions include: water supply for rural people and their
livestock, brick making; small-scale irrigation, gardening, recreation and
tourism, focal point for rural community, small-scale fisheries, wildlife,
aquatic life, and microclimate control (Senzanje and Chimbari, 2002). The
long-term effects of land use dynamics on water quality, and their potential
harm to ecosystem integrity has often been neglected during the planning of
small reservoirs. There is also limited information on the small reservoirs in
terms of biological diversity and responses of organisms to land and water use
factors. Nhiwatiwa (2004) concluded there is a historical bias in limnological
investigations towards larger water bodies like Lake Kariba that resulted in
small reservoirs not being studied. Studies on these water bodies in Zimbabwe
are mainly
focused on improving water availability for sustainable food
production and rural development and are mainly concerned by sedimentation and
siltation problems (Lawrence and Hasnip, 2004; Lawrence and Lo Cascio, 2004a,
Lawrence and Lo Cascio, 2004b, Lawrence and Lo Cascio, 2004c, HR Wallingford,
2004), and increasing productive water use (Mugabe et al. 2003). An
inventory of small reservoirs in Zimbabwe has been done by Senzanje and
Chimbari (2002) and was mainly concerned with ways to rehabilitate or build new
reservoirs, or to assist communities in developing sustainable management
plans/strategies for the catchment area of their reservoirs. However, the
limnology and ecology of these small reservoirs was not addressed. Historical
profiles of small reservoirs in communal areas have been presented by Zirebwa
and Twomlow (1999). A comparison of organochlorine pesticide residues in Upper
Ncema and Lower Umguza Dams (Zimbabwe) was done by Siwela et al.
(1996). DDT and other pesticides originating from farms were found in fish
species. These pesticides might have detrimental consequences to aquatic
organisms and to a certain extent to humans who feed on them. On the few works
done on plankton in Zimbabwe, Thornton and cotterill (1978) provided a list of
phytoplankton and zooplankton species occurring in five small reservoirs in the
Eastern Highlands, while Green (1990) made a list of zooplankton in eighteen
small reservoirs in Marondera and Nyanga. Nhiwatiwa (2004) is among the few
authors who studied the limnology and ecology of two small reservoirs in
Zimbabwe. The two small reservoirs were built in series on the Munyahuku River.
He concluded that very little is known about the ecology of such small water
bodies, and that further investigation into this topic is warranted.
Because of this lack of basic ecological knowledge, and the
potential for water quality to change as a result of anthropogenic activities,
it is important to ecologically assess small reservoirs that exist in rural
Zimbabwe. Certain knowledge of the responses of biota to changes in water
quality could constitute an important tool to be used by water managers in
Zimbabwe to continually and rapidly asses s the quality of waters that they are
managing. The present work will focus on an assessment of zooplankton and
phytoplankton diversity as a well as some water quality parameters in relation
to land and water use on eight selected small reservoirs in the semi arid
region of Zimbabwe.
The variability in consideration of reservoirs is highly
dependent on the many purposes for which they have been built, as there is some
correspondence between their features and their uses (Straskraba and Tundisi,
1999). Small reservoirs differ from large ones in that there are usually no
strict rules and regulations guiding access and usage of the water resource.
Also they have a semi permanent character in terms of water content and tend to
dry out during part of the year (Wotro, 2004).
The importance of the ecological status of surface water
systems have been recognized and have contributed to our understanding of the
health of our systems2. The biological state of health of small
reservoirs is to a large extent a function of their use and the land use in the
reservoir catchment area. Small reservoirs are known to cause some negative
environmental and health impacts; they create or enhance ecological
environments that are favourable to the proliferation of vector borne diseases
like malaria and schistosomiasis (Hunter et al., 1982; Oomen et
al., 1994; Bolton, 1994) and water related diseases. It is believed that
different nutrient inputs are flowing to small reservoirs in such areas. Since
nutrients are the major support of the proliferation of the phytoplankton
community, it is interesting to know how the discharges from different
activities affect the plankton community structure. National Parks are
considered to have conditions near to pristine and have been selected as
control sites while doing this investigation. This study may have important
implications on the integrity of ecosystems and therefore on the integrity of
the catchment as a whole. The major activities that take place in the study
area will be identified for the characterization of the reservoirs and for
effective comparisons. The results of the study may show some water resources
management implications and might provide guidance for better management of
water resources with due respect to land use activities. Findings of this
investigation will enable policy and decision makers to find a way forward in
the management plans and actions in areas that are having similar
characteristics.
Water quality management is important to water managers and
decision makers who
often need an understanding of the interactions in small
water bodies ecosystems as well
2 See
http://www.csir.co.za/rhp/provinces/wcape
capementro.html
as short term corrective solutions. The short-term solutions
aim at diminishing difficulties and long-term solutions that aim to prevent
problem creation. The most important management items are summarized in
Straskraba and Tundisi (1999). These management items include: - negligence of
interrelations of problems might create new unexpected ones; - planning ahead
is a step toward success; - responsibility to our children and grand-children
mandate fundamental attention to sustainable development; - consideration of
biogeophysical, economic and social aspects is fundamental; - environmental
impact assessment procedures are useful decision-making tools; - monitoring is
an important decision-making tool; - most reservoirs are or eventually become
multipurpose that is the basis for conflicts, resolution of these conflicts is
enabled by joint participation of the respective parties. The reservoir water
quality management publication (Straskraba and Tundisi, 1999) shows managers
the importance of a whole system approach and respect to water quality
problems. It further shows water quality engineers the need for more advanced
theories and inclusion of biological considerations in management decisions.
More, it shows limnologists the strength of the whole system approach and the
need to include catchments and considerations of human activities including
socio-economic and political aspects.
It is important to note that very few investigations have been
done on small reservoirs in Zimbabwe, particularly on biological assessment of
the integrity of these fragile ecosystems (Twomlow, pers.comm.). This
investigation will be therefore a contribution to the understanding of the
biology and health of small reservoirs as well and will provide a starting
point to future researchers in their management.
1.3 Hypotheses
The main hypothesis assumed is the following: Land and water use
activities have negative influence on the water quality of small man made
reservoirs in Zimbabwe.
The following sub-hypotheses are derived from the main hypothesis
and are:
1. Reservoirs located in National Parks and communal lands
exhibit
differences in physical and chemical characteristics resulting
from land use
practices (these differences include a more turbid and nutrient
rich water
column on communal lands and a less turbid and nutrient rich
water column in National Parks).
2. Differences in the physical and chemical characteristics of
reservoirs between communal lands and National Parks result in ecological
differences in plankton communities (plankton found in reservoirs on communal
lands is expected to be more abundant but less diverse, while plankton in
reservoirs in National Parks should be more diverse).
3. There are no seasonal changes in the plankton community
structure of the small reservoirs.
1.4 Objectives
The main objective of this study is to investigate the impacts
of land and water use activities on the water quality of small man-made
reservoirs. This will be achieved by studying the plankton community structure
as an indirect assessment of the water quality. Therefore, the present study
focuses on the following specific objectives:
1. To identify the major water uses and the activities (land
uses) in the surrounding areas of small reservoirs;
2. To assess some aspects of water quality of small reservoirs
and relate them to land and water uses;
3. To identify the plankton (zooplankton and phytoplankton)
in selected small reservoirs and estimate their abundance and diversity in
relation to land and water use;
4. To make a comparison of the plankton community structure
in the selected small reservoirs located in the Matopos National Park and in
communal land areas and relate to land and water use.
II. Materials and Methods
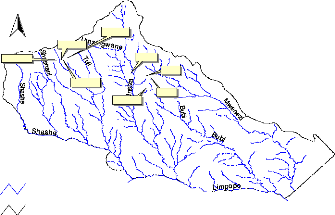
2.1 Study area
This study was carried out in the southern part of Zimbabwe
(Fig. 2.2) in the Mzingwane catchment, within the Limpopo basin. The Limpopo
basin (Fig.2.1) covers up to 1.3 % of the African continent. The Mzingwane
catchment is one of the seven catchment areas that have been demarcated by the
new water legislation of 1998. The six other catchments are Gwayi, Sanyati,
Manyame, Mazoe, Save and Runde. The Mzingwane catchment is located in a semi
arid region that is characterized by highly variable rainfall concentrated in
one rainy season, separated by relatively long dry seasons (Lawrence and
Hasnip, 2004). The Mzingwane catchment is divided into four sub catchments,
which are Upper Mzingwane, Lower Mzingwane, Mwenezi and Shashe (Fig. 2.3). The
annual rainfall in the Mzingwane catchment ranges from 300mm in the south to
635mm in the north (Table 2.1). Temporal distribution of rainfall follows the
general pattern of southern African region. The coldest month (July) when
minimum temperature goes below 0oC as well as the hottest month
(October) are both comprised in the dry months that go from April to October.
The hottest areas are found around Beitbridge (Conley, 1996 in Mwenge, 2004).
The Mzingwane catchment has three major rivers: the Shashe, Umzingwane and
Mwenezi. These rivers flow in the southeastern direction into the Limpopo River
carrying and depositing sediments along their courses. There is almost no flow
in the dry season and riverbeds are sandy alluvial of considerable thickness
providing big storage of water3. One of the major features of
aridity of the catchment is that the mean annual potential evapotranspiration
rates are higher than the mean annual rainfall (1800mm as compared to 465mm).
This status indicates low runoff generation and aquifer recharge (Mwenge,
2004).
3 Waternet CN133, 2003 in Mwenge, 2004
Table 2.1. Limpopo basin: areas and rainfall by country
Country
Total area of
the country
(km2)
Area of the
country within
the basin
(km2)
As % of
total area of
basin (%)
As % of total
area of
country (%)
Average annual
rainfall in the
basin
area
(mm)
|
|
|
|
|
min. max. mean
|
|
Botswana
|
581730
|
80118
|
19.9
|
13.8
|
290 555
|
425
|
|
Zimbabwe
|
390760
|
51467
|
12.38
|
13.2
|
300 635
|
465
|
|
South Africa
|
11221040
|
185298
|
4631
|
65.2
|
290 1040
|
590
|
|
Mozambique
|
801590
|
84981
|
21.1
|
10.6
|
355 865
|
535
|
|
For Limpopo
|
|
401864
|
100.0
|
|
290 1040
|
530
|
(From FAO, 1997)
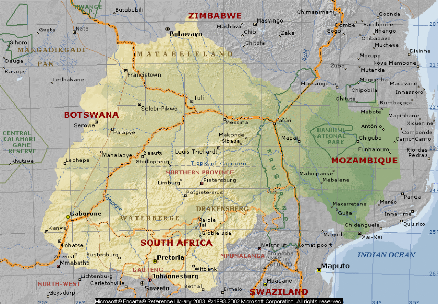
Fig. 2.1. Map of the Limpopo basin (from Encarta library 2003)
Nature Park (Matopos)
UPPER MZINGWANE
Communal lands (Insiza district)
N
MWENEZI
SHASHE
LOWER MZINGWANE
Rivers.shp
Boundary.shp
Fig 2. 2. Map of Zimbabwe (from Encarta Library 2003)
0 100 Kilometers
Fig. 2. 3. Map of the Mzingwane Catchment (Limpopo basin in
Zimbabwe)
The Limpopo River in southeastern Africa, rising as the
Krokodil River in the mountainous Witwatersrand region of northern South
Africa, is a trans-boundary river shared by Botswana, South Africa, Mozambique
and Zimbabwe. The Krokodil River then becomes the Limpopo and continues
northeast along the border between Botswana and South Africa, then east along
the border between Zimbabwe and South Africa. It flows southeast through
southern Mozambique before entering the Indian Ocean near Xai-Xai. The Limpopo
river is one of the most anthropogenically impacted Rivers in the Southern
African region and has vast tracks of its length covered by sand and silt and
seasonal flow only during the rainy season which spans from November to
April.
Site description
The eight selected small reservoirs are located in the
Mzingwane catchment, with four in the Matobo (Matopos) National Park and four
in the Insiza district around Avoca Business centre (Fig.2.4). The National
Park is located 34 km south of Bulawayo, at 28o Longitude East and
20o Latitude South. It represents one of the major tourist
attractions in Zimbabwe. It contains majestic granite scenery; the landscape
has been carved out from an almost flat surface of granite by millions of years
of weathering, resulting in great «whalebacks» and domes, and
castle-like formations (Tregold, 1996). The vegetation in the park is quite
different from that of the surrounding countryside, and supports many species
of animals and prolific bird life. The park is comprised of a game reserve and
a recreational park, both of which contain a number of small reservoirs. The
recreational park (western part) is separated from the game reserve (eastern
part) by the main road Bulawayo-Kezi. Mpopoma and Chitampa reservoirs, in the
game reserve, are respectively located at 7 and 2 km from the entrance gate. In
the recreational park, Mezilume reservoir is located at approximately 5 km from
the game park entrance gate while Maleme is at 7 km. Mezilume and Maleme are
located in the so-called Central Wild Area while Chitampa and Mpopoma are
located in the Whovi Wild Area (Game Park). Fish are abundant in most of these
reservoirs. Avoca Business Centre (in Insiza district) is located at 127 km
east of Bulawayo and its geographic coordinates are 20o 47' latitude
south and 29o 31'longitude east. Fig 2.3 and 2.4 show the location
of selected small reservoirs.
Dams in Matopos NP
Dams in communal lands
Fig 2.4. Location of the study sites
Bo un d ary.s h p
N
Maleme
Chitampa
Mpopoma
~~~~ Sibasa
~
~~
Dewa
Mezilume
~
Denje
Makoshe
Rivers.shp
~ Gps coordinatesfrk.dbf
Fig.2.5 Location of reservoirs in the Mzingwane catchment
A summary of the studied reservoirs located in communal lands
is presented in Table 2.2. The main users of the reservoir are farmers located
mainly downstream of the dam. Sibasa is an old perennial reservoir known to
have survived the drought period being recharged by groundwater.
Table 2.2. Some characteristics of small reservoir the studied
reservoirs in the communal lands, Insiza district, Zimbabwe.
|
Characteristics
|
|
Reservoirs
|
|
|
Makoshe
|
Sibasa
|
Denje
|
Dewa
|
|
Location
Capacity (m3)
Type
Construction period
Nature
|
Ward 6 926,000 Earthy 1997-98
-
|
Ward 11 -
Earthy
1945-50
Perennial
|
Ward 7
- Earthy
-
Not perennial
|
Ward 7
- Earthy
-
Not perennial
|
2.1.1 Land and water use in the communal Lands
Makoshe reservoir is located in a relatively flat area and its
water occupies a large surface. Many standing trees are still present in the
reservoir showing that the area was vegetated before the construction of the
reservoir. The substrate is mainly composed of dark grayish sand (Table 3.2)
(expansive and slippery since mixed with clay) and the littoral land fairly
covered by vegetation. The area may be subject to erosion in time of heavy
rainfalls. Big rocks are located mainly along the dam wall and some are
scattered in the reservoir. Water from the reservoir is allocated to the
following uses: irrigation, domestic, livestock, fishing, garden and drip
irrigation. Drip irrigation is pumping water for 18 ha plot for some
beneficiaries involved in the construction of the reservoir. Approximately 200
households that belong to two villages, Bambanani-Makoshe and Mbawulo, utilize
Makoshe reservoir's water. There are no farms upstream of the reservoir, all
the gardens and farms being located downstream of the reservoir. A number of
birds were observed belonging to the genus Phalacrocorax,
Ceryle, Ceyx, Hirundo and Nectarinia.
The shoreline vegetation of Sibasa reservoir is dominated by
Cyperus spp and the Water Clover Marsilea vestita. The water
is having a whitish (milky) colour. The reservoir is located at 200 m to the
first homestead of Sibasa village that is slightly elevated compared to the
reservoir. The reservoir is mainly allocated to livestock use, though it is
used as well for domestic purposes and recreation (fishing). No farm is located
in the close vicinity of the reservoir. A white granite hill is located
upstream of the reservoir. Some trees are found in the surroundings of the
reservoir as well as some rocks, which are also part of the substrates in the
reservoir. The area has suffered from a shortage of rainfall the whole period
except January where 211 mm of rain where recorded (Table 2.3). Few birds
belonging to Phalacrocorax sp., and Ceryle rudis
were observed actively fishing in the reservoir.
Table 2.3. Rainfall pattern in Filabusi district and Sibasa
village area during 2004/2005 (Insiza District)
|
Area
|
Oct
|
Nov
|
Dec
|
Jan
|
Feb
|
March
|
April
|
Total
|
Mean
|
|
Filabusi DA
|
15.2
|
0
|
1.31
|
112.5
|
4.5
|
31
|
0
|
164.5
|
23.5
|
|
Sibasa village
|
0
|
6
|
0
|
211
|
0
|
0
|
0
|
211
|
31
|
|
Matopos area
|
-
|
6.8
|
163.1
|
160.9
|
105.9
|
55.1
|
5.5
|
497.3
|
82.9
|
Source: Filabusi District Administration and Meteorological
Office in Harare, Zimbabwe
Denje reservoir is mainly located in a rocky and slightly
slanted area with a low vegetation cover in its littoral zone (score 2 in Table
3.1). The littoral vegetation includes Cyperus spp, Typha
spp. and Phragmites spp. A communal garden is
situated about 5 meters away from the reservoir. The garden uses manure as a
fertilizer. The littoral soils have a yellowish brown colour and the reservoir
water has a whitish brown colour. The highest soil pH value (7.8) of the
communal reservoirs studied was recorded at Denje. A small business centre is
located upstream of the reservoir at approximately 200 m. This Denje business
centre as well as the population of Denje village gets water from the
reservoir.
Cyperus spp. is the main constituent of the
littoral vegetation at Dewa reservoir with
some areas also covered by
Polygonum spp. From previously green during the
first
sampling (February), the vegetation at the shore and areas surrounding
the reservoir has
decayed. The colour of the waters is gray whitish brown while
the colour of dry soils is grayish brown (Table 3.1). The littoral zone is full
of dung making reference to the considerable number of cattle (10 heads per 10
m2 of littoral area) that is ever grazing in the area. The cattle
observed were composed of cows, donkeys, goats and sheep. A small communal
garden is located in the littoral zone area at approximately 5m from the water
level. Manure is the main, if not the sole, type of fertilizer used in the
area. The reservoir' s water is mainly used for cattle and domestic purposes.
Some points of cloth washing are also located in the same area. Few fishermen
were observed on the reservoir. No bird was observed during the two sampling
visits. No human settlement is present upstream of the reservoir that is mostly
dominated by rocky hills.
2.1.2 Land and water use in the National Park
Most of the reservoirs' shoreline in the National Park is very
well covered by vegetation and the reservoirs are surrounded by granite hills.
The rainfall pattern in the Matopos area during 2004-05 is presented in Table
3.3.
Chitampa is the only reservoir that was not very well covered
by vegetation in addition to its location in a sloppy area. The main vegetation
around this reservoir is composed of Phragmites sp., and
Typha sp. The waters have a very brownish colour; very similar to the
colour of the dry soils that is light brownish gray (Table 3.1). The pH of the
soils is 6.6 and the vegetation score is 2 as shown in Table 3.1. An algal
bloom was observed close to the shore (see Fig. B, annex 1). Two hippopotamus
were also observed in the reservoir.
Maleme reservoir has a littoral zone covered by Cyperus
spp. and short vegetation like Polygonum spp.
that occupies areas where the levels of water have receded. It has a concrete
dam wall in a rocky area (Fig. E, annex 1). The soils of the shoreline have a
pH of 5 and grayish brown colour. The reservoir waters were clear like normal
drinking water.
Mezilume reservoir is very thickly covered by vegetation
dominated by Cyperus spp,
Phragmites sp., Typha
sp., Numphaea sp., Myriophyllum sp.,
Polygonum spp. Some of
the littoral vegetation is shown in the annexes (Fig G to J,
Annex 2). The reservoir is surrounded by four rocky granite hills. The
reservoir water has a coffee colour. The water level had not dropped since the
first sampling trip, as it was the case at Maleme.
Mpopoma reservoir has a large surface area with clear water
and very good and thick vegetation covers its shoreline. Litter is easily
observed in the littoral areas from the falling vegetation. Many granite rocks
are found in and around reservoirs.
2.2 Data collection
2.2.1 Plankton samples
Zooplankton samples were collected with a zooplankton net of
40 cm diameter and 62um mesh size while phytoplankton samples were collected
using similar nets of 20um mesh size. The samples were collected using a
standardized method presented in Edmondson and Winberg (1971). The concentrated
samples were collected in small 130 ml bottles that were labelled. Four samples
were collected on each reservoir at a horizontal line situated at 10 to 20 m
facing the dam wall for zooplankton and four for phytoplankton. A preservation
solution of 4% formalin was added to the sample bottles of zooplankton and
Lugol solution was added to the bottles containing phytoplankton for fixing
purposes. The samples were then taken to the fish laboratory of the Biological
Sciences Department of the University of Zimbabwe. Taxa were then identified
and counted under an inverted microscope OLYMPUS CK40 and species pictures were
taken using a digital camera NIKON model E995 mounted on the inverted
microscope. The identification of taxa was done using a dichotomic
identification keys presented in Durand and Lévêque (1980)
supplemented by Fernando (2002) and Cander-Lund and Lund (1995).
2.2.2 Physical and chemical data
Transparency was measured on all the selected reservoirs using
a secchi disk.
Transparency of waters is linked to light attenuation in
reservoirs, which impacts the
photosynthetic potential of primary producers
and consequently impact the whole biotic
composition of a reservoir (Hart, 1990). The depth of a
reservoir influences its water quality. Of particular importance is the depth
relative to the surface area and wind intensity because these factors effect
the intensity of mixing in the reservoir (Straskraba and Tundisi, 1999). Water
quality is therefore related to reservoir depth, size and basin morphology.
Therefore, the depth and morphological characteristics of the reservoirs were
described. A stadia rod was used to measure the depth. The slope of the dam was
observed and recorded as steep or gentle.
Soil samples of the substrate of the reservoirs were collected
and brought to the Soil Science and Agricultural Engineering laboratory of the
University of Zimbabwe for analysis of pH, electroconductivity, texture and
colour. A Jenway pH meter Model 3510 (ESSEX) was used for pH analysis of soils.
A 1:1 soil solution (which is deionised water) ratio was used. A conductivity
meter (Ecoscan Con5) was used for electroconductivity analysis. The texture of
soils was analysed by the Boyocous hydrometer method. Rainfall data for
Filabusi and Sibasa areas was collected at Filabusi District Administration
meteorology office while the rainfall data for the National Park was collected
from the Meteorology office in Harare. The colour of soil samples was analysed
using the Munsell soil colour charts (Munsell, 1975).
The vegetation cover surrounding reservoirs was observed and
estimated as abundance scores of 1 to 4 (1 means no vegetation coverage; 2:
poor coverage; 3: good coverage and 4: very good coverage). Presence or absence
of farms upstream of reservoirs was noted as well as the proximity of homestead
upstream and downstream the reservoirs. The activities (anthropogenic) taking
place in the vicinity of the reservoirs were also investigated. A digital
camera CAMEDIA C120 was used to take pictures of the activities in the study
area as well as of the main vegetation cover and soils to facilitate their
identification.
2.2.3 Water samples
Water samples were collected using a Ruttner' s bottle at 0.5
m depth from the surface at the four sampling sites located in face of the
dams' wall. These samples were immediately placed into a cooler box and kept at
low temperatures using ice blocks pending their transportation to a deep
freezer in the laboratory. The following water quality parameters were analysed
after the samples had been brought to the laboratory: Nitrogen, Phosphorus, pH,
electric conductivity (EC) and total hardness. The MuphyRiley Method (ascorbic
acid method) was used for total phosphorus analysis using UV visible
spectrophotometer Spectronic 21 Bausch and Lomb. Total nitrogen was analysed
using the titrimetric method using 0.01 M HCl (Hydrogen chloride). The solution
was made alkaline by MgO (Magnesium oxide) and Dervada alloy.
Electroconductivity and pH were analysed using the equipment described in
section 2.2.2.
Electroconductivity and total hardness are considered because
they might be related to soil composition and exchanges between soil and small
reservoir waters. There is abundant literature that stresses the importance of
phosphorus and nitrogen in the shaping of the structure and abundance of
phytoplankton in reservoirs (Crawley, 2000; Talling & Lemoalle, 1998;
Lemoalle et al. 1981; Pinel-Alloul et al. 1995; Schindler,
1978; Drenner, 1989). Nitrogen and phosphorus are considered because they are
major factors that limit primary production of phytoplankton in reservoirs
(Straskraba and Tundisi, 1999). Nutrient-rich animal excrement deposited along
and within reservoirs constitute a major input of nitrogen and phosphorus in
these areas. Hippos are present in Mpopoma and Chitampa reservoirs. The cattle
found around Denje and Dewa reservoirs might have similar effects, though dung
is mainly in the shoreline of reservoirs and might be transported to the waters
indirectly by rains.
The supply of nitrogen is known to be a key factor controlling
the nature and diversity of plant life, the population of both grazing animals
and their predators, and vital ecological processes such as plant productivity
and the cycling of carbon and soil minerals (Vitousek et al.,
1997).
2.3 Data analysis
Clusters were used for the statistical analysis of the data.
The eight reservoirs were grouped in terms of species composition and
abundance. Zooplankton and phytoplankton taxa were also grouped as they
co-occurred or not in the studied reservoirs. Correlations between all means
including the abiotic data were computed. Graphs were drawn and analyses were
done using SigmaPlot, SPSS and Statistica softwares.
A Simpson's index of diversity (a measure of diversity which
takes account of species richness and evenness4, which is 1-D) was
calculated using the following formula for D: D = ~ (n/N) 2 where: n
= the total number of organisms of a particular species; N = the total number
of organisms of all species. The value of this index ranges between 0 and 1.
The greater the value, the greater the sample diversity. Spearman' s rank
correlations were calculated.
4
http://www.countrysideinfo.co.uk/simpsons.htm
III. Results
3.1 Land and water use in the area
The characteristics of the littoral and surrounding areas of
reservoirs are presented in the Table 3.1. These characteristics are mostly
grouped in terms of littoral soil quality (pH, electroconductivity, hardness)
and colour. Electroconductivity of the soils is of an average value of 420
jiS/cm and is evenly distributed in the whole study area. On average
electroconductivity had a value of 394 jiS/cm in the communal lands as compared
to 450 jiS/cm in the National Park. However a high value of 730 jiS/cm was
noticed in Mpopoma. The pH of the soils in the National Park is slightly acidic
5-6.6 with an average of 5.5 while communal lands are comprised of alkaline
soils ranging from 7.5 to 7.8 with an average of 7.6. Vegetation scores ranged
from 2 to 4, and tended to be higher at the reservoirs in the National Park as
compared to communal lands. Water colour is quite different from a reservoir to
another with a predominance of a whitish colour in the communal lands. This
whitish colour was not observed in the National Park. Mpopoma had a quite
distinct brownish colour.
National Park
Table 3.1. Littoral soil samples Color, pH and Electro
conductivity (uS/cm), water colour and littoral vegetation score (estimated)
|
Area
|
Reservoir
|
Wet Color Dry Color Water
colour
|
pH EC Veget
ation Score*
|
|
Maleme
Mezilume
Mpopom a
Chitam pa
|
Light dark 5 315 3
(clear)
Dark 5.2 400 4
grayish
(coffee)
Light dark 5.1 730 4
(clear)
Brownish 6.6 354 2
2.5Y3/2 (Very dark grayish brown)
2.5Y3/2 (Very dark grayish brown)
2.5Y3/2 (Very dark grayish brown)
1 0Yr4/2(Dark grayish brown)
2.5Y5/2 (Grayish brown)
2.5Y5/2 (Grayish brown)
2.5Y6/2 (Light brownish
gray)
1 0Yr6/2 (light brownish Gray)
|
Commun al lands
|
Sibasa Dewa Denje
|
2.5Y4/2 (Dark grayish brown)
1 0Yr3/3 (Dark brown)
1 0Yr3/3 (Dark brown)
|
2.5Y6/4 (light yellowish brown)
10 Yr 5/2 (Grayish brown)
10 Yr6/4 (light yellowish brown)
|
Whitish (milky)
Gray whitish brown Gray whitish brown
|
7.5 558 3
7.5 456 3
7.8 330 2
|
|
Makoshe
|
2.5Yr3/0 (Very dark gray)
|
2.5Yr6/0 (Gray)
|
Dark grayish
|
7.5 230 2
|
*For the estimation of vegetation abundance, 1 means no
vegetation coverage; 2: poor coverage; 3: good coverage and 4: very good
coverage.
The classification of the soils using their texture is
presented in Table 3.2. Maleme and Mezilume have loamy sand while Mpopoma,
Sibasa and Makoshe have loamy sand and sand is predominating around Dewa, Denje
and Chitampa. The soil texture is similar in the communal lands and National
Park with Mpopoma, Sibasa and Makoshe having loamy sandy soils; Chitampa, Dewa
and Denje having sandy soils.
Table 3.2. Texture of soils around the studied small
reservoirs
|
Dam
|
% Sand
|
% Clay % Silt
|
|
Classification
|
|
Maleme
|
40
|
34
|
26
|
Clay loam
|
|
Mezilume
|
40
|
33
|
28
|
Clay loam
|
|
Mpopoma
|
87
|
9
|
4
|
Loamy Sand
|
|
Chitampa
|
96
|
3
|
1
|
Sand
|
|
Sibasa
|
86
|
11
|
3
|
Loamy Sand
|
|
Dewa
|
95
|
2
|
3
|
Sand
|
|
Denje
|
96
|
1
|
3
|
Sand
|
|
Makoshe
|
88
|
11
|
1
|
Loamy Sand
|
3.2 Water quality
The overall pH was slightly alkaline (7.6-8.5), the electrical
conductivity was lower than 200 jiS/cm while the hardness ranged from 23 to 104
mg/l and total nitrogen as well as total phosphorus had values respectively ca.
0.1 mg/l and 0.01 mg/l (Table 3.3). pH readings seem to vary seasonally in
communal lands' reservoirs more than in those located in the National Park.
Conductivity looks also generally higher in the communal lands. The
transparency of water measured by the secchi depth was higher in the National
Park as compared to the communal lands. However, the lowest transparency was
also recorded in Chitampa reservoir in the National Park.
Table 3.3 Water quality of the studied reservoirs (for April 2005
samples)
|
Parameter
|
Communal lands
|
|
|
National Park
|
|
|
|
Sibasa
|
Dewa
|
Denje
|
Makoshe
|
Maleme
|
Mezilume Mpopoma
|
Chitampa
|
|
pH FEB
|
7.6
|
8.1
|
7.7
|
7.7
|
8.5
|
7.9
|
8.0
|
7.6
|
|
APR
|
8.2
|
8.5
|
8.4
|
8.4
|
8.4
|
7.6
|
8.3
|
7.7
|
|
EC (jiS/cm) FEB
|
107
|
200
|
200
|
157
|
147
|
76
|
109
|
93
|
|
APR
|
111
|
250
|
183
|
198
|
138
|
102
|
110
|
109
|
|
Secchi depth (m)
|
0.2
|
0.3
|
0.2
|
0.3
|
0.5
|
1.7
|
2
|
0.1
|
|
Total Hardness
|
|
|
|
|
|
|
|
|
|
(jig/L)
|
42
|
103.8
|
58.4
|
83.5
|
46.8
|
22.5
|
36
|
35.5
|
|
Total Nitrogen
|
|
|
|
|
|
|
|
|
|
(jig/L)
|
94
|
87
|
84
|
99
|
8
|
12
|
11
|
14
|
|
TP (jig/L) FEB
|
7
|
11
|
6
|
6
|
4
|
3
|
3
|
7
|
|
APR
|
8
|
17
|
38
|
5
|
4
|
59
|
2
|
34
|
Abbreviations:
Chemical parameters' abbreviations: Total phosphorus ( TP),
electric conductivity (EC).
3.3 Plankton community composition
3.3.1 Phytoplankton
The flora identified and counted in February and April 2005 is
presented in Table 3.4. The taxon that got the highest abundance was
Hydrodictyon spp., which accounted for an average of 30% of the
overall phytoplankton sampled in April. Hydrodictyon was followed by
Anabaena (19.9%), Peridinium (15.7%), and Melosira
(11.7%), all sampled in April. Hydrodictyon was very rare during the
first sampling (February) period accounting for around 0.1% of the
phytoplankton sampled in April. The phytoplankton sampled in February showed an
abundance of Melosira (18.7%) followed by Ceratium hirundinella
(17.3%) and Pinnularia (11.9%). It can be noticed as well from
Table 3.4 that the taxa collected in April were much more abundant than that of
February with a percentage of 84 in April against 15.8 in April. Though the
highest abundance was observed in April, February showed the highest number of
taxa (highest diversity). Chlorophytes was the major group in both periods with
29 genera in February and 20 in April. Chlorophytes was followed by
bacillariophytes (diatoms) with 17 genera observed in February against 12 in
April. Cyanophytes (5 genera), euglenophytes (4 genera), Fungi (3 genera),
dinophytes (2 genera), xanthophytes (1 genra) and canophytes (2 genera) were
also observed in February. Cyanophytes (4 genera), euglenophytes (2 genera) and
Fungi were observed in addition to chlorophytes and bacillariophytes.
Table 3.4. Composition and density (ind. l-1) of the
phytoplankton in eight reservoirs located on communal lands and National Park
in rural Zimbabwe.
|
Class
|
Taxa
|
|
February
|
|
|
April
|
|
|
Communal lands
|
National Park
|
Abundance
|
Communal lands
|
National Park
|
Abundance
|
|
Chlorophyta
|
Volvox
|
128
|
0
|
128
|
0
|
0
|
0
|
|
Amscottia
|
304
|
616
|
921
|
21
|
0
|
21
|
|
Sphaerocystis
|
166
|
154
|
320
|
176
|
122
|
298
|
|
Dictyosphaerium
|
47
|
0
|
47
|
0
|
0
|
0
|
|
Micractinium
|
54
|
26
|
80
|
0
|
0
|
0
|
|
Scenedesmus
|
14
|
31
|
46
|
98
|
5
|
104
|
|
Staurodesmus
|
13
|
173
|
186
|
5
|
248
|
254
|
|
Ankistrodesmus
|
5
|
0
|
5
|
10
|
78
|
88
|
|
Pediastrum
|
31
|
73
|
105
|
2562
|
28
|
2590
|
|
Sorastrum
|
2
|
0
|
2
|
0
|
0
|
0
|
|
Haematococcus
|
0
|
647
|
647
|
0
|
0
|
0
|
|
cladophora
|
4
|
12
|
16
|
0
|
0
|
0
|
|
Staurastrum
|
10
|
1252
|
1262
|
1371
|
2264
|
3636
|
|
Unidentified2
|
0
|
1161
|
1161
|
0
|
0
|
0
|
|
Unidentified1
|
0
|
864
|
864
|
0
|
0
|
0
|
|
Unidentitfied3
|
0
|
263
|
263
|
0
|
0
|
0
|
|
Cosmarium
|
8
|
441
|
449
|
13
|
186
|
199
|
|
Euastrum
|
21
|
94
|
116
|
0
|
0
|
0
|
|
Sphaerozoma
|
0
|
78
|
78
|
0
|
93
|
93
|
|
Xanthidium
|
0
|
93
|
93
|
0
|
0
|
0
|
|
Actinastrum
|
0
|
462
|
462
|
0
|
0
|
0
|
|
Arthrodesmus
|
0
|
38
|
38
|
0
|
26
|
26
|
|
Hydrodictyon
|
0
|
27
|
27
|
0
|
27221
|
27221
|
|
Closterium
|
4
|
2
|
5
|
132
|
23
|
155
|
|
Selenastrum
|
0
|
13
|
13
|
0
|
0
|
0
|
|
Spondylosium
|
0
|
73
|
73
|
0
|
0
|
0
|
|
Onynchonema
|
0
|
26
|
26
|
0
|
0
|
0
|
|
Pleurotaenium
|
0
|
28
|
28
|
0
|
1082
|
1082
|
|
Micrasterias
|
32
|
96
|
128
|
0
|
52
|
52
|
|
Indet1
|
0
|
0
|
0
|
0
|
233
|
233
|
|
Onynchonema
|
0
|
0
|
0
|
0
|
62
|
62
|
|
Penium
|
0
|
0
|
0
|
0
|
16
|
16
|
|
Zygnema
|
0
|
0
|
0
|
0
|
383
|
383
|
|
Spirogyra
|
0
|
0
|
0
|
0
|
16
|
16
|
|
Cylindrocystis
|
0
|
0
|
0
|
0
|
10
|
10
|
|
Bacillariophyta
|
Navicula
|
142
|
825
|
968
|
574
|
717
|
1291
|
|
Surirella
|
53
|
5
|
58
|
47
|
0
|
47
|
|
Melosira
|
3055
|
2310
|
5365
|
7923
|
2585
|
10508
|
|
Achnantes
|
0
|
61
|
61
|
0
|
127
|
127
|
|
Asterionella
|
0
|
3
|
3
|
0
|
0
|
0
|
|
Cymatopleura
|
0
|
53
|
53
|
0
|
0
|
0
|
|
Rhopalodia
|
0
|
60
|
60
|
0
|
0
|
0
|
|
Oscillatoria
|
35
|
28
|
62
|
0
|
0
|
0
|
|
Gomphosphaerium
|
0
|
28
|
28
|
0
|
0
|
0
|
|
Gomphonema
|
6
|
0
|
6
|
0
|
0
|
0
|
|
Fragilaria
|
4
|
0
|
4
|
0
|
31
|
31
|
|
Rhizosolenia
|
38
|
125
|
162
|
147
|
414
|
562
|
|
Synedra
|
0
|
1430
|
1430
|
78
|
72
|
150
|
|
Pinnularia
|
0
|
3397
|
3397
|
5
|
427
|
432
|
|
Stephanodiscus
|
0
|
2
|
2
|
0
|
0
|
0
|
|
Amphiprora
|
0
|
4
|
4
|
0
|
0
|
0
|
|
Cymbella
|
2
|
0
|
2
|
0
|
194
|
194
|
|
Gyrosigma
|
0
|
0
|
0
|
18
|
0
|
18
|
|
Cyanophyta
|
Coelosphaerium
|
800
|
306
|
1106
|
0
|
0
|
0
|
|
Microcystis
|
153
|
101
|
254
|
0
|
0
|
0
|
|
Microchaete
|
4
|
0
|
4
|
0
|
0
|
0
|
|
Merismopedia
|
4
|
0
|
4
|
0
|
0
|
0
|
|
Anabaena
|
48
|
33
|
80
|
17916
|
0
|
17916
|
|
Canophyta
|
Nostoc
|
93
|
0
|
93
|
0
|
0
|
0
|
|
Euglenophyta
|
Trachelomonas
|
0
|
21
|
21
|
0
|
0
|
0
|
|
Phacus
|
116
|
427
|
543
|
536
|
585
|
1120
|
|
Euglena
|
115
|
7
|
122
|
163
|
18
|
181
|
|
Astasia
|
150
|
0
|
150
|
0
|
0
|
0
|
|
Fungi
|
Rhizosiphon
|
0
|
2
|
2
|
0
|
0
|
0
|
|
Chytridium
|
24
|
96
|
120
|
0
|
0
|
0
|
|
Sporangium
|
441
|
308
|
749
|
16
|
0
|
16
|
|
Dinophyta
|
Ceratium
|
4945
|
0
|
4945
|
6151
|
18
|
6169
|
|
Peridinium
|
1202
|
2
|
1204
|
14084
|
5
|
14089
|
|
Xanthophyta
|
Ophiocytium
|
3
|
0
|
3
|
0
|
0
|
0
|
|
Cryptophyta
|
Cryptomonas
|
0
|
11
|
11
|
0
|
0
|
0
|
|
Chrysophyta
|
Dinobryon
|
0
|
0
|
0
|
0
|
471
|
471
|
|
Total
|
12276
|
16386
|
28662
|
52046
|
37812
|
89859
|
There was no significant difference in phytoplankton species
composition in February and April (Spearman's rank correlation coefficient
rs = 0.203, N=71). The Student's t-test did not show any significant
difference between February and April' s phytoplankton species (t = -1.71; P=
0.087; N = 71).
Reservoirs in the National Park were more diversified in taxa
compared to those in the communal lands, with 49 taxa against 38 sampled in
February and 32 against 22 taxa identified in the samples of April (Table 3.5).
This difference of diversity in the National Park compared to the communal
lands is confirmed by the significant difference obtained using the paired
samples Student' s t-test (t = 21.0; df = 1; P = 0.03).
Table 3.5 shows, as well, that phytoplankton communities were
more diverse in February on both communal lands and within the National Park. A
significant difference in species diversity was found between the two study
periods, using the Student' s t-test (t = 33.0; df=1; P = 0.019).
Table 3.5. Phytoplankton diversity: number of taxa recorded in
the study area
|
Communal lands reservoirs
|
Commun al lands
|
National Park reservoirs
|
|
National Park
|
|
Makos Dew Sibasa he a Denje
|
Male me
|
Mezilu me
|
Mpopo
ma Chitampa
|
|
February April
|
15
19
|
24
14
|
12
14
|
21
12
|
38
22
|
16
13
|
25
18
|
36
29
|
18
14
|
49
32
|
|
Mean
|
|
|
|
|
30.0
|
|
|
|
|
40.5
|
A significant correlation was found between the phytoplankton
diversity recorded in communal lands and in the National Park, and between
February and April, with Spearman's rank correlation coefficient (rs
=1.000**, n=2, with significance at 0.01 level (2-tailed)).
The Simpson's index of diversity is presented in Table 3.6.
The highest as well as the lowest indices were recorded in the National Park
respectively in February and in April. The diversity in communal lands was
consistently high.
Table 3.6. Simpson's diversity index calculated on February and
April samples
|
February
|
April
|
|
Communal lands
|
National Park
|
Communal lands
|
National Park
|
|
0.76
|
0.91
|
0.77
|
0.5
|
Though the chlorophytes division was more diverse in February,
it only constituted 7 % of taxa abundance in communal lands (Table 3.6).
However it constituted 41% in the National Park.
Table 3.7, Table 3.8, Fig. 3.1 and Fig 3.2 highlight the
difference in the phytoplankton composition and abundance in communal lands and
in the National Park and for February and April samples. Phytoplankton
abundance was dominated in February by dinophytes (50 %) followed by
bacillariophytes or Diatoms (27%) in communal lands. In the National Park
bacillariophytes were more abundant (5 1%) (Table 3.7, Fig.3.1). Sibasa
reservoir dominated the February abundance of taxa in communal lands with 54%
followed by Denje reservoir (3 1.5%) while Mpopoma dominated in the National
Park with 53% followed by Mezilume and Maleme with respectively 24% and 17% of
the total abundance (Table 3.7).
Table 3.7. Abundance of major groups for February samples (no.
l-1)
|
Class
|
|
Reservoirs
|
|
Communal
Lands
total %
|
|
Reservoirs
|
|
National
Park
total %
|
|
Denj Sibasa e
|
Dewa
|
Makos he
|
Male me
|
Mezilu Chita me mpa
|
Mpop o
ma
|
|
Chlorophyta
|
82
|
548
|
25
|
189
|
845 6.9
|
179
|
3224
|
495
|
2847
|
6744 41.2
|
|
Bacillariophyta
|
34
|
2810
|
180
|
311
|
3334 27.2
|
2179
|
548
|
48
|
5553
|
8329 50.8
|
|
Cyanophyta
|
10
|
152
|
689
|
157
|
1008 8.2
|
0
|
111
|
195
|
134
|
440 2.7
|
|
Canophyta
|
0
|
53
|
0
|
40
|
93 0.8
|
0
|
0
|
0
|
0
|
0 0.0
|
|
Euglenophyta
|
342
|
20
|
3
|
15
|
381 3.1
|
330
|
58
|
45
|
22
|
454 2.8
|
|
Fungi
|
74
|
221
|
132
|
37
|
465 3.8
|
162
|
20
|
91
|
133
|
406 2.5
|
|
Dinophyta
|
6079
|
63
|
0
|
5
|
6147 50.1
|
2
|
0
|
0
|
0
|
2 0.0
|
|
Xanthophyta
|
3
|
0
|
0
|
0
|
3 0.0
|
0
|
0
|
0
|
0
|
0 0.0
|
|
Cryptophyta
|
0
|
0
|
0
|
0
|
0 0.0
|
0
|
0
|
0
|
11
|
11 0.1
|
|
Total
|
6624
|
3868
|
1030
|
754
|
12277 100.0
|
2852
|
3961
|
874
|
8700
|
16386 100
|
|
%
|
54.0
|
31.5
|
8.4
|
6.1
|
100
|
17.4
|
24.2
|
5.3
|
53.1
|
100
|
April samples were dominated by dinophytes (38.9%) and
cyanophytes (34.4%) in the communal lands and by chlorophytes (85%) in the
National Park (Table 3.8). Dinophytes and cyanophytes were rare in the National
Park. The second more abundant group in the National Park was bacillariophytes
(Diatoms) with 12 % of the total abundance. As for February, Sibasa reservoir
recorded the second highest abundance of taxa 41% of total abundance in the
communal lands after Makoshe reservoir (43 %). Mezilume (83.61%) dominated the
overall abundance in the National Park followed by Mpopoma (13.2%). It is
important to note that In February Mpopoma dominated over Mezilume.
A positive Spearman's rank correlation coefficient was found
between the phytoplankton major groups in communal lands and the National Park
(rs=0.477; P=0.0194; N=9. The paired t-test gave a non-significant
difference (t=-0.39; P=0.70; df=8).
The major groups in February obtained a Simpson's index of
diversity of 0.77 in the communal lands and 0.57 in the National Park. The
Simpson's diversity index for April samples showed high diversity in the
communal lands (0.3 1) while the National Park obtained low diversity
(0.74).
Table 3.8. Abundance of major groups for April samples (ind.
l-1)
|
|
Reservoirs
|
Comm
|
|
Reservoirs
|
|
|
|
Makos Dew
|
unal Denj lands
|
|
Nation
Malem Mezilu Mpopo Chitaal Park
|
|
Group
|
|
Sibasa he a
|
e total
|
%
|
e me ma mpa total
|
%
|
|
Chlorophyta
|
|
197 518 2665
|
1009 4389
|
8.4
|
78
|
29260
|
2701 109 32148
|
85.0
|
|
Bacillariophyta
|
|
321 5346 1252
|
1873 8793
|
16.9
|
277
|
1770
|
2282 238 4567
|
12.1
|
|
Chrysophyta
|
|
0 0 0
|
0 0
|
0.0
|
0
|
471
|
0 0 471
|
1.2
|
|
Cyanophyta
|
|
1211 16680 0
|
26 17916
|
34.4
|
0
|
0
|
0 0 0
|
0.0
|
|
Dinophytes
|
|
19433 21 5
|
777 20236
|
38.9
|
8
|
15
|
0 0 23
|
0.1
|
|
Euglenophyta
|
|
202 26 398
|
72 698
|
1.3
|
381
|
98
|
21 104 604
|
1.6
|
|
Fungi
|
|
16 0 0
|
0 16
|
0.0
|
0
|
0
|
0 0 0
|
0.0
|
|
Total (ind. l-1)
|
|
21379 22590 4321
|
3757 52047
|
100.0
|
743
|
31614
|
5005 451 37813
|
100.0
|
|
%
|
41.08 43.40 8.30
|
7.22 100.00
|
|
1.97
|
83.61
|
13.24 1.19 100
|
|
The Spearman' s rank correlation between communal lands and
National Park was not significant at 5 % level (P=0.05) with
rs=0.072 and N=7. No significant difference in the phytoplankton
major groups was found between communal lands and the National Park in April
samples using t-test: t=0.34; P=0.74; df=6.
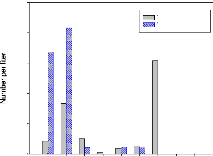
10000
Tot Communal lands Tot National Park
8000
6000
4000
2000
0
ChloroBacillarioCyano Cano Eugleno Fungi Dino Xantho Crypto
Fig. 3.1. Abundance of phytoplankton major groups/February 05
Chloro Bacilario Chryso Cyano Dino Eugleno Fungi
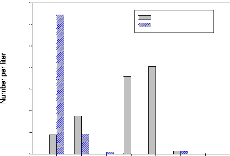
35000
30000
25000
20000
15000
10000
5000
0
Tot Communal Lands
Tot National Park
Fig.3.2 Abundance of phytoplankton major groups/ April 2005
There was a significant difference in abundance between
February and April phytoplankton samples in the communal lands using the t-test
(t=-2.06; P=0.05; df=14) but no significant difference was found in the
National Park (t=-0.86; P=0.39; df=14). However, there was high significant
difference in phytoplankton abundance between the communal lands and the
National park using a chi-square test (P<0.01).
3.1.2 Zooplankton
The zooplankton community investigated was represented by the
freshwater common groups, the crustacean cladocerans and copepods (Cyclops and
Calanoids) and rotifers. A few individuals belonging to the Ostracods group
were also recorded. The zooplankton community was dominated in February by
copepods (Table 3.9); Cyclopes having 28.6 % followed by their youngsters
(Nauplii) with 15.2%, the rotifer Keratella (14.2%) and copepod
Calanoids nauplii (13%). Communal lands had the highest zooplankton abundance
in both February and April samples with respectively 63% and 57%. The Cyclopes
were again dominant in April with 27 % of the total abundance followed their
nauplii, a cladoceran species, the rotifers Keratella and
Brachionus all getting ca. 10%.
Table 3.9. Abundance of zooplankton (no.l-1) for the
samples of February and April
|
Taxa (February)
|
Communal lands National Park
|
Abundance
|
%
|
|
Daphnia
|
109
|
18
|
127
|
6.3
|
|
Moina
|
68
|
67
|
134
|
6.6
|
|
Ceriodaphnia
|
14
|
0
|
14
|
0.7
|
|
Simocephalus
|
2
|
0
|
2
|
0.1
|
|
Bosmina
|
11
|
2
|
13
|
0.6
|
|
Chydorus
|
3
|
24
|
27
|
1.3
|
|
Cyclops
|
447
|
133
|
580
|
28.6
|
|
calanoida
|
59
|
5
|
64
|
3.1
|
|
nauplius calanoida
|
157
|
105
|
262
|
12.9
|
|
nauplius cyclopoida
|
123
|
185
|
309
|
15.2
|
|
Brachionus
|
32
|
44
|
76
|
3.7
|
|
Keratella
|
235
|
50
|
286
|
14.1
|
|
A (long avec queue)
|
26
|
84
|
110
|
5.4
|
|
X (Rotifera)
|
0
|
26
|
26
|
1.3
|
|
Leptodora
|
0
|
2
|
2
|
0.1
|
|
Total
|
1286
|
745
|
2031
|
|
|
%
|
63.3
|
36.7
|
|
|
|
Taxa (April)
|
|
|
Daphnia
|
34
|
2
|
36
|
5.3
|
|
Moina
|
32
|
2
|
34
|
5.0
|
|
Cladocera indet
|
36
|
43
|
80
|
11.8
|
|
Brachionus
|
36
|
25
|
61
|
8.9
|
|
Microdides
|
22
|
28
|
50
|
7.3
|
|
Keratella
|
48
|
20
|
68
|
10.0
|
|
Rotifera indet
|
3
|
5
|
8
|
1.1
|
|
Cyclops
|
119
|
63
|
182
|
26.8
|
|
calanoida
|
9
|
8
|
18
|
2.6
|
|
nauplius calanoida
|
22
|
34
|
56
|
8.2
|
|
nauplius cyclops
|
24
|
56
|
80
|
11.8
|
|
Macrothrix
|
1
|
0
|
1
|
0.2
|
|
Ceriodaphnia
|
1
|
0
|
1
|
0.2
|
|
Ostracoda indet
|
0
|
3
|
3
|
0.5
|
|
Lepadella
|
0
|
2
|
2
|
0.3
|
|
Total
|
386
|
292
|
678
|
|
|
%
|
56.9
|
43.1
|
|
|
There was no significant difference in species composition for
the student's t-test between communal lands and National Park in February
(t=1.41; P=0.17; df=14) and in April samples (t = 1.13; P = 0.27; df = 14).
Seasonal differences in zooplankton distribution and abundance
were seen in both the
communal lands and National Park (Figure 3.3, Figure
3.4, Table 3.10 and Table 3.11).
Copepods (composed of Cyclopoids and
Calanoids) dominated the samples, comprising
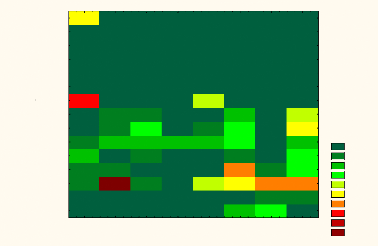
Cladocera indet.
Nauplius Cycl
Rotifera indet.
Ceriodaphnia
Nauplius cal
Brachionus
Microdides
Macrothrix
Ostracoda
Lepadella
Keratella
Calanoid
Cyclops
Daphina
Moina
SIBASA MEZILUME MPOPOMA DENJE
MAKOSHE CHITAMPA DEWA
MALEME
4.799 9.598 14.396 19.195 23.994 28.793 33.591 38.39 43.189
47.988
60% of total zooplankton abundance in February and 49 % in
April. Ostracods were not found in February samples. Few Ostracods were
recorded in April in Chitampa reservoir and Maleme reservoir, both located in
the Matopos National Park (Table 3.9).
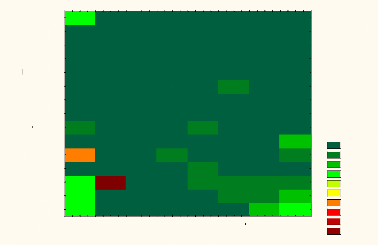
Rotifera(indet2)
Rotifera(indet1)
Simocephalus
Nauplius cycl
Ceriodaphnia
Nauplius cal
Brachionus
Leptodora
Chydorus
Keratella
Bosmina
Calanoid
Cyclops
Daphnia
Moina
SIBASA
DENJE
MALEME
MAKOSHE
MEZILUME
DEWA
CHITAMPA
MPOPOMA
26.701 53.402 80.103 106.804 133.505 160.206 186.906 213.607
240.308 267.009
Fig. 3.3. Zooplankton species distribution and abundance (numbers
of zooplankton per litre in the right) among the 8 reservoirs/ February
Fig. 3.4. Zooplankton species distribution and abundance (numbers
of zooplankton per litre in right) among the reservoirs/ April
Table 3.10. Abundance of major zooplankton groups/February
|
Taxa
|
Communal lands Reservoirs
|
National Park Reservoirs
|
Total
|
%
|
|
Siba
sa Dewa Denje Makoshe
|
Mpopo Chitamp Mezilum
ma a e Maleme
|
|
Cladocera
|
118
|
24
|
42
|
21
|
24
|
44
|
9
|
36
|
318
|
15.7
|
|
Cyclopoda
|
173
|
300
|
75
|
23
|
8
|
49
|
114
|
147
|
889
|
43.8
|
|
Calanoida
|
96
|
17
|
69
|
34
|
2
|
7
|
35
|
65
|
326
|
16.0
|
|
Rotifera
|
227
|
1
|
11
|
54
|
2
|
39
|
13
|
150
|
498
|
24.5
|
|
Total
|
613
|
342
|
197
|
133
|
36
|
139
|
171
|
398
|
2031
|
|
|
%
|
30.2
|
16.9
|
9.7
|
6.5
|
1.8
|
6.9
|
8.4
|
19.6
|
|
|
Table 3.11. Abundance of major zooplankton groups /April
|
Taxa
|
Communal lands Reservoirs
|
National Park Reservoirs
|
Total
|
%
|
|
Sibas
a Dewa Denje Makoshe
|
Mpopo
ma
|
Chita
mpa Mezilume
|
Maleme
|
|
Cladocera
|
34
|
21
|
32
|
18
|
12
|
11
|
11
|
12
|
152
|
22.4
|
|
Cyclopoda
|
10
|
33
|
39
|
60
|
60
|
25
|
6
|
28
|
262
|
38.6
|
|
Calanoida
|
0
|
7
|
14
|
9
|
30
|
10
|
1
|
1
|
73
|
10.8
|
|
Rotifera
|
54
|
10
|
36
|
7
|
37
|
10
|
6
|
26
|
188
|
27.7
|
|
Ostracoda
|
0
|
0
|
0
|
0
|
0
|
2
|
0
|
1
|
3
|
0.5
|
|
Total
|
98
|
71
|
122
|
94 140
|
59
|
25
|
68 678
|
|
|
%
|
14.5
|
10.5
|
18.0
|
13.9 20.6
|
8.7
|
3.7
|
10.1
|
|
Sibasa reservoir recorded the highest abundance of zooplankton
in February (30%) followed by Maleme (20%) and Dewa (17%) while the highest
abundance in April was found in Mpopoma reservoir (21%) followed by Denje,
Sibasa and Makoshe. Fig. 3.5 and Fig. 3.6 highlight the differences in
abundance between February and April and among reservoirs. It is worth note
that Mpopoma had the lowest abundance of taxa in February (2%) and Mezilume had
the lowest abundance in April (4%). Fig. 3.5 also highlights the predominance
of Cyclopoids in February samples (in Dewa reservoir) followed by Rotifers.
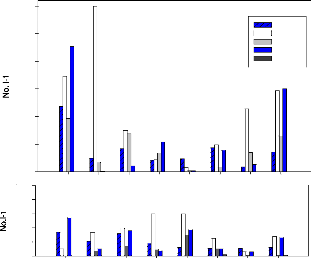
April
100
80
300
250
200
150
100
50
0
February
C lad o Cyclo Calan Rotif Ostrac
Sib Dewa Denje Makosh Mpopo Chita Mezil Malem
60
40
20
0
Sib Dewa Denje Makosh Mpopo Chita Mezil Malem
Fig. 3.5 Zooplankton major groups abundance
Taxa abbreviations are: Cladocera (clado), Cyclopoids (Cyclo),
Calanoida (calan), Rotifer (rotif), Ostracoda (ostrac).
Reservoir abbreviations are: Sibasa (Sib), Makoshe (Makosh),
Mpopoma (Mpop), Chitampa (Chita), Mezilume (Mezil), Maleme (Malem)
800 Febru ary
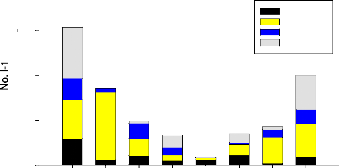
400
200
600
0
Cladocera Cyclopoda Calanoida Rotifera
Sibasa Dewa Denje MakosheMpopomaChitampaMezilumeMaleme

200 April

150

100
50
0
Sibasa Dewa Denje MakosheMpopomaChitampaMezilumeMaleme
Fig. 3.6 Abundance of zooplankton major groups in the study
area
3.1.3 Overall plankton abundance
The study sites exhibited seasonal variation in the abundance
of phytoplankton and zooplankton (Fig 3.7 and Fig. 3.8). The highest abundance
of zooplankton was recorded in February while the highest abundance of
phytoplankton was recorded in April.
A clustering of stations according to plankton abundance using
complete linkage is presented in Fig 3.9 and Fig.3.10. These figures show
Sibasa and Mpopoma reservoirs' abundance being very dissimilar to all other
reservoirs in February while Sibasa, Makoshe and Mezilume are very dissimilar
to others in April. No similarity is found between reservoirs according to
their presence or not in the National Park or in the communal lands. A first
level similarity is found in February between Chitampa (National Park), Makoshe
and Dewa (Communal Lands) similarity in abundance of stations according to
their occurrence in the National Park or in the communal lands is depicted.
However, these Figures show how close the studied reservoirs were in terms of
abundance. Different linkages between the two sampling periods can be found as
well when comparing these clusters.
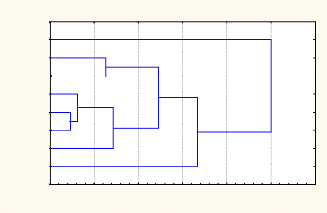
CHITAMPA
MEZILUME
MPOPOMA
MAKOSHE
MALEME
SIBASA
DENJE
DEWA
0 20 40 60 80 100 120
(Dlink/Dmax)*1 00
February
Fig. 3.9 Clustering of stations according to the overall plankton
abundance/ February
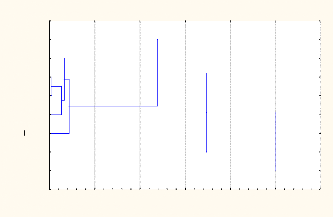
MPOPOMA
CHITAMPA
MAKOSHE
MEZILUME
MALEME
SIBASA
DENJE
DEWA
0 20 40 60 80 100 120
(Dlink/Dmax)*1 00
April
Fig. 3.10 Clustering of stations according to the overall
plankton abundance/ April
3.1.4 Relationships between physico-chemical parameters and
plankton species in the studied reservoirs
A comparison of the National Park and communal lands for a
number of parameters and species relationships showed significant differences
(annexes 5 and 6). The following elements showed a significant difference
taking Mezilume (National Park) and Makoshe (Communal lands) as an example: pH
of water (P<0.01), electroconductivity of water (P<0.001), total nitrogen
(P <0.05), the cladoceran Moina (P <0.05), the cyanophyte
Anabaena (P <0.05), and the dinophyte Ceratium (P
<0.05).
The colour of water may have had an influence on the following
elements using ANOVA: pH of water (P<0.01), electroconductivity of water
(P<0.001), total nitrogen (P<0.0 1), hardness of water (P<0.0 1),
soil' s electroconductivity (P<0.0 1), the species Daphnia
(P<0.001), Brachionus (P<0.01), Microdides (P
<0.05), nauplii cyclopoids (P <0.05), nauplii calanoids (P <0.05),
Anabaena (P<0.01), Peridinium (P<0.001),
Melosira (P <0.05), Scenedesmus (P <0.05),
Pediastrum (P<0.01), Hydrodictyon (P<0.01), Dinobryon
(P <0.05), Pleurotaenium (P<0.01), Arthrodesmus (P
<0.05), Fragilaria (P <0.05) and Zygnema (P <0.05).
The soil type also showed a significant influence on some phytoplankton
species.
The clustering of all the components of the main biota in
relation to the water quality is presented on Fig. 3.11 and 3.12. These figures
highlight the relationships of species found in the study area with its
chemistry. Total phosphorus, total nitrogen in the small reservoirs and
electroconductivity of soils had a relationship with zooplankton (Daphnia,
Rotifera, Brachionus and Ostracoda) and phytoplankton taxa
(Navicula, Phacus, Lepadella,
Sphaerocystis, Staurodesmus, Cosmarium and
Sporangium). The pH of water and soils, water hardness and
electroconductivity also influenced some species (Fig. 3.11 and 3.12).
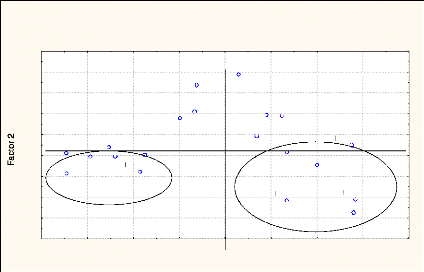
-0.2
-0.4
-0.6
-0.8
0.8
0.6
0.4
0.2
0.0
1.0
-0.6 -0.4 -0.2 0.0 0.2 0.4 0.6 0.8 1.0
TNWATER
ECSOIL ROTIFERA
BRACHION TPWATER
OSTRACOD
TN and TP
DAPHNIA
Factor Loadings, Factor 1 vs. Factor 2
Rotation:
Unrotated
Extraction: Principal axis factoring
CLADOCER
MICRODID
NAUPLCYC
Factor 1
NAUPLCA
CALANOID
KERATLL
CERIODAP MACROTHR
CYCLOPS
PHSOIL
MOINA
HARDNWAT
PHWATER
PH and EC
ECWAT
Fig. 3.11 Relationship between chemistry and zooplankton in the
studied reservoirs
Taxa abbreviations: Nauplii cyclopoids (NAUPLCYC), Nauplii
calanoids (NAUPLCA), Microdides (MICRODID), Cladocera (CLADOCER),
Abiotic elements abbreviations: Total Nitrogen (TNWATER), Total
Phosphorus in water (TPWATER), electroconductivity in soils (ECSOIL), water
hardness (HARDWAT), water' s electroconductivity (ECWAT)
Factor Loadings, Factor 1 vs. Factor 2
Rotation:
Unrotated
Extraction: Principal axis factoring
|
0.6 0.4 0.2 0.0 -0.2 -0.4 -0.6 -0.8 -1.0 -1.2
|
|
|
STAURODE
|
|
|
NAVICULA COSMARIU
|
|
MELOSIRA
|
|
PHACUS TPWATER
|
RHIZOSOL
|
|
ECWAT
|
|
LEPADELL TNWATER
|
|
|
ANABAENA
|
|
|
|
|
HARDNWAT
|
GYROSIGM
|
|
ECSOIL
|
|
PHWATER
|
|
|
|
|
|
SPHAEROC
|
|
|
PH, hardness and EC
|
|
SPORANGI
TN and TP
|
|
|
PHSOIL
|
|
|
|
|
|
CLOSTERI
|
|
|
|
SYNEDRA
|
|
|
|
PERIDINI EUGLENA
|
|
|
|
CERATIUM
|
|
-1.2 -0.8 -0.4 0.0 0.4 0.8
Factor 1
Fig. 3.12 Relationship between chemistry and phytoplankton in the
studied reservoirs.
Taxa abbreviations: Gyrosigma (GYROSIGM),
Lepadella (LEPADELL), Staurodesmus (STAURODE),
Cosmarium (COSMARIO), Rhizosolenia (RHIZOSOL),
Sphaerocystis (SPHAEROC), Sporangium (SPORANGI),
Closterium (CLOSTERI).
Abiotic elements abbreviations: Total Nitrogen (TNWATER), Total
Phosphorus in water (TPWATER), electroconductivity in soils (ECSOIL), water
hardness (HARDWAT), water' s electroconductivity (ECWAT)
IV. Discussion
4.1 Water quality aspects, land and water use
The water quality parameters that were analysed in the studied
reservoirs indicate a general trend that is acceptable in comparison with the
WHO guidelines for drinking water (Chapman, 1992), natural levels in freshwater
(Sinkala et al. 2002) and the Zimbabwean effluent standards (ZINWA,
undated) (Table 3.3). In the whole study area, pH was more or less alkaline,
ranging from 7.6 to 8.5- values that are in agreement with the pH of most
natural waters that ranges between 6.0 and 8.5 (Chapman, 1992). Total nitrogen,
total phosphorus, total hardness and electroconductivity were not significantly
different in the National Park as compared to communal lands.
The similarity in the water quality parameters analysed in the
National Park and in the communal lands suggests that ecosystem health, as
defined by water quality, is currently not under serious threat due the land
and water use in the surrounding communal lands. This result was not expected,
based on findings in other areas and the documented impact humans can have on
water quality (Brainwood et al. 2004; Vitousek et al. 1997; Siwela et al. 1996,
Sharma, 2003). However, in the communal areas of this study, the high quality
of water of the reservoirs may be explained by the fact that few or no
significant land and water uses are taking place upstream, of the reservoirs;
all of the farms in the study area were located downstream of the reservoirs
and the human settlement appeared to be located far enough away from the
reservoirs to not constitute a threat. The homesteads that were found close to
reservoir might have not had significant influence, probably due to their
low-density status.
It is widely accepted nowadays that excess fertilization and
manure production create phosphorus surplus that accumulates in soils. Some of
this surplus is transported in soil runoff to aquatic ecosystems (Carpenter
et al., 1998) with respect to rainfall levels. Rainfall levels
contribute to water quality in the sense that little or no runoff result in
little rainfall. This enrichment of water bodies can only happen when farms and
activities
are located upstream of reservoirs. Though the study area
under investigation in this study currently lacks upstream influences, it would
be expected that increased human settlement or any development upstream of the
reservoirs could potentially result in a decrease in water quality in
reservoirs near communal lands.
The study may also document the role vegetative cover can play
in mitigating the impacts of local soil conditions, caused by natural or
anthropogenic phenomena, on water quality in the reservoir. Conductivity
measurements in the soils in both National Park and communal lands were three
to four times higher than measurements in the water (Table 3.1).
The pH was far more acidic in the National Park soils (pH=
5.3) as compared to the waters in the same area that is slightly alkaline
(pH=8). The same trend is found in the communal lands where the soils have a pH
around 7.5 and waters a pH=8.2. This contrast in values suggests that the
surrounding soils have little influence on the water quality of the reservoir
waters that might be attributed to the presence of good vegetation cover around
reservoirs, which constitute a buffer to large transfers of elements. The
presence of riparian vegetation is crucial in retaining some nutrients. This is
confirmed by Carpenter et al.(1998) who state that the maintenance of
vegetated riparian zones or buffer strips may reduce the transport of
phosphorus and nitrogen to reservoirs. It might be suspected that the
degradation of vegetation cover due to human activities on the communal lands
could increase the transport of nutrients to the reservoirs, and alter water
quality in the future.
While it appears that water quality was not directly impacted
by the surrounding soils (values of surrounding soil quality being different
from those of the water quality), it is interesting to note that water colour
may have been influenced by local conditions. Though water quality was found to
be acceptable in the communal lands, a whitish colour of water was present in
almost all of the reservoirs. This colour is very close to a white granite rock
located 250m upstream of Sibasa reservoir and might be the origin of the
colour. Such a strong whitish colour might have an effect on light penetration
in the reservoir and compromise the primary productivity within the water
column. Thus, it may be impacting biota within the reservoirs. This has been
shown by the possible influence
discovered on the quality parameters (pH, electroconductivity,
total nitrogen and hardness) as well as some plankton species (Annex 5).
Sibasa, having the strong whitish colour, might have got a very high
abundance.
4.2 Plankton community composition, diversity and
abundance in relation to land and water use
4.2.1 Seasonal variation in plankton diversity and
abundance
This study found that the diversity and abundance of plankton
species varied seasonally. While this study failed to conclusively support this
variation with statistical significance, it is believed that rainfall patterns
were responsible for the noted seasonal variation. The two sampling periods
fell within the span of the normal rainy season that extends from November to
April. More conclusive evidence for seasonal variation in plankton diversity
and abundance may be reached if future sampling sessions took place both within
the normal rainy and dry seasons.
The slight differences in plankton species distribution
amongst the communal land sites (Fig 3.3) are probably due to documented
rainfall patterns. February sampling was conducted just after the short rains
of January and therefore could probably show a sign of seasonality in April
since March and April did not have rains. Differences in species composition
observed in the figures from communal lands and National Parks might also be
explained by the fact that the Matopos National Park received more rains from
November to January as compared to the communal lands that received rains only
in January. Thus, the abundance and diversity found in the National Park varied
more from February to April. It would be expected even greater seasonal
differences in plankton community structure should the samples be taken in the
period of November to April for the rainy season and the dry season that spans
from May to October.
The results of this study suggest that rainfall variability can
significantly impact the
diversity and abundance of plankton communities.
This is an important concept, as
rainfall patterns in this area have been
erratic in the past 10-15 years, and have the
potential to continue following non-normal trends due to
climate variability or climate change in the future. Rainfall patterns are
considered here in the sense that their intensity might induce the transport of
sediments from upstream of reservoirs to the reservoirs. These sediments, if
transported are likely to affect the reservoirs water quality, their biotic
composition and ecosystems health. This affirmation is supported by the
findings of a relation between the water quality parameters and the species
composition. These findings are presented in terms of factor analysis in Fig.
3.11 and Fig. 3.12.
Naz and Turkmen (2005) and Reynolds (1984) acknowledge the
fact that seasonal variations in plankton species composition and abundance are
believed to depend on interactions between physical and chemical factors that
are in turn influenced by climatic factors. The informal climatic sub-seasons
noticed during the sampling period were, therefore, likely to alter, though not
necessarily with significance, the plankton community structure.
Apart from this seasonal variation due probably to rainfall
patterns, no difference was noted between the communal lands and the National
Park related to land and water use. The reason, therefore, for a tendency to
acknowledge the good status of the health of the environment in the communal
lands. This shows similarities between reservoirs in communal lands to the
pristine-considered reservoirs in the National Park. However, care should be
taken to applaud this finding since a more detailed investigation including all
the seasons need to be done in order to be sure of the behaviour of these
ecosystems. As Cander-Lund and Lund (1995) confirm that like humans need a
regular check-up at the hospital, the health of aquatic ecosystems need to be
monitored through the observation of their plankton composition- a regular
monitoring might also be interesting to get on track with the evolution of the
status of these ecosystems.
4.2.2 Plankton composition
There significant difference found in phytoplankton abundance
samples using the chi- square method might be due to natural differences
between the National Park and the communal lands. The most abundant
phytoplankton taxon found during this investigation was Hydrodictyon
spp. in April samples. Its abundance might be due to the fact
that the species is known to break into pieces (Cander-Lund and Lund, 1995) and
the counting of those small pieces might mislead to an acknowledgement of
abundance. It was found, however, in April samples that the taxa was widely
distributed. Hydrodictyon was rarely observed in February samples.
Anabaena sp., a blue-green algae (Cyanophyta), was the second
most abundant species observed in April though it was rare in the February
samples. Though Anabaena sp. is always associated with algal
blooms, its abundance was not high enough to create an algal bloom. Literature
shows, in fact, that Anabaena sp. can be found in non-polluted waters
(Cander-Lund and Lund, 1995). However, the presence of this species, and others
that prefer similar ecological conditions, in areas where they are not expected
to normally occur might be a sign of the enrichment of waters, a term referred
to as eutrophication. The current aquatic community structure would likely
change with the onset of eutrophication, perhaps altering water quality and
rendering the reservoirs unsuitable habitat for a variety of plankton species
and unsuitable for human uses as they currently stand. One particular risk of
the cyanophytes group is the fact that most of the species (including
Anabaena sp.) contain toxic substances that can lead to fish
kills wherever their blooms occurs, especially in hyper-eutrophic ecosystems.
They have Nitrogen-fixing sites (heterocysts) on their organisms and are
therefore able to fix nitrogen; which means that they can proliferate rapidly.
Anabaena is, particularly, known to produce neurotoxins that affect
the human central nervous system and hepatotoxins that affect human liver
(Chipfunde, person.comm.).
Ceratium (fig. M, annex 3), a dinophytes that is
likewise known to produce toxic substances and red water blooms, was found in
both samples of February and April. This taxon belongs to the major group of
dinophytes and is common in the plankton of lakes. Some species are rich in
plants nutrients such as phosphates and nitrates (Cander-Lund
and Lund, 1995). Cander-Lund and Lund (1995) states that even
in such lakes it is often accompanied by cyanophytes. The results obtained in
this work have shown the presence of Ceratium as well as cyanophytes,
though the water bodies were nutrient-poor (oligotrophic). Ceratium
and Peridinium (another dinophytes) increased in abundance in April
samples due probably to favourable conditions to their proliferations such as
an increase in total nitrogen levels. This cannot be confirmed since total
nitrogen was not analysed for February samples. An increase in nutrient levels
in the study area would enhance a high productivity level of dinophytes and
cyanophytes, leading to algal blooms, which would compromise health of the
ecosystems as they currently stand. It is therefore crucial to keep the water
bodies under observation.
The species that could cause algal blooms like
Anabaena were mostly present in the communal lands (Table 3.4).
Ceratium and Peridinium have also been found in high
abundance in the communal lands as compared to the National Park. These taxa
are known to be proliferating in nutrient rich waters (Cander-Lund and Lund,
1995); Ceratium being able to exploit organic and inorganic nutrients
and gain competitive advantage over purely photosynthetic species (Smalley and
Coat, 2002). Because these nutrient enrichment indicative species are abundant
in the communal lands, an argument would be made that communal land sites
should be monitored for an influx of nutrients that could spur them into an
algal bloom.
The zooplankton community was less diverse and less abundant
as compared to ponds and reservoirs (from other studies) though the most common
zooplankton groups were represented. The lower diversity and abundance found in
this study might be explained by the presence of planktivorous fishes and most
probably low light penetration (low transparency, especially in the communal
lands). Though fish abundance was not part of this study, it was noted that
fishes were present in all of the reservoirs. Humans were observed actively
fishing on the reservoirs. Planktivorous organisms have preferences for
specific food items (Wetzel, 1983). Large planktons are the preferred food
item, as they contain the most energetic reward to balance the energy loss the
fish has most incurred when hunting. In the case of the studied reservoirs,
large planktons were composed of big cladocerans like some species of
Daphnia and Calanoids. The idea of
active hunting on large zooplankton can easily be depicted
from Table 3.9 where large Calanoids are scarce while their juveniles are
abundant. Large Cyclopoids and cladocerans were also rarely found in the
samples and most of the time when they were found they were only carcasses. So
there seems to be a good zooplankton productivity, which is very well regulated
by high predation by fish. This is in accord with Hrbàéek et
al. (1958) in Wetzel (1983) who shows that the size of the zooplankton
community is regulated by the presence of fish predators. The zooplankton
community structure found is also in agreement with Arcifa et al.
(1986) who concluded that plankton proliferation is greatly affected by the
predator-prey relationships in reservoirs.
The correlation found in zooplankton and phytoplankton species
might be explained by the availability and preference of food. The availability
of a certain phytoplankton species that constitute a preferred source of food
to a zooplankton counterpart will allow it to grow easily, following the same
abundance curve. This tends to confirm that the availability of nutrients and
necessary conditions for phytoplankton growth has a pulling effect on
zooplankton species.
4.2.3 Study limitations
The samples were taken during a drought period (Table 3.3). It
is therefore necessary to be aware that the results might have been different
if the rainy period (November-April) were normal. This is because low rainfall
mobilises less nutrient laden sediments than high intensity (Basnyat et
al., 2000 in Brainwood et al., 2004). It is, however, important
to remember that the studied reservoirs are located in a semi arid region
characterised by low and erratic rainfall as shown by Zirebwa and Twomlow
(1999). Since heavy rains should not be expected in the area, the water
managers can consider that the reservoirs are protected and environmentally
healthier. Water managers should therefore note that water quality
investigations are carried out, as stated by Brainwood et al. (2004),
to provide information on the health of the water bodies and allow them to
develop strategies for better management of catchment and water resources.
4.2.4 Management implications
The results of this study can be used to guide future
management of these and similar man-made reservoirs in rural Zimbabwe.
Reservoirs on communal lands had similar water quality as found in the National
Park, which is attributed to the lack of upstream development surrounding these
particular reservoirs. However, it is believed that if human populations alter
the current use of these water bodies and develop upstream areas, water quality
will suffer. Therefore, it would be stressed that upstream development,
particularly development that would result in an influx of nitrogen and
phosphorus, be limited in these areas. This is particularly important as the
reservoirs contained phytoplankton that would proliferate into toxic algal
blooms with the influx of those particular nutrients. Such blooms would
compromise the quality of water for both human use and the health of the
current aquatic community.
Secondly, this study found that local soil conditions were
very different from water conditions. This result can be attributed to the
presence of a healthy vegetative cover layer surrounding the reservoirs. Such a
vegetative layer acts as a buffer to influxes of elements, and helps to
maintain stable and healthy water conditions. Reservoir managers should
maintain a healthy vegetative buffer around the water body to assist in
mitigating any future changes in local conditions.
V. Conclusion
The results of an assessment of plankton diversity as a water
quality indicator of small reservoirs in communal lands and in the National
Park (Matopos) were presented. The study hypothesized that water in small
reservoirs in communal lands might be turbid but richer in nutrients as an
effect of land and water use. The expected nutrient richness would in turn
influence phytoplankton abundance, which would therefore be expected to be
greater and less diverse. And a second hypothesis followed by expecting
reservoirs in the National Park to have less nutrients but more diverse
plankton community than those in communal lands.
This study found that water quality throughout the study area
was at acceptable levels, and did not significantly differ between National
Park and communal lands. This finding was contrary to expectations, and
indicates that water conditions may be better in areas of human influence than
currently thought. This pattern is attributed to limited upstream development,
a condition that should be maintained to ensure the integrity of the aquatic
ecosystems. High levels of vegetative cover were also thought to mitigate the
impacts of local conditions on water bodies, and should be preserved to protect
these systems from future change.
A third hypothesis expected no seasonal changes in plankton
community structure of the studied small reservoirs. Contrary to this
expectation, the diversity and abundance of plankton communities in the study
area were influenced by an informal sub-seasonal rainfall patterns. Species
composition of both phyto- and zooplankton were similar to expectations based
on other ponds and lakes. However, species of phytoplankton were found that
could potentially develop into toxic algal blooms with changes in water
quality. Zooplankton species abundance was at a lower level than expected,
possibly due to the presence of planktivorous fish in the reservoirs.
VI. References
Arcifa, M.S, Northcote, T.G. and Froehlich, O. 1986.
Fish-zooplankton interactions and their effects on water quality of a tropical
Brazilian reservoir. Hydrobiologia. 139:49-58
Bolton, P. 1994. Assessing irrigation impact on the environment.
Bulletin no 29, HR Wallingford,
ODU. UK. 29:4-6
Brainwood, M.A., Burgin S. and Maheshwari, B. 2004. Temporal
variations in water quality of farm dams: impacts of land use and water
sources. Agric. Water Manage. 70: 151-175
Basima, B., Mbalassa, M., Muhigwa, B. and Nshombo, M. (in
press). Anthropogenic influences of the biota of the littoral zone of lake
Kivu, Bukavu basin, DRCongo. SILCongress2004 Proceedings. Paper
presented for the SIL Congres s 2004. Lahti, Finland.
Cander-Lund, H. and Lund, J.W.G. 1995. Freshwater algae. Their
microscopic world explored. Biopress Ltd. England. UK. 360 pp
Carpenter, S., Caraco, N.F., Corell, D.L., Howarth, R.W.,
Sharpley, A.N. and Smith, V.H. 1998. Nonpoint Pollution of surface waters with
Phosphorus and Nitrogen. Ecol. Appl. 8: 559-568
Chapman D. (éd.) 1992. Water Quality Assessments-A
guide to the Use of Biota, Sediments and Water in Environmental Monitoring-
Second Edition. UNES CO/WHO/UNEP. Chapman and Hall publishers.
Crawley, M.J., Little, C., Southwood, T.R.E. and Ulfstrand, S.
2000. The biology of lakes and ponds. Biology of habitats. Oxford
University Press. Pp 29-50.
Davies, B. and Day, J. 1998. Vanishing waters. UCT
Press. Cape Town. South Africa. 487 pp.
Drenner, R.W., Threlkeld, T.S., Smith, D.J., Mummert, J.R. and
Cantrell, P.A. 1989. Interdepedence of phosphorus, fish and site effects on
phytoplankton biomass and zooplankton. Limnol. Oceangr. 34:
1315-1321
Durand, J.-R. and Lévêque, C. 1980. Flore et
faune aquatiques de l'Afrique Sahélosoudanienne. Éditions de
l'Office de la Recherche Scientifique et Technique Outre- Mer Collection
Initiations-Documentations Techniques no 44. Paris. France.
Edmondson, W.T. and Winberg, G.G. 1971. A manual on methods
for the assessment of secondary productivity in fresh waters. IBP Handbook No
17. Blackwell Scientific Publications, Oxford.
FAO, 1997. Irrigation potential in Africa: A basin approach.
FAO-Land & Water Dvpt. Div. Rome. Italy.
Fernando, C. H. (éd.) 2002. A guide to Tropical Freshwater
Zooplankton. Identification, Ecology and Impact on Fisheries. Backhuys
Publishers, Leiden.
Grant, P.M.1981. The fertilisation of sandy soils in peasant
agriculture. Zimbabwe Agricultural Journal. 81: 97-102.
Green, J. 1990. Zooplankton associations in Zimbabwe. J.
Zool., Lond. 222: 259-283.
Hart, R.C. 1990. Zooplankton distribution in relation to
turbidity and related environmental gradients in a large subtropical reservoir:
patterns and implications. Freshwater Biology 24: 241-263
HR Wallingford 2004. Guidelines for Predicting and Minimising
Sedimentation in small dams. HR Wallingford/DFID. Report OD 152
Hunter, J.M., Rey, L. and Scott D. 1982. Man-made lakes and
man-made diseases: Towards a policy revolution. Social Sces & Med.
16: 1127-1145
Kabell, T. 1986: Assessment of Design Flood Hydrographs. The
Zimb. Eng. 24: 573 - 578
Lawrence, P. and Hasnip, N. 2004. Sedimentation in small dams.
Impacts on the income of poor rural communities. HR Wallingford, DFID
Lawrence, P. and Lo Cascio, A. 2004a. Sedimentation in small
dams. Hydrology and drawdown computations. HR Wallingford, DFID
Lawrence, P. and Lo Cascio, A. 2004b. Sedimentation in small
dams. Estimating the impact of catchment conservation, check dams and sediment
bypassing in reducing dam siltation. HR Wallingford, DFID
Lawrence, P., and Lo Cascio, A. 2004c. Sedimentation in small
dams. Development of a catchment characteristisation and sediment yield
prediction procedure. HR Wallingford, DFID
Lemoalle, J., Adeniji, A., Compère, P., Ganf, G.G.,
Melack, J. and Talling, J. 1981. The ecology and utilization of African Inland
Waters. UNEP Reports & Proceedings. Série 1. Symoens J.J.,
Burgis M., Gaudet J.J. (éds). Nairobi. Kenya.
Moyo, S.1995. The land question in Zimbabwe. Sapes Books, Harare,
Zimbabwe.
Mugabe, F., Hodnett, M. and Senzanje, A. 2003. Opportunities
for increasing productive water use from dam water-A case study from semi-arid
Zimbabwe. Agricultural Water Management, Vol. 62 (2): 149-163
Munsell 1975. Soil color charts. Munsell color. Baltimore,
Maryland.
Muthimkulu, S.N. 2004. Biological assessment of the state of
the water quality using the South African Scoring System. A case of the Mbuluzi
River, Swaziland. Masters thesis. Department of Civil Engineering, University
of Zimbabwe. Zimbabwe.
Mwenge, K.J-M. 2004. Water productivity and yield gap analysis
of water harvesting systems in the semi-arid Mzingwane catchment, Zimbabwe. MSc
Thesis, Department of Civil Engineering, University Zimbabwe. Zimbabwe.
Naeem, S., Chapin III, F.S., Costanza, R., Ehlrich, P.R.,
Golley, F.B., Hooper, U.D., Lawton, J.H., O'Neill, R.V., Mooney, H.A., Sala,
O.E., Symstad, A.J. and Tilman, D. 1999. Biodiversity and Ecosystem
functioning: Maintaining Natural Life Support Processes. No 4. Issues in
Ecol.
Naz, M. and Turkmen, M. 2005. Phytoplankton Biomass and Species
Composition of Lake Gölbasi (Hatay-Turkey). Turk J Biol
29:49-56
Nhapi, I., Hoko, Z., Siebel, M.A. and Gijzen, H.J. 2002.
Assessment of the major water and nutrient flows in the Chivero catchment area,
Zimbabwe. Physics & Chem. Earth 27: 783-792
Nhiwatiwa, T. 2004. The limnology and ecology of two small
man-made reservoirs in Zimbabwe. Mphil thesis, Dept of Biological Sciences,
University of Zimbabwe, Harare, Zimbabwe.
Ongley, D. 1996. Control of water pollution from
agriculture-FAO irrigation and drainage paper 5. GEMS/Water Collaborating
Centre. Canada Centre for Inland waters. Burlington, Canada.
Oomen, M.V., de Wolf, J. and Jobin, W.R. 1994. Health and
Irrigation. Volume I and II. ILRI publication 45 Wageningen, The Netherlands
Pinel-Alloul, B., Niyosenga, T. and Legendre, P. 1995. Spatial
and environmental components of freshwater zooplankton structure.
Ecoscience. 2(1): 1-19
Reynolds, C.S.1984. The ecology of freshwater phytoplankton.
Cambridge University Press.
Scheffer, M., Taddese, G., Boelee, E., Senzanje, A., Yohannes,
M., Laamrani, H. 2004. Understanding effects of micro-dams on productivity and
health: towards strategies to the reduce environmental disease risk in Morocco,
Ethiopia and South Africa/Zimbabwe. Multidisciplinary programme grant.
Preliminary proposal. WOTRO.
Schindler, D.W. 1978. Factors regulating phytoplankton production
and standing crop in the world's freshwaters. Limnol. Oceanogr. 23,
478-486.
Senzanje, A. and Chimbari, M.J. 2002. Inventory of small dams
in Africa-A case study of Zimbabwe. Report for International Water Management
Institute (IWMI), Colombo, Sri Lanka.
Sharma, C. 2003. Biological impacts and local perceptions of
Tinau River Dam, Nepal. Noragric MSc thesis. Agricultural University of
Norway.
Sinkala, T., Mwase, E.T and Mwala, M. 2002. Control of aquatic
weeds through pollutant reduction and weed utilization: a weed management
approach in the lower Kafue River of Zambia. Physics and Chemistry of Earth 27:
983-99 1
Siwela, A.H., Marufu, G. and Mhlanga, A.T. 1996. A comparison
of organochlorine pesticide residues in Upper Ncema and Lower Umguza Dams,
Zimbabwe. Journal of Applied Science in Southern Africa. 23-36.
Smalley, G.W. and Coats, D.W. 2002. Ecology of the red-tide
dinoflagellate Ceratium furca: distribution, mixotrophy, and grazing
impact on ciliate populations of Chesapeake Bay. Eukaryot Microbiol. 49:
63-73.
Straskraba, M. and Tundisi, J.G. 1999. Reservoir Water Quality
Management. Guidelines of Lake Management. Volume 9. International Lake
Environment Committee (ILEC) Shiga, Japan.
Sugunan, V. V. 1997. Fisheries Management of small water
bodies in seven Countries in Africa, Asia and Latin America. FAO Fisheries
Circular. No. 933. FAO, Rome. 149pp.
Talling, J.F. and Lemoalle J., 1998. Ecological dynamics of
Tropical Inland Waters. Cambridge University Press. 261pp.
Thornton, J.A. and Coterill, N.G. 1978. Some hydrobiological
observations on five tropical African montane impoundments. Trans.
Rhod.Sci.Ass. 59:22-29.
Thorp, J.H., Black, A.R., Jack J.D. and Casper, A.F. 1996.
Pelagic enclosures - modification and use for experi-mental study of riverine
plankton. Archive fUr Hydro-biologie (Suppl. 113). Large Rivers, 10, 583-589
Tredgold, R. 1956. The Matopos. Federal Department of
Printing and Stationery, Salisbury.
Vitousek, P.M., Aber, J., Howarth, R.W., Likens, G.E., Matson,
P.A., Schindler, D.W., Schlesinger, W.H. and Tilman, G.D. 1997. Human
alterations of the Global Nitrogen Cycle: Causes and Consequences. Issues
in Ecol. No 1.
Ward B. H. and Whipple C.G. 1959. Freshwater biology
2nd edition. Edmondson W.T. (éd.). USA
Wetzel, R.1983. Limnology. Saunders College Publishing. USA. 860
pp.
ZINWA (undated). Operational Guidelines for the Control of Water
Pollution in Zimbabwe.
Zirebwa J. and Twomlow, S. 1999. Historical profiles of
selected small dams in communal areas of Zimbabwe. Paper presented at the
Engineering Technology for Increased Agricultural Productivity Conference.
HICC, Harare, Zimbabwe. 8-10 September.
| 

