3.2 Water quality
The overall pH was slightly alkaline (7.6-8.5), the electrical
conductivity was lower than 200 jiS/cm while the hardness ranged from 23 to 104
mg/l and total nitrogen as well as total phosphorus had values respectively ca.
0.1 mg/l and 0.01 mg/l (Table 3.3). pH readings seem to vary seasonally in
communal lands' reservoirs more than in those located in the National Park.
Conductivity looks also generally higher in the communal lands. The
transparency of water measured by the secchi depth was higher in the National
Park as compared to the communal lands. However, the lowest transparency was
also recorded in Chitampa reservoir in the National Park.
Table 3.3 Water quality of the studied reservoirs (for April 2005
samples)
|
Parameter
|
Communal lands
|
|
|
National Park
|
|
|
|
Sibasa
|
Dewa
|
Denje
|
Makoshe
|
Maleme
|
Mezilume Mpopoma
|
Chitampa
|
|
pH FEB
|
7.6
|
8.1
|
7.7
|
7.7
|
8.5
|
7.9
|
8.0
|
7.6
|
|
APR
|
8.2
|
8.5
|
8.4
|
8.4
|
8.4
|
7.6
|
8.3
|
7.7
|
|
EC (jiS/cm) FEB
|
107
|
200
|
200
|
157
|
147
|
76
|
109
|
93
|
|
APR
|
111
|
250
|
183
|
198
|
138
|
102
|
110
|
109
|
|
Secchi depth (m)
|
0.2
|
0.3
|
0.2
|
0.3
|
0.5
|
1.7
|
2
|
0.1
|
|
Total Hardness
|
|
|
|
|
|
|
|
|
|
(jig/L)
|
42
|
103.8
|
58.4
|
83.5
|
46.8
|
22.5
|
36
|
35.5
|
|
Total Nitrogen
|
|
|
|
|
|
|
|
|
|
(jig/L)
|
94
|
87
|
84
|
99
|
8
|
12
|
11
|
14
|
|
TP (jig/L) FEB
|
7
|
11
|
6
|
6
|
4
|
3
|
3
|
7
|
|
APR
|
8
|
17
|
38
|
5
|
4
|
59
|
2
|
34
|
Abbreviations:
Chemical parameters' abbreviations: Total phosphorus ( TP),
electric conductivity (EC).
3.3 Plankton community composition
3.3.1 Phytoplankton
The flora identified and counted in February and April 2005 is
presented in Table 3.4. The taxon that got the highest abundance was
Hydrodictyon spp., which accounted for an average of 30% of the
overall phytoplankton sampled in April. Hydrodictyon was followed by
Anabaena (19.9%), Peridinium (15.7%), and Melosira
(11.7%), all sampled in April. Hydrodictyon was very rare during the
first sampling (February) period accounting for around 0.1% of the
phytoplankton sampled in April. The phytoplankton sampled in February showed an
abundance of Melosira (18.7%) followed by Ceratium hirundinella
(17.3%) and Pinnularia (11.9%). It can be noticed as well from
Table 3.4 that the taxa collected in April were much more abundant than that of
February with a percentage of 84 in April against 15.8 in April. Though the
highest abundance was observed in April, February showed the highest number of
taxa (highest diversity). Chlorophytes was the major group in both periods with
29 genera in February and 20 in April. Chlorophytes was followed by
bacillariophytes (diatoms) with 17 genera observed in February against 12 in
April. Cyanophytes (5 genera), euglenophytes (4 genera), Fungi (3 genera),
dinophytes (2 genera), xanthophytes (1 genra) and canophytes (2 genera) were
also observed in February. Cyanophytes (4 genera), euglenophytes (2 genera) and
Fungi were observed in addition to chlorophytes and bacillariophytes.
Table 3.4. Composition and density (ind. l-1) of the
phytoplankton in eight reservoirs located on communal lands and National Park
in rural Zimbabwe.
|
Class
|
Taxa
|
|
February
|
|
|
April
|
|
|
Communal lands
|
National Park
|
Abundance
|
Communal lands
|
National Park
|
Abundance
|
|
Chlorophyta
|
Volvox
|
128
|
0
|
128
|
0
|
0
|
0
|
|
Amscottia
|
304
|
616
|
921
|
21
|
0
|
21
|
|
Sphaerocystis
|
166
|
154
|
320
|
176
|
122
|
298
|
|
Dictyosphaerium
|
47
|
0
|
47
|
0
|
0
|
0
|
|
Micractinium
|
54
|
26
|
80
|
0
|
0
|
0
|
|
Scenedesmus
|
14
|
31
|
46
|
98
|
5
|
104
|
|
Staurodesmus
|
13
|
173
|
186
|
5
|
248
|
254
|
|
Ankistrodesmus
|
5
|
0
|
5
|
10
|
78
|
88
|
|
Pediastrum
|
31
|
73
|
105
|
2562
|
28
|
2590
|
|
Sorastrum
|
2
|
0
|
2
|
0
|
0
|
0
|
|
Haematococcus
|
0
|
647
|
647
|
0
|
0
|
0
|
|
cladophora
|
4
|
12
|
16
|
0
|
0
|
0
|
|
Staurastrum
|
10
|
1252
|
1262
|
1371
|
2264
|
3636
|
|
Unidentified2
|
0
|
1161
|
1161
|
0
|
0
|
0
|
|
Unidentified1
|
0
|
864
|
864
|
0
|
0
|
0
|
|
Unidentitfied3
|
0
|
263
|
263
|
0
|
0
|
0
|
|
Cosmarium
|
8
|
441
|
449
|
13
|
186
|
199
|
|
Euastrum
|
21
|
94
|
116
|
0
|
0
|
0
|
|
Sphaerozoma
|
0
|
78
|
78
|
0
|
93
|
93
|
|
Xanthidium
|
0
|
93
|
93
|
0
|
0
|
0
|
|
Actinastrum
|
0
|
462
|
462
|
0
|
0
|
0
|
|
Arthrodesmus
|
0
|
38
|
38
|
0
|
26
|
26
|
|
Hydrodictyon
|
0
|
27
|
27
|
0
|
27221
|
27221
|
|
Closterium
|
4
|
2
|
5
|
132
|
23
|
155
|
|
Selenastrum
|
0
|
13
|
13
|
0
|
0
|
0
|
|
Spondylosium
|
0
|
73
|
73
|
0
|
0
|
0
|
|
Onynchonema
|
0
|
26
|
26
|
0
|
0
|
0
|
|
Pleurotaenium
|
0
|
28
|
28
|
0
|
1082
|
1082
|
|
Micrasterias
|
32
|
96
|
128
|
0
|
52
|
52
|
|
Indet1
|
0
|
0
|
0
|
0
|
233
|
233
|
|
Onynchonema
|
0
|
0
|
0
|
0
|
62
|
62
|
|
Penium
|
0
|
0
|
0
|
0
|
16
|
16
|
|
Zygnema
|
0
|
0
|
0
|
0
|
383
|
383
|
|
Spirogyra
|
0
|
0
|
0
|
0
|
16
|
16
|
|
Cylindrocystis
|
0
|
0
|
0
|
0
|
10
|
10
|
|
Bacillariophyta
|
Navicula
|
142
|
825
|
968
|
574
|
717
|
1291
|
|
Surirella
|
53
|
5
|
58
|
47
|
0
|
47
|
|
Melosira
|
3055
|
2310
|
5365
|
7923
|
2585
|
10508
|
|
Achnantes
|
0
|
61
|
61
|
0
|
127
|
127
|
|
Asterionella
|
0
|
3
|
3
|
0
|
0
|
0
|
|
Cymatopleura
|
0
|
53
|
53
|
0
|
0
|
0
|
|
Rhopalodia
|
0
|
60
|
60
|
0
|
0
|
0
|
|
Oscillatoria
|
35
|
28
|
62
|
0
|
0
|
0
|
|
Gomphosphaerium
|
0
|
28
|
28
|
0
|
0
|
0
|
|
Gomphonema
|
6
|
0
|
6
|
0
|
0
|
0
|
|
Fragilaria
|
4
|
0
|
4
|
0
|
31
|
31
|
|
Rhizosolenia
|
38
|
125
|
162
|
147
|
414
|
562
|
|
Synedra
|
0
|
1430
|
1430
|
78
|
72
|
150
|
|
Pinnularia
|
0
|
3397
|
3397
|
5
|
427
|
432
|
|
Stephanodiscus
|
0
|
2
|
2
|
0
|
0
|
0
|
|
Amphiprora
|
0
|
4
|
4
|
0
|
0
|
0
|
|
Cymbella
|
2
|
0
|
2
|
0
|
194
|
194
|
|
Gyrosigma
|
0
|
0
|
0
|
18
|
0
|
18
|
|
Cyanophyta
|
Coelosphaerium
|
800
|
306
|
1106
|
0
|
0
|
0
|
|
Microcystis
|
153
|
101
|
254
|
0
|
0
|
0
|
|
Microchaete
|
4
|
0
|
4
|
0
|
0
|
0
|
|
Merismopedia
|
4
|
0
|
4
|
0
|
0
|
0
|
|
Anabaena
|
48
|
33
|
80
|
17916
|
0
|
17916
|
|
Canophyta
|
Nostoc
|
93
|
0
|
93
|
0
|
0
|
0
|
|
Euglenophyta
|
Trachelomonas
|
0
|
21
|
21
|
0
|
0
|
0
|
|
Phacus
|
116
|
427
|
543
|
536
|
585
|
1120
|
|
Euglena
|
115
|
7
|
122
|
163
|
18
|
181
|
|
Astasia
|
150
|
0
|
150
|
0
|
0
|
0
|
|
Fungi
|
Rhizosiphon
|
0
|
2
|
2
|
0
|
0
|
0
|
|
Chytridium
|
24
|
96
|
120
|
0
|
0
|
0
|
|
Sporangium
|
441
|
308
|
749
|
16
|
0
|
16
|
|
Dinophyta
|
Ceratium
|
4945
|
0
|
4945
|
6151
|
18
|
6169
|
|
Peridinium
|
1202
|
2
|
1204
|
14084
|
5
|
14089
|
|
Xanthophyta
|
Ophiocytium
|
3
|
0
|
3
|
0
|
0
|
0
|
|
Cryptophyta
|
Cryptomonas
|
0
|
11
|
11
|
0
|
0
|
0
|
|
Chrysophyta
|
Dinobryon
|
0
|
0
|
0
|
0
|
471
|
471
|
|
Total
|
12276
|
16386
|
28662
|
52046
|
37812
|
89859
|
There was no significant difference in phytoplankton species
composition in February and April (Spearman's rank correlation coefficient
rs = 0.203, N=71). The Student's t-test did not show any significant
difference between February and April' s phytoplankton species (t = -1.71; P=
0.087; N = 71).
Reservoirs in the National Park were more diversified in taxa
compared to those in the communal lands, with 49 taxa against 38 sampled in
February and 32 against 22 taxa identified in the samples of April (Table 3.5).
This difference of diversity in the National Park compared to the communal
lands is confirmed by the significant difference obtained using the paired
samples Student' s t-test (t = 21.0; df = 1; P = 0.03).
Table 3.5 shows, as well, that phytoplankton communities were
more diverse in February on both communal lands and within the National Park. A
significant difference in species diversity was found between the two study
periods, using the Student' s t-test (t = 33.0; df=1; P = 0.019).
Table 3.5. Phytoplankton diversity: number of taxa recorded in
the study area
|
Communal lands reservoirs
|
Commun al lands
|
National Park reservoirs
|
|
National Park
|
|
Makos Dew Sibasa he a Denje
|
Male me
|
Mezilu me
|
Mpopo
ma Chitampa
|
|
February April
|
15
19
|
24
14
|
12
14
|
21
12
|
38
22
|
16
13
|
25
18
|
36
29
|
18
14
|
49
32
|
|
Mean
|
|
|
|
|
30.0
|
|
|
|
|
40.5
|
A significant correlation was found between the phytoplankton
diversity recorded in communal lands and in the National Park, and between
February and April, with Spearman's rank correlation coefficient (rs
=1.000**, n=2, with significance at 0.01 level (2-tailed)).
The Simpson's index of diversity is presented in Table 3.6.
The highest as well as the lowest indices were recorded in the National Park
respectively in February and in April. The diversity in communal lands was
consistently high.
Table 3.6. Simpson's diversity index calculated on February and
April samples
|
February
|
April
|
|
Communal lands
|
National Park
|
Communal lands
|
National Park
|
|
0.76
|
0.91
|
0.77
|
0.5
|
Though the chlorophytes division was more diverse in February,
it only constituted 7 % of taxa abundance in communal lands (Table 3.6).
However it constituted 41% in the National Park.
Table 3.7, Table 3.8, Fig. 3.1 and Fig 3.2 highlight the
difference in the phytoplankton composition and abundance in communal lands and
in the National Park and for February and April samples. Phytoplankton
abundance was dominated in February by dinophytes (50 %) followed by
bacillariophytes or Diatoms (27%) in communal lands. In the National Park
bacillariophytes were more abundant (5 1%) (Table 3.7, Fig.3.1). Sibasa
reservoir dominated the February abundance of taxa in communal lands with 54%
followed by Denje reservoir (3 1.5%) while Mpopoma dominated in the National
Park with 53% followed by Mezilume and Maleme with respectively 24% and 17% of
the total abundance (Table 3.7).
Table 3.7. Abundance of major groups for February samples (no.
l-1)
|
Class
|
|
Reservoirs
|
|
Communal
Lands
total %
|
|
Reservoirs
|
|
National
Park
total %
|
|
Denj Sibasa e
|
Dewa
|
Makos he
|
Male me
|
Mezilu Chita me mpa
|
Mpop o
ma
|
|
Chlorophyta
|
82
|
548
|
25
|
189
|
845 6.9
|
179
|
3224
|
495
|
2847
|
6744 41.2
|
|
Bacillariophyta
|
34
|
2810
|
180
|
311
|
3334 27.2
|
2179
|
548
|
48
|
5553
|
8329 50.8
|
|
Cyanophyta
|
10
|
152
|
689
|
157
|
1008 8.2
|
0
|
111
|
195
|
134
|
440 2.7
|
|
Canophyta
|
0
|
53
|
0
|
40
|
93 0.8
|
0
|
0
|
0
|
0
|
0 0.0
|
|
Euglenophyta
|
342
|
20
|
3
|
15
|
381 3.1
|
330
|
58
|
45
|
22
|
454 2.8
|
|
Fungi
|
74
|
221
|
132
|
37
|
465 3.8
|
162
|
20
|
91
|
133
|
406 2.5
|
|
Dinophyta
|
6079
|
63
|
0
|
5
|
6147 50.1
|
2
|
0
|
0
|
0
|
2 0.0
|
|
Xanthophyta
|
3
|
0
|
0
|
0
|
3 0.0
|
0
|
0
|
0
|
0
|
0 0.0
|
|
Cryptophyta
|
0
|
0
|
0
|
0
|
0 0.0
|
0
|
0
|
0
|
11
|
11 0.1
|
|
Total
|
6624
|
3868
|
1030
|
754
|
12277 100.0
|
2852
|
3961
|
874
|
8700
|
16386 100
|
|
%
|
54.0
|
31.5
|
8.4
|
6.1
|
100
|
17.4
|
24.2
|
5.3
|
53.1
|
100
|
April samples were dominated by dinophytes (38.9%) and
cyanophytes (34.4%) in the communal lands and by chlorophytes (85%) in the
National Park (Table 3.8). Dinophytes and cyanophytes were rare in the National
Park. The second more abundant group in the National Park was bacillariophytes
(Diatoms) with 12 % of the total abundance. As for February, Sibasa reservoir
recorded the second highest abundance of taxa 41% of total abundance in the
communal lands after Makoshe reservoir (43 %). Mezilume (83.61%) dominated the
overall abundance in the National Park followed by Mpopoma (13.2%). It is
important to note that In February Mpopoma dominated over Mezilume.
A positive Spearman's rank correlation coefficient was found
between the phytoplankton major groups in communal lands and the National Park
(rs=0.477; P=0.0194; N=9. The paired t-test gave a non-significant
difference (t=-0.39; P=0.70; df=8).
The major groups in February obtained a Simpson's index of
diversity of 0.77 in the communal lands and 0.57 in the National Park. The
Simpson's diversity index for April samples showed high diversity in the
communal lands (0.3 1) while the National Park obtained low diversity
(0.74).
Table 3.8. Abundance of major groups for April samples (ind.
l-1)
|
|
Reservoirs
|
Comm
|
|
Reservoirs
|
|
|
|
Makos Dew
|
unal Denj lands
|
|
Nation
Malem Mezilu Mpopo Chitaal Park
|
|
Group
|
|
Sibasa he a
|
e total
|
%
|
e me ma mpa total
|
%
|
|
Chlorophyta
|
|
197 518 2665
|
1009 4389
|
8.4
|
78
|
29260
|
2701 109 32148
|
85.0
|
|
Bacillariophyta
|
|
321 5346 1252
|
1873 8793
|
16.9
|
277
|
1770
|
2282 238 4567
|
12.1
|
|
Chrysophyta
|
|
0 0 0
|
0 0
|
0.0
|
0
|
471
|
0 0 471
|
1.2
|
|
Cyanophyta
|
|
1211 16680 0
|
26 17916
|
34.4
|
0
|
0
|
0 0 0
|
0.0
|
|
Dinophytes
|
|
19433 21 5
|
777 20236
|
38.9
|
8
|
15
|
0 0 23
|
0.1
|
|
Euglenophyta
|
|
202 26 398
|
72 698
|
1.3
|
381
|
98
|
21 104 604
|
1.6
|
|
Fungi
|
|
16 0 0
|
0 16
|
0.0
|
0
|
0
|
0 0 0
|
0.0
|
|
Total (ind. l-1)
|
|
21379 22590 4321
|
3757 52047
|
100.0
|
743
|
31614
|
5005 451 37813
|
100.0
|
|
%
|
41.08 43.40 8.30
|
7.22 100.00
|
|
1.97
|
83.61
|
13.24 1.19 100
|
|
The Spearman' s rank correlation between communal lands and
National Park was not significant at 5 % level (P=0.05) with
rs=0.072 and N=7. No significant difference in the phytoplankton
major groups was found between communal lands and the National Park in April
samples using t-test: t=0.34; P=0.74; df=6.
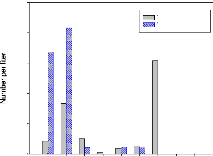
10000
Tot Communal lands Tot National Park
8000
6000
4000
2000
0
ChloroBacillarioCyano Cano Eugleno Fungi Dino Xantho Crypto
Fig. 3.1. Abundance of phytoplankton major groups/February 05
Chloro Bacilario Chryso Cyano Dino Eugleno Fungi
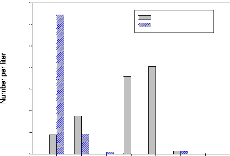
35000
30000
25000
20000
15000
10000
5000
0
Tot Communal Lands
Tot National Park
Fig.3.2 Abundance of phytoplankton major groups/ April 2005
There was a significant difference in abundance between
February and April phytoplankton samples in the communal lands using the t-test
(t=-2.06; P=0.05; df=14) but no significant difference was found in the
National Park (t=-0.86; P=0.39; df=14). However, there was high significant
difference in phytoplankton abundance between the communal lands and the
National park using a chi-square test (P<0.01).
| 

