4.2.3.3 ROA for Grain Producers
Figure 23 represents the ROA medians for each group of
leverage for the grain producers. For this specialization, the results are not
really similar with what we can observe for the ROE. First of all, group 2 is
never statistically higher than any other groups, and is even the lowest
performance in 2008 and 2009 (without a statistical difference however). Only
2006 and 2010 tend to be consistent with the theory which states that
performance increases with leverage. In 2010 group 1 was
significantly higher than group 4. However, there was no
significant difference with group 5 even if its median was lower, because of
the higher standard deviation in group 5 (see appendix Appendix 13 page
111).
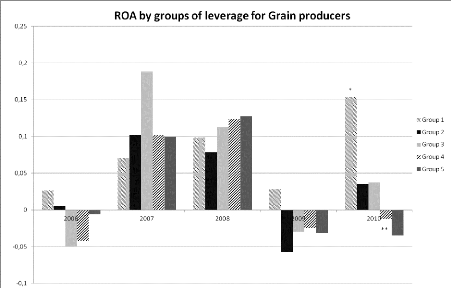
Figure 23: ROA for each year and each group of leverage
for grain producers * means significantly higher than **
The only statistical difference between groups tends to prove
that leverage increases ROA, but only one year out of five. Therefore, it will
be hard to make conclusions on these results for grain producers, except that
it seems that the optimal leverage range is 40-60% for this specialization.
4.2.3.4 ROA for Cattle Farming
The results for the ROA are consistent with what have been
observed for the ROE for cattle farming. Group 2 has a higher median than group
4 and 5 in 2008, and performance seems to increases with the leverage (see
Figure 24). Once again, group 1 do not present stable results over the year,
which could be the consequence of financial distress for those farms which are
more leveraged than 80%. However, it will be hard to make more interpretation
from these results as only 45 farms are studied for this specialization, and
significant differences are observed only in 2008.
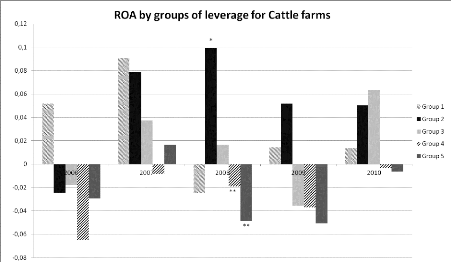
Figure 24: ROA for each year and each group of leverage
for cattle farming * means significantly higher than **
4.2.3.5 Results Summary for ROA by Groups of
Leverage
The median of group 2 is usually significantly higher than the
medians of groups 4 and 5 (Table 20). Group 3 in two cases over-performs group
4 or 5, and group 1 is better than group 4 in one case. The same elements are
observed for the ROA than for the ROE: the performance increases with the
leverage, even if the differences between groups are not always significant.
The high heterogeneity intragroup and between groups, illustrated by the high
standard deviations (see Appendix 11, Appendix 12 and Appendix 13 page 103, 107
and 111) explains why the differences cannot be considered as significant even
if it could have been anticipated so only by looking at the means and medians
of the different groups.
|
Year
|
|
Dairy
|
|
Grain
|
|
Cattle
|
|
Diversified
|
|
2006
|
|
-
|
|
|
-
|
|
-
|
|
-
|
|
|
2007
|
2
|
&3
|
>
|
5
|
-
|
|
-
|
|
3 >
|
4
|
|
2008
|
|
-
|
|
|
-
|
2
|
> 4 &
|
5
|
-
|
|
|
2009
|
2
|
> 4
|
&
|
5
|
-
|
|
-
|
|
2 >
|
5
|
|
2010
|
2
|
> 4
|
&
|
5
|
1 > 4
|
|
-
|
|
-
|
|
Table 20: results of the Mood's median tests summary for
ROA by groups of leverage for each years
Table 21 presents the average ROA for all specializations and
all years for the studied farms. The first point that can be noticed is that
the average ROA is 3.1% for the average farm in Isère. The ROA reaches
13% for grain farms in 2007, but fall to 1.7% in 2009 for the same
specialization. It is interesting to compare the dairy and the grain
production: both have a close weighted average for ROA, but variability is
really higher for grain than for dairy farming (standard deviation for dairy is
1.7%, but reaches 5.6% for Grain). Grain farming can be considered as a riskier
specialization. In 2008, the average farm in Isère reaches an ROA of
8.2%, 6.4% in 2007, and 6.2% in 2010. However,
the average cattle farm on the long term has an ROA close to the
level of inflation. 2010 is the exception with the best result of all
specialization with 9.0% ROA.
|
Specialization
|
2006
|
2007
|
2008
|
2009
|
2010
|
Mean
|
|
Dairy
|
3,3%
|
5,8%
|
7,3%
|
4,8%
|
3,4%
|
5,2%
|
|
Cattle
|
-3,6%
|
2,4%
|
2,5%
|
1,0%
|
9,0%
|
1,5%
|
|
Grain
|
1,1%
|
13,0%
|
11,9%
|
1,7%
|
5,1%
|
6,9%
|
|
Diversified
|
2,4%
|
5,3%
|
8,5%
|
2,5%
|
7,3%
|
5,0%
|
|
Mean
|
1,9%
|
6,4%
|
8,2%
|
2,9%
|
6,2%
|
3,1%
|
Table 21: Average ROA by specialization and by
years
Table 22 presents the results from a different perspective:
the high leverage groups obtain better results, except for group 1 which
presented strong signs of financial distress. The grain specialization on the
contrary have opposite results, with an ROA decreasing with the leverage.
However, when we consider this element year by year, this result cannot be
observed, showing that time has to be taken in consideration. Except for the
grain specialization, these results are consistent with what we observed for
the ROE, showing that the economical performance increases with the leverage,
and that 80% is a higher limit. Even cattle production obtains positive results
when the leverage is between 40% and 80% (group 2 and 3). In the case of this
specialization, the results of group 3 are better (without significant
difference however) than group 2.
|
Specialization
|
Group 1
|
Group 2
|
Group 3
|
Group 4
|
Group 5
|
Mean
|
|
Dairy
|
-1,1%
|
6,1%
|
5,7%
|
4,5%
|
3,3%
|
5,2%
|
|
Cattle
|
0,7%
|
4,0%
|
4,8%
|
0,9%
|
-4,2%
|
1,5%
|
|
Grain
|
3,8%
|
5,8%
|
6,8%
|
8,6%
|
9,0%
|
6,9%
|
|
Diversified
|
2,2%
|
6,6%
|
6,6%
|
3,2%
|
4,8%
|
5,0%
|
|
Global Mean
|
2,0%
|
6,2%
|
6,2%
|
4,3%
|
4,2%
|
3,1%
|
Table 22: Average ROA by specialization and by
groups
Finally, we can say that H0 cannot be rejected for the first
hypothesis and the second hypothesis tested:
- ROA and ROE tend to increase with the level of debt of
the farms in Isère.
- Financial distress may occur when leverage
increases, reducing ROA or ROE. Looking at the ROE, 80% seem
to be the upper limit. The results for the ROA tend to show that 60% is
probably more appropriate (except for dairy production).
|
|


