|
DYNAMICS OF COVID-19 PANDEMIC IN CAMEROON:
IMPACTS OF SOCIAL
DISTANCIATION AND FACE
MASK WEARING
Thesis presented in partial fullfilment of the requirements for
the award of
the degree of Master of Science in Physics
Specialty:
Biophysics, Atomic and Molecular Physics
Option:Biophysics
by
YAMENI STEINLEN DONAT
DONY
Registration Number: 16N2590
Bachelor of Science in
Physics
Under the supervision of
MVOGO ALAIN
Doctor, University of Yaounde I
2021

Dedication
I dedicate this thesis to,
My parents Mr DJOUADJI VICTOR and Mrs
TCHIBONSOU BLANDINE.
iii
Acknowledgments
I would like to express my deepest gratitude to God Almighty for
having once again given me the chance to do this work and to all the people
who, through their good deeds, have supported me in the realisation of this
work. I would particularly like to thank the following people:
- My thesis director Doctor MVOGO Alain who
inspired us to initiate this subject of scientific research. I am grateful to
him for the immense attention he paid to this work and for the rigor he imposed
on our scientific acuity.
- The members of the jury for their availability and the
attention given to this work.
I also thank the entire teaching team of the University of
Yaoundé 1 and the professional speakers responsible for my training for
providing the theoretical part of it. Special thanks, to:
- Professor OWONO OWONO Luc Calvin in his
capacity as coordinator of the physical sector at CRFD.
- Professor NDJAKA Jean Marie, Head of
Department of Physics.
- Professor EBOBENA FOUDA Henri Paul for his
judicious advice which contributed to my reflection.
- Professor BEN-BOLIE Germain Hubert for
teaching throughout my University career.
- The other teachers of the Department of Physics, in particular
Pr NANA ENGO Serges, Pr SAÏ-DOU for
their teachings and the many advices they gave us.
- Dr BELOBO BELOBO Didier, Dr TEUMA
Michel, the aminators of biophysics seminars. - Classmates of batch
KOMBOU ARIELLE, ENAMA IDRISS, MAFEU ORNELLA, YURIKA JUSTICE, TCHEUDJUI
RACHEL TSEMO PENIEL, YOUBI ROSE, KOUOTOU KADIJA for their invaluable
help throughout this work. You have been a great help to me throughout our
university career.
- My father Mr DJOUADJI VICTOR, for his sense of
righteousness, his tolerance, his support on all
Master's thesis II * Molecular Atomic Physics and
Biophysics Laboratory-UYI * YAMENI STEINLEN DONAT D
(c)2021
iv
fronts and his calm which allowed my instinct to quickly grasp
the responsability that awaits me. May you be completely satisfied with this
work.
- My mother Mrs TCHIBONSOU BLANDINE, after so
much tireless effort, here is one of the fruits that you have sown since
birth.
- To my big brother BOUYOM DJOUADJI CAMILLE for
his moral support and his precious advice. - To my brothers NGAMENI
YAMENI FRANCK, NOUBIWO FUBEL RUCEL, NOUBISSI DJOUADJI PATRICK for
moral support and encouragement.
-To my uncle Mr KEUMENI AUGUSTIN for his moral
support and his precious advice.
- To my cousins MENINEM MIAMO, NOUTCHIBIWO JAQUELLINE,
DIEJOU ARNOL, NGAMENI MARIE JISELLE, NKEUKO SANDRA for moral support
and encouragement. - My friends MVEMBE FANNY, FONGOU .D, MVUH .F,
OUAFEU DUCET, KENNE BASILE, DONGMO LOIW, DJOUSSE GAVINI, MAFEUSI KEVINE,
NGOUNOU STELLA for the encouragement and wise advice they have kindly
given me.
- To all those who have contributed to the achievement of this
work. May the find here the expression of my deep gratitude.

List of Abreviations
· WHO : World Health Organization
· RNA: Ribonucleic Acid
· EE : Endemic Equilibrium
· MERS-CoV : Middle East Respiratory
Syndrome Coronavirus
· SARS-CoV : Severe Acute Respiratory
Syndrome Coronavirus
· SARS-CoV-2 : Severe Acute Respiratory
Syndrome Coronavirus 2
· INS : National Institute of
Statistics
· EDO : Ordinary Differential
Equation
· DFE : Disease Free Equilibrium
vi
Table of contents
Dedication ii
Acknowledgments iii
List of abbreviations v
Table of contents x
List of figures x
List of tables xi
Abstract xii
Résumé xiii
GENERAL INTRODUCTION xiii
1 GENERAL INFORMATION ON COVID-19 3
1.1 Introduction 3
1.2 History of the coronavirus 3
1.2.1 The Severe Acute Respiratory Syndrome Coronavirus Outbreak
(SARS-
CoV) 4
1.2.2 The Middle East Respiratory Syndrome
Coronavirus Outbreak ( MERS-
CoV) 5
1.2.3 The Coronavirus disease pandemic (COV ID - 19)
5
TABLE OF CONTENTS vii
Master's thesis II * Molecular Atomic Physics and
Biophysics Laboratory-UYI * YAMENI STEINLEN DONAT D
(c)2021
1.3 Origin of SARS-CoV-2 6
1.4 symptoms of COVID-19 7
1.5 Transmission mode 8
1.6 Diagnosis of COVID-19 9
1.7 Course of virus infection 10
1.8 Prevention and Treatment 11
1.9 Causes of COVID-19 12
1.10 Consequences on COVID-19 13
1.11 Some types of viruses 13
1.12 Lethality 14
1.13 Conclusion 15
2 MATHEMATICAL MODEL AND METHODS OF INVESTIGATIONS
16
2.1 INTRODUCTION 16
2.2 Formulation of the model 16
2.3 Basic properties of the model 19
2.4 Local asymptotic stability of disease-free equilibrium (DFE)
of the model (2-2) . . 20
2.4.1 Basic reproduction number 20
2.4.2 Local stability of balance without disease (DFE) 23
2.5 Global asymptotic stability of the disease-free equilibrium
of model (2.2) 25
2.6 Conclusion 26
3 RESULTS AND DISCUSSION 27
3.1 Introduction 27
3.2 Numerical method 27
3.3 Model fitting 27
3.4 Model sensitivity analysis 29
3.5 Short-term predictions 31
3.5.1 Effect of quarantine of undetected individuals on the
dynamics of disease
transmission 31
3.5.2 Effect of the proportion p on the dynamics of disease
transmission 33
TABLE OF CONTENTS viii
Master's thesis II * Molecular Atomic Physics and
Biophysics Laboratory-UYI * YAMENI STEINLEN DONAT D
(c)2021
3.5.3 Effect of the quarantine of detected individuals on the
dynamics of disease
transmission 36
3.5.4 Effect of social distancing and the use of the face mask
38
3.6 Discussion 44
GENERAL CONCLUSION AND OUTLOOK 45
ix
List of figures
1.1
|
Structure of the covid 19 virus [8]
|
4
|
1.2
|
Zoonotic cycle emergence of Coronaviruses
|
7
|
1.3
|
respiratory droplets given off when a person sneezes [9].
|
8
|
1.4
|
Evolution of the virus in the respiratory tract [9].
|
9
|
1.5
|
nasal swab [10]
|
9
|
1.6
|
saliva sample [10].
|
10
|
1.7
|
Course of virus infection.
10
|
|
1.8
|
Prevention.
11
|
|
1.9
|
Treatment[11].
12
|
|
2.1
|
Compartmental structure of the model.
16
|
|
3.1
|
Model adapted to the new cumulative cases of COVID-19 reported
for
|
|
|
the period 01 January 2020 to 10 April 2021
|
28
|
3.2
|
Histogram of the sensitivity analysis between Rc and
each parameter . . .
|
30
|
3.3
|
Evolution of quarantine rate of undetected contagious over a
period of
|
|
|
180 days for different values ( á = 0.02, á =
0.04, á = 0.1 ).
|
32
|
3.4
|
Evolution of quarantine rate of undetected contagious over a
period of
|
|
|
180 days for different values ( á = 0.02, á =
0.04, á = 0.1 ).
|
33
|
3.5
|
Evolution of Fraction of exposures that become infectious
undetected
|
|
|
over a period of 180 days for different values ( p = 0.95, p =
0.65, p = 0.25 ).
|
34
|
3.6
|
Evolution of Fraction of exposures that become infectious
undetected
|
|
|
over a period of 180 days for different values ( p = 0.95, p =
0.65, p = 0.25 ).
|
35
|
|
LIST OF FIGURES X
Master's thesis II * Molecular Atomic Physics and
Biophysics Laboratory-UYI * YAMENI STEINLEN DONAT D
(c)2021
3.7 Evolution of the quarantine rate of contagious diseases
detected over a
period of 180 days for different values ( E = 0.09, E = 0.02,
E = 0.1 ). 36
3.8 Evolution of the quarantine rate of contagious diseases
detected over a
period of 180 days for different values ( E = 0.09, E = 0.02,
E = 0.1 ). 37
3.9 Evolution of social distancing and face mask use over a
180-day period
for different values ( = 0, = 0; = 0, = 0.2; = 0, = 0.3 ).
38
3.10 Evolution of social distancing and face mask use over a 180-day
period
for different values ( = 0, = 0; = 0, = 0.2; = 0, = 0.3 ).
39
3.11 Evolution of social distancing and face mask use over a period of
180 days
for different values ( = 0, = 0.2; = 0.1, = 0.3; = 0.2, = 0.5
) 40
3.12 Evolution of social distancing and face mask use over a 180-day
period
for different values ( = 0, = 0.2; = 0.1, = 0.3; = 0.2, = 0.5
) 41
3.13 Evolution of social distancing and face mask use over a 180-day
period
for different values ( = 0.2, = 0; = 0.3, = 0.2; = 0.5, = 0.3
) 42
3.14 Evolution of social distancing and face mask use over a 180-day
period
for different values ( = 0.2, = 0; = 0.3, = 0.2; = 0.5, = 0.3
) 43
xi
List of Tables
1.1 Lethality 15
2.1 Representation of model parameters. 17

Abstract
The world is currently under threat from the coronavirus
disease pandemic (COVID-19) caused by the SARS-CoV-2 virus. A very virulent
virus that has made COVID-19 a fatal disease, which targets the human
respiratory system. Newly identified from Wuhan,(China) this disease received
worldwide attention as early as december 2019. The world now registers more
than 218 million cases and Cameroon registers more than 84,000 infected cases.
In epidemiology, mathematical models are used to better understand the dynamics
of infectious diseases. In this work, we built a mathematical model of the
dynamics of disease transmission taking into account social distancing and
wearing face mask. The said model takes the form of a system of ordinary
differential equations. We examine the impact of these two measures on the
dynamics of COVID-19 in Yaoundé and Douala (Cameroon). We use the
available data, we seek to develop a predictive tool for the cumulative number
of reported disease cases. Using Lyapunov functions, we calculate the basic
reproduction number of the virus. Our theoretical results are confirmed by
mumerical simulations of the model. It is shown that if at least 50 % of the
population complies with the regulation of these various non-pharmaceutical
measures, the disease will eventually disappear in the population.
Keywords: COVID-19, SARS-CoV2, Lyapunov function,
social distancing, face mask.
xiii
Résumé
Le monde est actuellement sous la menace de la pandemie de
maladie à coronavirus (COVID-19) causée par le virus SARS-CoV2.
Ce virus très virulent qui a fait de la COVID-19 une maladie mortelle,
qui cible le système respiratoire humain. Nouvellement identifiée
en provenance de Wuhan, en Chine cette maladie a fait l'objet d'une attention
mondiale dès Décembre 2019. Le monde enregistre de nos jours plus
de 219 millions de cas infectés et le Cameroun quant à lui
enregistre plus de 94 000 cas. En épidémiologie, les
modèles mathématiques sont utilisés afin de mieux
comprendre la dynamique des maladies infectieuses. Dans ce travail, nous
construisons un modèle mathématique de dynamique de transmission
de la maladie avec distanciation sociale et port de masque facial. Le
modèle se présente sous la forme d'un système
d'équations différentielles ordinaires. Nous examinons l'impact
de ces deux mesures sur la dynamique de la COVID-19 à Yaoundé et
Douala au Cameroun. En utilisant les données disponibles, nous
développons un outil prédictif pour le nombre cumulé de
cas des maladies signalés. Grâce aux fonctions de Lyapunov, nous
calculons le nombre de reproduction de base du virus. À l'aide des
simulations numériques du modèle, nous montrons que si au moins
50% de la population se conforme à la réglementation de ces
diverses mesures non pharmaceutiques, la maladie finira par disparaître
dans la population.
Mots clés : COVID-19,
SARS-CoV2, fonction de Lyapunov, distanciation sociale, masque
facial.
1
GENERAL INTRODUCTION
Departing from China to Wuhan on December 31, 2019 [1, 2],
the coronavirus epidemic quickly spread around the world. After three months of
the pandemic, 185 countries were affected [3]. As of April 12, 2020, the world
had recorded 1.9 million confirmed cases. Cameroon is one of the most affected
countries in Africa, with nearly 82,064 confirmed cases as of August 31,
2021[4]. COVID-19 is a highly contagious disease, and the strain is the
SARS-CoV-2 . Coronaviruses are a family of viruses, some of
which can infect humans, most often causing mild cold-like symptoms. However,
three deadly epidemics have already occurred in the 21 st century, including
the current one. They involve emerging coronaviruses harbored by animals and
suddenly transmitted to humans: SARS-CoV and MERS-CoV. When
the epidemic linked to the coronavirus SARS-CoV-2 spread
around the world, research is mobilized to accelerate the production of
knowledge on this virus, on the disease it causes (COVID-19 ) as well as how to
cure and prevent it. Our interest in this mysterious disease will thus be
heightened. We need to learn more about this disease in order to assess the
real threat it represents. We will then observe the evolution of the disease
after having introduced the parameters of social distancing and wearing of a
face mask in a mathematical model built on the basis of the dynamics of
transmission of the disease proposed very recently by Nkamba et al [5]. This
model takes the form of a system of nonlinear ODEs.
The novelty of this study lies in the theoretical proof of
the existence of endemic equilibrium and specific predictions for the city of
Yaoundé and Douala in Cameroon. This is why to claim a certain
exhaustiveness, the work will revolve around three main chapter :
· The chapter I will be devoted the generalities of
COVID-19, we present the history on the coronavirus, the origin of SARS-CoV-2,
the symptoms of COVID-19, its mode transmission, course of virus infection,
diagnosis of COVID-19, means of prevention and treatment.
· In chapter II, we present the mathematical model on
which we calculate the basic reproduction
LIST OF TABLES 2
Master's thesis II * Molecular Atomic Physics and
Biophysics Laboratory-UYI * YAMENI STEINLEN DONAT D
(c)2021
number Rc,we also investigate asymptotic
stability of the disease-free equilibrium.
· The chapter III will be devoted to the numerical
results obtained within the framework of this work while discussing on their
biological implications.
We will end our work with a general conclusion in which we
will summarize our work and open some perspectives.
CHAPTER I
GENERAL INFORMATION ON
COVID-19
3
1.1 Introduction
An outbreak of pneumonia cases of unknown origin erupted in
the city of Wuhan in China at the end of December 2019. Chinese health
authorities quickly notified the World Health Organization (WHO). The pathogen
in question is identified at the beginning of the month of January 2020 as
being the new Coronavirus called SARS-CoV- 2. Indeed, the Coronavirus is a
large family of pathogenic viruses that can cause simple illnesses such as the
common cold but also serious illnesses such as Severe Acute Respiratory
Syndrome (SARS-CoV), Middle East Respiratory Syndrome (MERS-CoV), and the most
recent, Coronavirus disease (COVID-19). The latter very quickly became a global
pandemic, having already caused more than a million deaths worldwide [6]. In
this chapter, it is a question for us of approaching the generalities on the
disease with Coron-avirus in this case its history, origin, its symptoms, the
mode of transmission, course of its infection, causes, consequences, treatment
and prevention in order to limit the spread of Coronavirus disease.
1.2 History of the coronavirus
Coronaviruses (Cov) form a huge family of viruses with an
extremely long RNA genome (several thousand nucleotides).
There are many subtypes of coronavirus that infect different
animal species. Man can host at least five, of which the most common are
HCoV-229 and HCoV-OC43 [7]. Very common,
these viruses are associated with colds and mild flu-like symptoms. It can also
infect humans without
1.2. HISTORY OF THE CORONAVIRUS 4
Master's thesis II * Molecular Atomic Physics and
Biophysics Laboratory-UYI * YAMENI STEINLEN DONAT D
(c)2021
triggering symptoms or, conversely, be involved in respiratory
complications such as pneumonia in immunocompromised people or infants.
This virus is easily transmitted from man to man by air, in
contact with secretions or that of contaminated objects, particularly in
winter. The incubation period preceding the onset of symptoms lasts 03 to 06
days and the treatments, if necessary, are symptomatic (treatment of fever,
possible pain). However, coronavirus infections are usually not diagnostic due
to their mild nature and spontaneous recovery.
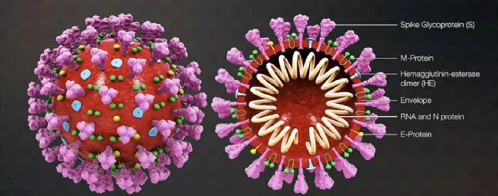
Figure 1.1: Structure of the covid 19 virus
[8].
1.2.1 The Severe Acute Respiratory Syndrome Coronavirus
Outbreak (SARS-CoV)
SARS-CoV is the first Coronavirus to cause serious illness in
humans. It was rampant in epidemic form between November 2002 and July 2003.
More than 8, 000 cases have been identified in 30 countries and 774 people have
died. The epidemic started with a few cases in Guangdong province, southeast
China, following the consumption of infected civets. These cases then triggered
a chain of human-to-human transmission. Several cases occurred in different
cities around Guangzhou, then the virus was introduced in Hong Kong in February
2003. It then spread to Vietnam, Singapore, Canada, the Philippines, the United
Kingdom or the United States following the movement of infected people. It has
been possible to establish a link between more than half of the infections and
a single patient who arrived in Hong Kong on 21 February 2003 [7]. The
1.2. HISTORY OF THE CORONAVIRUS 5
Master's thesis II *
Molecular Atomic Physics and Biophysics Laboratory-UYI
* YAMENI STEINLEN DONAT D
(c)2021
epidemic was controlled thanks to a global alert triggered on
March 12, 2003 by the World Health Organization, the cessation of consumption
of civets in China, the early warning of suspected cases, the isolation of
patients from the start. First symptoms, the care of people with whom they had
been in contact and the protection of caregivers.
1.2.2 The Middle East Respiratory Syndrome
Coronavirus Outbreak ( MERS-CoV)
The first case of infection dates back to 2012, in Saudi
Arabia when a 60-year-old man died of progressive respiratory and kidney
failure eleven days after being admitted to hospital. The patient had a history
of fever, cough, and respiratory failure for seven days. In September of the
same year, the case of a 49-year-old man from Qatar was reported in a hospital
in London. He presented with pneumonia and renal failure, a new series of
samples taken from the same patient revealed a positive MERS-CoV infection. In
retrospect, the infection was found in a respiratory sample from a Near Eastern
country, Jordan, where in April 2012 a respiratory epidemic occurred in a
public hospital. This shows at leisure how the virus can spread with a certain
ease, passing from one country to another [6, 7]. Human-to-human transmission
occurs by air, via airborne droplets without air. But the virus is weakly
transmissible. Nevertheless, a patient in South Korea is at the origin of 154
contaminations. The World Health Organization is actively monitoring the spread
of the virus and identifying new cases in order to regularly update the list of
affected countries. At present, no specific treatment or vaccine is available
against this virus which strikes more people who are immunocompromised or
suffering from chronic pathologies (diabetes, renal failure, chronic pulmonary
infection, etc...).
1.2.3 The Coronavirus disease pandemic (COV
ID - 19)
The SARS-CoV-2 belongs to the family of coronaviruses (CoV),
name linked to the "crown" formed by certain proteins on the surface of these
viruses. It was first identified in Wuhan, China, in Dec 2019 Several
coronaviruses are already known to be able to infect humans: three seasonal
coronaviruses responsible for mild winter symptoms (colds), SARS-CoV
responsible for the syndrome severe acute respiratory (SARS) and MERS-CoV
responsible for potentially severe respiratory damage (Midale East Respiratory
syndrome). SARS-CoV-2 is the seventh human pathogenic coronavirus. It is
responsible for the disease Covid-19 (Coronavirus Disease 2019) SARS -CoV-2
1.3. ORIGIN OF SARS-COV-2 6
Master's thesis II * Molecular Atomic Physics and
Biophysics Laboratory-UYI * YAMENI STEINLEN DONAT D
(c)2021
is a virus with RNA envelope whose genome (30 kilobases) codes
for 15 genes therefore 04 corresponding to structural proteins: one surface
protein (spike or S protein), a membrane protein (M), an envelope protein (E)
and a core protein (N) this genome has 79% homology with SARS-CoV and 52%
homology with MERS-CoV. The coronavirus to which it is phylogenetically closest
is Ra TG13-CoV, a coronavirus that infects bats (96% homology)
[7].
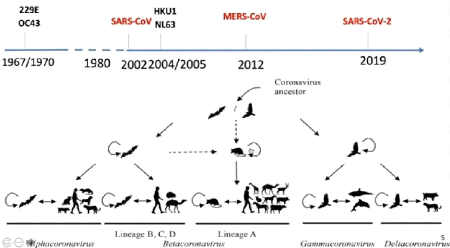
1.3 Origin of SARS-CoV-2
The origin of SARS-CoV-2 is not fully understood.
Particularly common in some animals, the coronavirus only occasionally crosses
the species barrier to infect humans. There are exceptions, however, such as
SARS-CoV which was accidentally transmitted to humans through consumption of
masked civets and MERS-Cov through camels. SARS-CoV-2 is genetically closer to
viruses that infect bats than MERS-CoV or SARS-CoV.
But, so far no direct viral transmission has been described
between this species and humans. This is why researchers believe it is likely
that transmission to humans has occurred through an intermediate host species
[7]. The pangolin was initially identified as a carrier of a coronavirus
similar to SARS-CoV-2, however several elements leave this possibility
doubtful, particularly because the genetic sequences of the virus responsible
for the current epidemic and that of the coronavirus which infects the pangolin
conserved significant differences. Two hypotheses remain:
· The virus would have been transmitted from bats to
humans via an animal species not yet identified.
· The virus is believed to have circulated in humans for
several years, quietly until a recent mutation made it more virulent and
pathogenic.
1.4. SYMPTOMS OF COVID-19 7
Master's thesis II * Molecular Atomic Physics and
Biophysics Laboratory-UYI * YAMENI STEINLEN DONAT D
(c)2021
Figure 1.2: Zoonotic cycle emergence of
Coronaviruses.
1.4 symptoms of COVID-19
People infected with COVID-19 may have very mild or no symptoms
or, on the contrary, a
serious illness or death. Most infections are usually mild and
their symptoms gradually appear 2
to 14 days after exposure to COVID-19. Among the most common
symptoms are
* A dry cough,
* Fever,
* Fatigue,
and among the other existing symptoms:
V Pain,
V The runny nose,
V Sore throat.
However, some people develop serious breathing problems, heart
rhythm disturbances, heart
damage and shock as a result of the infection. The risk of dying
from COVID-19 is higher for some
populations, including adults aged 65 and over (risk increases
with age), people with underlying
chronic diseases (especially heart disease , diabetes and lung
disease) and people with weakened
immune systems.
1.5. TRANSMISSION MODE 8
Master's thesis II * Molecular Atomic Physics and
Biophysics Laboratory-UYI * YAMENI STEINLEN DONAT D
(c)2021
1.6. DIAGNOSIS OF COVID-19 9
Master's thesis II * Molecular Atomic Physics and
Biophysics Laboratory-UYI * YAMENI STEINLEN DONAT D
(c)2021
1.7. COURSE OF VIRUS INFECTION 10
Master's thesis II * Molecular Atomic Physics and
Biophysics Laboratory-UYI * YAMENI STEINLEN DONAT D
(c)2021
1.8. PREVENTION AND TREATMENT 11
1.9. CAUSES OF COVID-19 12
Master's thesis II * Molecular Atomic Physics and
Biophysics Laboratory-UYI * YAMENI STEINLEN DONAT D
(c)2021
1.5 Transmission mode
SARS-CoV-2 is transmitted from an infected person to an
uninfected person by two main routes:
V Direct contact with the infected person or a
surface they have contaminated
V Aerial (or airborne) transmission of the virus via
droplets or aerosol emitted by the infected person.
Droplets (1 mum) are emitted from our
mouth and nose when we speak, shout, sing, cough or sneeze. Aerosols are
suspensions of smaller particles (a few nanometers at 100
mum), like the vapor produced by our breathing in cold
weather. There is in reality a continuum between droplets and aerosol which in
practice renders the distinction between these two modes of vectorization of
the [7] virus artificial. Concretely, in the absence of a mask, an infected
person emits droplets loaded with viruses, the most serious of which on
surfaces in the immediate vicinity. A healthy person can then become infected
by touching the contaminated area with their hands and then bringing them to
their mouth, nose or eyes. The virus can persist for several hours on a
contaminated inert surface. The duration of the surface, the surrounding
temperature, humidity and light conditions. But that's not all: the smaller the
diameter of the droplets emitted by the infected person, the more these
droplets can be carried away by the ambient air and remain in suspension there.
The virus can thus accumulate in the indoor air of a poorly ventilated room and
lead to its airborne transmission.

Figure 1.3: respiratory droplets given off when a
person sneezes [9].
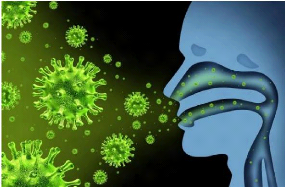
Figure 1.4: Evolution of the virus in the respiratory
tract [9].
1.6 Diagnosis of COVID-19
If you have symptoms of COVID-19 infection, see a doctor.
Your health care provider will ask you to describe your symptoms, your travel
history, and whether you may have been in contact with someone with COVID-19.
Coronavirus infections are diagnosed by a health care provider based on
symptoms and are confirmed by a lab test. The test is usually done through a
nasal swab or a throat swab.
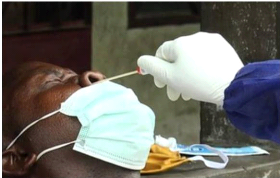
Figure 1.5: nasal swab [10].
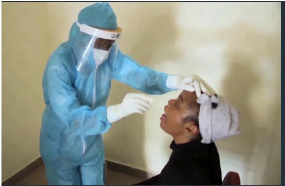
Figure 1.6: saliva sample [10].
1.7 Course of virus infection
The virus enters the body through the airways, from the nose
and mouth. Part of its surface protein (the RBD region of S protein);
binds to the ACE-2 receptor expressed on the surface
of cells that line our airways. Another cellular protein (TMPRSS2) then allows
the virus to enter the cell. Once inside, it uses the host's cellular machinery
to multiply there. New virions are formed and will infect new cells.
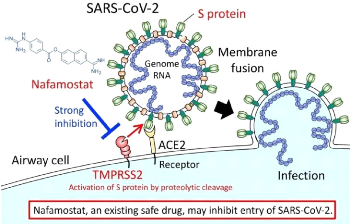
Figure 1.7: Course of virus infection.
Master's thesis II * Molecular Atomic Physics and
Biophysics Laboratory-UYI * YAMENI STEINLEN DONAT D
(c)2021
1.8 Prevention and Treatment
Most people with a mild form of the disease will recover
without treatment. However, your health care provider may recommend certain
medications or therapies that are available to provide comfort and relieve
symptoms of COVID-19. Drug treatments to treat COVID-19 are currently under
development and testing. On July 27, 2020, Health Canada approved remdesivir
(Veklury) to treat severe symptoms of COVI-19 in adults and adolescents 12
years of age and older, who weigh at least 40 kg[11].
Since COVID-19 is primarily transmitted from person to
person, practicing good hand hygiene is one of the most important things you
can do to avoid getting infected. Whenever possible, wear a non-medical face
mask as the virus can remain in the air, Maintain physical distances of at
least one meter from a third party. Avoid touching your eyes, nose and mouth
with dirty hands. You should try to minimize your risk of exposure to the virus
by avoiding contact with sick people. If you are sick, you should cover your
nose and mouth when you sneeze or cough. The first COVID-19 vaccines hit the
market barely a year after the discovery of the Coronavirus SARS-CoV-2 causing
the pandemic. Cameroon received 200,000 doses of the SINOPHARM vaccine on April
11, 2021, and the first vaccinations were done the following day. On April 17,
2021, it is around the ASTRAZENECA vaccine to set foot on the soil of
Cameroonian territory.
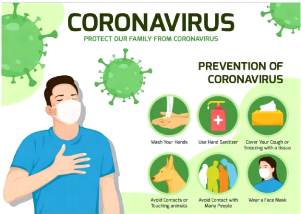
Figure 1.8: Prevention.
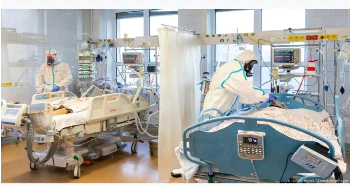
Figure 1.9: Treatment[11].
1.9 Causes of COVID-19
The virus that causes COVID-19 is officially known as
SARS-CoV-2 (Severe Acute Respiratory Syndrome). It belongs to a larger family
of viruses called the coronavirus. Although coronaviruses can affect both
animals and humans, only human coronaviruses are known to cause respiratory
infections. These infections can be mild illnesses like the common cold but
also serious illnesses like Severe Acute Respiratory Syndrome (SARS) and Middle
East Respiratory Syndrome (MERS) [11].
The spread of COVID-19 is not completely clear, but
investigations have found that the outbreak may have started in an animal
market. COVID-19 may not be spread from person to person through respiratory
droplets. You can also come into contact with the virus through aerosols
(droplets small enough to float in the air) if an infected person coughs or
sneezes near you. These aerosols remain in the air for long periods of time.
You can also get the virus by touching your eyes, nose or mouth. The following
people are at high risk of exposure:
· People who live in areas of high COVID-19
transmission,
· People in close contact with people with COVID-19,
· Healthcare workers caring for patients with COVID-19,
· People who do not follow public health measures (for
example, wearing a mask, washing their hands),
·
1.10. CONSEQUENCES ON COVID-19 13
Master's thesis II *
Molecular Atomic Physics and Biophysics Laboratory-UYI
* YAMENI STEINLEN DONAT D
(c)2021
Travelers returning from affected international locations
(including cruise ships, conferences).
1.10 Consequences on COVID-19
* Educational consequences: the
measures taken to close schools in many countries have particularly serious
consequences for children from disadvantaged backgrounds. Confinement and
school two days out of four, alternately face-to-face and remote (May to August
in Cameroon), broke the relationship between teachers and students and caused a
digital divide among students in schools, colleges, and others. high schools
and universities with no computer or not enough performance or having too bad
connection or limited connection with small envelope of data. Cameroon's
obligation to wear a mask in class has "alarming effects". As well as parents'
groups, denounce the damage caused by the obligation for children (6 - 10 years
old) to wear a mask at school, from September 2020. Due to the closure of
universities, the evil -Being students, confined in small accommodation, forced
to take remote courses, without odd jobs or social ties, is worrying.
* Consequence on the economy:
Perceptible effects of the coronavirus pandemic on the lifestyle of the
population have a negative impact on the standard of living of the Cameroonian
population, according to a recent assessment by the National Institute of
statistics (INS). The decrease in activity, 65% of people the decrease in
salary / income. «On another level, the pandemic has led to the
deterioration of the standard of living of 60%of people. This degradation is
more accentuated among the very poor. To cope with the effects of the pandemic,
indicates the INS, the vast majority of companies have had to resort to the
reduction of working hours (62%), to the technical layoff of certain employees
(44%) and wage cuts (44 %) [12].
* Sports consequences: Many sports
competitions are suspended or canceled due to the pandemic. In athletics, the
indoor world championships scheduled for March 2020 in Nanjing are postponed to
March 2021.
1.11 Some types of viruses
HCoV-229E is one of seven human coronaviruses which include:
[13]
? HCoV-229E is known to infect humans, an NCBI study found
previous infection with HCoV-229E in 42.9% to 50.0% of children 6 to 12 months
and 65% of those 2.5 to 3.5 years old.
1.12. LETHALITY 14
Master's thesis II * Molecular Atomic Physics and
Biophysics Laboratory-UYI * YAMENI STEINLEN DONAT D
(c)2021
> The human coronavirus NL65 (HCoV-NL63)
is a species of coronavirus. It was identified in 2004 in a seven
month old child with bronchiolitis in the Netherlands.
> The human coronavirus OC43 (HCoV-OC43),
which infects humans and cattle, is one of the viruses that cause the
common cold.
> Human coronavirus HKU1 (HCoV-HKU1) is a species of
coronavirus in humans, it causes upper respiratory tract disease with symptoms
of colds, but can progress to pneumonia and bron-chiolitis , first discovered
in January 2004 by a man in Hong Kong.
> The Middle East Respiratory Syndrome Coronavirus
(MERS-CoV) or EMC / 12 (HCoV-EMC / 12) is a
virus that causes Middle East Respiratory Syndrome (MERS), it is a species of
coronavirus that infects humans, bats and camels.
> Severe acute respiratory syndrome coronavirus
(SARS-CoV or SARS-CoV-1) is a strain of coronavirus that
causes severe acute respiratory syndrome (SARS) discovered in April 2003 in
Asia.
> Severe Acute Respiratory Syndrome Coronavirus 2
(SARS-CoV-2) is the virus that causes COVID-19 (2019
coronavirus disease), the respiratory disease responsible for the COVID-19
pandemic , discovered in Asia.
1.12 Lethality
Lethality is the percentage of the death toll among confirmed
virus cases. The first fatality assessment was released on 14 February by the
Chinese Center for Disease Control and Prevention (Chinese CDC), among the
first 44, 672 confirmed cases it was then estimated at (2.3%) .
Lethality varies according to the conditions in which patients
are treated and their access to hospital services. It is different from one
country to another. Globally the WHO has estimated it to be around 3.4 % (the 3
March 2020).
With the increase in cases of the disease worldwide, WHO
estimates the percentage of death rate from COVID- 19 to 2.2% as of 17 December
2020.
If it seemed spared for a long time or almost, the African
continent is now affected like the rest of the world, even if the number of
cases remains limited. The first case of COVID- 19 in Africa appeared in
February 2020 in Egypt. A sudden increase in the number of cases is observed in
July
1.13. CONCLUSION 15
Master's thesis II * Molecular Atomic Physics and
Biophysics Laboratory-UYI * YAMENI STEINLEN DONAT D
(c)2021
and August, then the contaminations slowed down again. The
following table presents the results of the pandemic in some African countries
during the period of August 31, 2021 [14, 15].
.
|
Countries
|
N.Cas
|
healing Cas
|
N.death
|
Lethality%
|
|
Soudan
|
37699
|
3163
|
2831
|
6.2
|
|
Egypte
|
288162
|
238580
|
16727
|
5.5
|
|
Liberia
|
5459
|
2715
|
148
|
4.4
|
|
Cameroon
|
82064
|
80433
|
1354
|
1.7
|
Table 1.1: Lethality.
1.13 Conclusion
In this chapter, we were talking about generalities about the
Coronavirus disease. COVID-19 is a newly identified highly infectious disease
originating in Wuhan, China, December 2019, which quickly spread like wildfire
causing death and devastation around the world. In order to limit the spread of
the pandemic, the States will organize the response. The need therefore arises
in the next chapter to build a compartmental model to predict the possible
scenarios of transmission and spread of the disease.
CHAPTER II
MATHEMATICAL MODEL AND
METHODS OF INVESTIGATIONS
2.1 INTRODUCTION
Infectious disease models are increasingly used to predict a
range of future possibilities to aid and support knowledge development and
decision making at the scientific, medical and health levels.
In this chapter, we present the actual calculation of the
reproduction rate with control measures Rc, which is an
important quantity to characterize epidemic diseases, through the stability
analysis.
2.2 Formulation of the model
The fundamental tool in the study of COVID-19 dynamics is the
mathematical model in that it allows for a better understanding of the impacts
of various non-pharmaceutical control measures (governmental and personal) on
the population dynamics of the new COVID-19 disease.
16
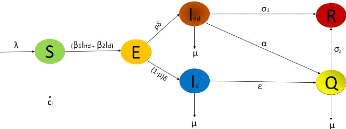
Figure 2.1: Compartmental structure of the
model.
2.2. FORMULATION OF THE MODEL 17
Master's thesis II * Molecular Atomic Physics and Biophysics
Laboratory-UYI * YAMENI STEINLEN DONAT D
(c)2021
|
À
|
Recruitment of sensitive individuals
|
|
/31
|
Transmission rate of undetected infected
|
|
/32
|
Transmission rate of detected infected
|
|
cf
|
Containment rate of sensitive individuals
|
|
ä
|
Incubation rate
|
|
p
|
Fraction of exposures that become infected undetected
|
|
u
|
Disease-induced mortality rate
|
|
€
|
Quarantine rate of detected infectious
|
|
a
|
Quarantine rate of undetected infectious
|
|
a1
|
Recovery rate of undetected infectious
|
|
a2
|
Recovery rate of quarantined individuals
|
|
O
|
Represents the fraction of the total population that uses a face
mask
|
|
ø
|
proportion of the population that maintains the minimum distance
required to prevent infection
|
Table 2.1: Representation of model
parameters.
A model is a tool that allows to give a simple representation of
a phenomenon.
The total human population at time (t), denoted Nh(t)
is divided into a mutually exclusive subgroup of susceptible individuals
S(t), exposed individuals E(t), undetected infectious individuals
Ind(t), detected infectious individuals Id(t),
quarantined individuals Q(t), recovered individuals R(t).
Nh(t) is given by
Nh(t) = S(t) + E(t) + Ind(t) + Id(t) + Q(t) +
R(t).
The model of the transmission dynamics of COVID-19 in a
population is given by the following
2.2. FORMULATION OF THE MODEL 18
Master's thesis II * Molecular Atomic Physics and Biophysics
Laboratory-UYI * YAMENI STEINLEN DONAT D (c)2021
system of deterministic nonlinear differential equations in (2-1)
built by Nkamba et al [5],
???????????????? ?
?
????????????????? Sÿ= ë -
(â1Ind + â2Id)S -
CfS,
Eÿ = (â1Ind +
â2Id)S - äE, ÿInd
= päE - (ó1 + á +
u)Ind, ÿId = (1 -
p)äE - (å + u)Id, Qÿ = åId
+ áInd - (ó2 + u)Q,
Rÿ = ó1Ind + ó2Q.
(2.1)
with the table describing the state associated variables and
parameters in the model(2-1) while figure (2-1) gives the schematic diagram of
the model(2-1).
Mathematical models without demographic parameters (i.e. birth
and natural death) in equations (2-1) have been widely used to study the
dynamics of epidemics [16, 17, 19]. Demographic parameters, including natural
births and deaths, can be excluded when dynamically exchanging an epidemic that
occurs within weeks or months [18, 19, 20, 21, 22]. If we introduce parameters
used by Okuonghae and Omame [23], that
represent social distancing and use of face masks of infection from the basic
model (2-1), in which a new parameter ø represents the proportion of the
population that maintains the minimum distance required to prevent infection
(at least 1 meter apart), and another parameter è represents the
fraction of the population that use face masks (where it is assumed that face
masks are effectively high whenever they are in public, so that 0 <
è < 1), the basic model (2-1) now becomes.
|
?
???????????????? ?
?????????????????
|
Sÿ= ë - (1 - è)(1
- ø)(â1Ind +
â2Id)S - CfS, Eÿ= (1
- è)(1 - ø)(â1Ind +
â2Id)S - äE,
ÿInd = päE -
(ó1 + á + u)Ind,
(2.2)
ÿId = (1 - p)äE -
(å + u)Id,
Qÿ = åId + áInd -
(ó2 + u)Q, Rÿ= ó1Ind
+ ó2Q.
|
It is imperative to specify that in the framework envisaged in
this work, the strict adoption of the use of face masks has been encouraged
well into the current outbreaks in Cameroon, particularly
2.3. BASIC PROPERTIES OF THE MODEL 19
in the city of Yaounde and Douala.
2.3 Basic properties of the model
Let be:
S(0), E(0),
Ind(0), Id(0), Q(0),
R(0),
the initial data.
The solutions (S, E, Ind,
Id, Q, R) of the model (2.2), when they
exist, are positive for all t > 0. à t = 0,
N(0) = N0 and
dS dt
= ë - (1 - ø)(1 -
è)(â1Ind +
â2Id)S - cfS, d
dt[S(t)ñ(t)] =
ëñ(t).
From where
t
ñ(t) = exp( f [(1 -
ø)(1 -
è)(â1Ind(s)
+ â2Id(s)) + cf]ds)
> 0
0
is the integration factor. Hence, integrating this last relation
with respect to t, we have
t
S(t)ñ(t) - S(0)
= f ëñ(s)ds,
0
So that the division of both side by ñ(t)
yield. The solution is given by:
t
S(t) = [S(0) + f
ëñ(s)ds]ñ-1(t)
> 0. (2.3)
0
A similar procedure is used to prove that
E(t) > 0 and
Ind(t), Id(t),
Q(t), R(t) > 0 for all t >
0.
N(t) = S(t) +
E(t) + Ind(t) +
Id(t) + Q(t) +
R(t),
|
dN(t) dt
|
=
|
dS(t) + dt
|
dE(t) + dt
|
dInd(t) + dt
|
dId(t) + dt
|
dJ(t) + dt
|
dR(t) dt
|
. (2.4)
|
Master's thesis II * Molecular Atomic Physics and Biophysics
Laboratory-UYI * YAMENI STEINLEN DONAT D
(c)2021
Replacing each derivative with its value in the right-hand member
gives :
|
dN(t) dt
|
= ë - cfS - uInd -
uId - uQ
|
Master's thesis II ? Molecular Atomic Physics and
Biophysics Laboratory-UYI ? YAMENI STEINLEN DONAT D
(c)2021
2.4. LOCAL ASYMPTOTIC STABILITY OF DISEASE-FREE EQUILIBRIUM (DFE)
OF THE MODEL (2-2) 20
dN(t) = À - d0N, dt
where
d0 = min(cf, ii).
|
That implies that
|
lim
t--+-oo
|
À
supN(t) = . (2.5)
do
|
2.4 Local asymptotic stability of disease-free
equilibrium (DFE) of the model (2-2)
The COVID-19 model (2-2) has a DFE, obtained by setting the
rights of the equations in model (2-2) to zero, given by
N(t) = 8(t) + E(t) + Ind(t) +
Id(t) + Q(t) + R(t).
For t = 0, we have
N(0) = 8(0) + E(0) + Ind(0) + Id(0) +
Q(0) + R(0)
î0 = (8*,E*,I* nd,I*
d,Q*,R*) = (8(0),0,0,0,0,0) (2.6)
Where 8(0) = cf ë
2.4.1 Basic reproduction number
fi is the rate of new infections in the compartment,
F is the matrix of new infections. We will then restrict this system
to the infected populations (E, Ind, Id, Q). When we
evaluate the partial derivatives of (E, Ind, Id, Q)
we obtain the matrix [F] next:
2.4. LOCAL ASYMPTOTIC STABILITY OF DISEASE-FREE EQUILIBRIUM (DFE)
OF THE MODEL (2-2) 21
?
? ? ? ? ? ? ?
fi =
,
?
? ? ? ? ? ? ?
(1 - è)(1 -
ø)(â1Ind +
â2Id)S
0
0
0
?
? ? ? ? ? ? ?
F=
afi(c0) aE
afj(c0) aE
afk(c0) aE
afm(c0) aE
afi(c0) aInd
afj(c0) aInd
afk(c0) aInd
afm(c0) aInd
afi(c0) aId
afj(c0) aId
afk(c0) aId
afm(c0) aId
1 ,
afi(c0) aQ
afj(c0) aQ
afk(c0) aQ
afm(c0) aQ
1 .
Master's thesis II * Molecular Atomic Physics and Biophysics
Laboratory-UYI * YAMENI STEINLEN DONAT D (c)2021
?
0 (1 - è)(1 -
ø)(â1)S(0) (1 - è)(1 -
ø)â2S(0) 0
? ? ?0 0 0 0
F = ? ? ?
0
?0 0 0
0 0 0 0
Now let's look for the matrix of
individuals between compartments. V - is the rate of transfer of individuals
out of the compartment V + is the rate of transfer of individuals into
the compartment by all other means
Vi = V - - V +,
where
|
V - =
|
?
? ? ? ? ? ? ?
|
äE
(ó1 + á +
u)Ind
(å +
u)Id
(ó2 + u)Q
|
1
|
, V + =
|
?0
? ? ?päE
? ? ? ?(1 - p)äE åId
+ áInd
|
1
|
, Vi=
|
?
? ? ? ? ? ? ?
|
äE
(ó1 + á +
u)Ind - PäE (å +
u)Id - (1 - p)äE
(ó2 + u)Q - åId
- áInd
|
1
|
.
|
Master's thesis II ? Molecular Atomic Physics and
Biophysics Laboratory-UYI ? YAMENI STEINLEN DONAT D
(c)2021
2.4. LOCAL ASYMPTOTIC STABILITY OF DISEASE-FREE EQUILIBRIUM (DFE)
OF THE MODEL (2-2) 22
|
V =
|
?
? ? ? ? ? ? ?
|
?Vi ?E
?Vj ?E
?Vk ?E
?Vm ?E
|
?Vi ?Ind ?Vj
?Ind
?Vk ?Ind
?Vm ?Ind
|
?Vi ?Id ?Vj
?Id
?Vk ?Id
?Vm ?Id
|
?Vi ?Q
?Vj ?Q
?Vk ?Q
?Vm ?Q
|
?
? ? ? ? ? ? ?
|
,V =
|
?
? ? ? ? ? ? ?
|
ä 0 0 0
-pä ó1 + á + u 0 0
-(1 - p)ä 0 ? + u 0
0 -á -? ó2 + u
|
?
? ? ? ? ? ? ?
|
The matrix FV -1 called next generation matrix is
given by
|
FV -1 =
|
?
? ? ? ? ? ? ?
|
ëâ1(1-è)(1-ø)p +
ëâ2(1-è)(1-ø)(1-p)
ëâ1(1-è)(1-ø)
ëâ2(1-è)(1-ø) 0
cf (ó1+á+u) cf (?+u) cf
(?+á+u) cf (?+u)
0 0 0 0
0 0 0 0
0 0 0 0
|
1
|
.
|
Let's find the eigenvalues of the matrix FV -1, we
calculate the determinant det(ëI4 - F V -1),
|
det(ëI4 - FV -1) =
|
?
? ? ? ? ? ? ?
|
ë- X1 X2 X3 0 0 ë 0 0
0 0 ë 0
0 0 0 ë
|
1
|
.
|
where
|
{
|
X1 = ëâ1(1-è)(1-ø)p
cf (ó1+á+u) +
ëâ2(1-è)(1-ø)(1-p) ,
cf
(?+u)
X2 = ëâ1(1-è)(1-ø)
cf (?+á+u) ,
X3 = ëâ2(1-è)(1-ø)
cf (?+u) .
|
(2.7)
|
The eigenvalues are obtained by calculating det(ëI4 - FV -1)
= 0. We obtain the following characteristic equation:
ë(ë2(ë - X1)) = 0.
The maximum eigenvalue of this matrix is Rc. Thus, it
follows from [24] that the basic reproduction number of the model(2-2), noted
Rc is given by
Master's thesis II * Molecular Atomic Physics and Biophysics
Laboratory-UYI * YAMENI STEINLEN DONAT D
(c)2021
2.4. LOCAL ASYMPTOTIC STABILITY OF DISEASE-FREE EQUILIBRIUM (DFE)
OF THE MODEL (2-2) 23
Re = (1 - è)(1 - ø)ë[
pâ1+ (1 - p)â2]. (2.8)
cf (ó1 + u + á) (? + u)
2.4.2 Local stability of balance without disease
(DFE)
Theorem 2.4. The DFE (Disease-Free Equilibrium) is locally
asymptotically stable when Re < 1 and unstable when
Re > 1.
Proof. The local stability of the model is analyzed by the
Jacobian matrix of the system at the equilibrium point î0 =
(efë , 0, 0, 0, 0, 0).
It is recalled that this number of reproductions is defined in
the presence of control measures (social distancing and wearing a face
mask).
|
J(î0) =
|
? ?
-(cf) 0 -â1(1 - è)(1 - ø)S(0)
-â2(1 - è)(1 - ø)S(0) 0 0
? ?
? ?
?0 -ä â1(1 - è)(1 - ø)S(0)
â2(1 - è)(1 - ø)S(0) 0 0 ?
? ?
? ?
?0 pä -(ó1 + á + u) 0 0 0 ?
? ?
? ?
?0 (1 - p)ä 0 -(? + u) 0 0 ?
? ?
? ?
?0 0 á ? -(ó2 + u) 0 ?
? ?
è 0 ó1 0 ó2 0
|
The characteristic equation of this matrix is obtained by
computing det(ëI6 - J(î0)) = 0
|
det =
|
? ?
ë + cf 0 -â1(1 - è)(1 - ø)S(0)
-â2(1 - è)(1 - ø)S(0) 0 0
? ?
? ?
?0 ë + ä â1(1 - è)(1 -
ø)S(0) â2(1 - è)(1 - ø)S(0) 0 0 ?
? ?
? ?
?0 pä ë + (ó1 + á + u) 0 0 0
?
? ?
? ?
?0 (1 - p)ä 0 ë + (? + u) 0 0 ?
? ?
? ?
?0 0 á ? ë + (ó2 + u) 0 ?
? ?
è 0 ó1 0 ó2 ë
|
det(ëI6 - J(î0)) = 0 This means
ë(ë + U)(ë + X)[ë3 +
?1ë2 + ?2ë + ?3]. (2.9)
Master's thesis II ? Molecular Atomic Physics and
Biophysics Laboratory-UYI ? YAMENI STEINLEN DONAT D
(c)2021
2.4. LOCAL ASYMPTOTIC STABILITY OF DISEASE-FREE
EQUILIBRIUM (DFE) OF THE MODEL (2-2) 24
We asked, in order to simplify the calculations:
|
{
|
U = cf,
V = ó1 + á + u,
W = ? + u. Y = ó2 + u.
|
The first three eigenvalues are:
ë1 = 0, ë2 = -cf, ë3 =
-(ó2 + u). (2.10)
The three other eigenvalues are obtained by solving
ë3 + ?1ë2 + ?2ë + ?3 = 0, (2.11)
|
where
|
{
|
?1 = V + W + ä,
?2 = (V + W)ä + ä(1 - è)(pâ1 + (1
- p)â2),
?3 = V Wä(1 - è)Rc.
|
(2.12)
|
According to the ROUTH-HURWITZ, the solutions of
(2.9) have positive real parts when :
?1 > 0, ?2 > 0, ?3 > 0, et ?1?2 > 0. More
clearly,
?1, ?2, ?3 > 0 when Rc < 1, This means that
?1?2 > ?3
All calculations done, we see clearly that ?1?2 > ?3.
?1?2 > ?3 when R0 < 1
So î0 is locally asymptotically stable.
2.5. GLOBAL ASYMPTOTIC STABILITY OF THE DISEASE-FREE EQUILIBRIUM
OF MODEL (2.2) 25
2.5 Global asymptotic stability of the disease-free
equilibrium of model (2.2)
Theorem 2.4. The endemic equilibrium
î* = (S*, E*,
I*nd,
Id*,Q*,R*) of the
model exists and is globally asymptotically stable when R0 > 1 .
Proof. To demonstrate the global stability of the
endemic equilibrium, we construct a Lyapunov function [25, 26],
æ = X1E + X2Ind + X3Id + X4Q. (2.13)
æ = (ëâ1(1 -
è)(1 -ø)p+ cf(ó1 + á + u)
Where
ëâ2(1 - è)(1 - ø)(1 -
p) ëâ1 ëâ2
)E + cf(ó1 + u + á)Ind + Id, (2.14)

cf(? + u) cf + ?
æÿ = (ëâ1(1 -
è)(1 - ø)p cf(ó1 + á + u) +
ëâ2(1 - è)(1 - ø)(1 -
p) ëâ1
) Eÿ+ ÿInd+ ëâ2
ÿId. (2.15)
cf(? + u) cf(ó1 + u + á) cf(? + u)
ëâ2(1 - p)
let's replace the derivatives of ÿE,
ÿInd, ÿId in the expression(2.12), we
obtain:
(2.16)
æÿ =[ëâ1p
cf(ó1 + á + u) +
cf(? + u) ](1 - è)(1 - ø)(â1Ind +
â2Id)(1 - è)(1 - ø)
|
(1 - è)(1 - ø)ëâ1
cf
|
Ind - (1 - è)(1 - ø)ëâ2
cf
|
Id.
|
Master's thesis II ? Molecular Atomic Physics and
Biophysics Laboratory-UYI ? YAMENI STEINLEN DONAT D
(c)2021
|
æÿ = [Rc](â1Ind + â2Id) - (1 -
è)(1 - ø)ëâ1
cf
|
Ind - (1 - è)(1 - ø)ëâ2
cf
|
Id. (2.17)
|
from where
|
æÿ = [Rc](1 - è)(1 -
ø)(â1Ind + â2Id) - (1 - è)(1 -
ø)ëâ1
cf
|
Ind - (1 - è)(1 - ø)ëâ2
cf
|
Id. (2.18)
|
Thus æ < 0 if and only if Rc < 1, and
if æ = 0 and if E = Ind = Id = 0 therefore æ is a lyapunov function
for the system (2-2). Thus it follows by the La Salle invariance principle [27]
that the DFE of model (2-2) is globally asymptomatically stable when
Rc < 1.
2.6. CONCLUSION 26
2.6 Conclusion
Throughout this chapter, we have studied an epidemiological
model. It follows from our study that infectious diseases can indeed be
characterized by mathematical models. These models allowed us to represent the
variation of the population in the form of differential equation systems, often
non-linear. It was a question for us to make the different stability analyses,
namely the analysis of the local stability of disease-free equilibrium (DFE),
and the global asymptotic stability of the disease-free equilibrium. One of the
most important criteria to characterize the diffusion of an epidemic is R
(Number of reproduction with control measures) which is the basic
reproduction rate of the virus during the epidemic taking into account the
control measures (social distancing, face mask, containment, case detection).
It appears that when R < 1 the DFE is globally asymptotically
stable and unstable when Rc > 1, the endemic
equilibrium when it exists is globally asymptotically stable for
Rc > 1 making automatically unstable the DFE
[24].
Master's thesis II * Molecular Atomic Physics and
Biophysics Laboratory-UYI * YAMENI STEINLEN DONAT D
(c)2021
CHAPTER III
RESULTS AND DISCUSSION
27
3.1 Introduction
The objective of this chapter is to present clearly the
results of the simulation of the system (2-2) by seeing the influence of
certain parameters of the model on the dynamics of the evolution of certain
compartments, to carry out a prediction for the case of Yaounde and Douala in
Cameroon and finally to evaluate the impact of the social distancing and the
use of the face mask.
3.2 Numerical method
In this section, we will perform sensitivity analysis on the
model parameters due to uncertainties involved in the estimation of some of the
model parameters. We will also perform numerical simulations of the model to
evaluate the impact of various control strategies on the disease dynamics. The
equations of the model (2-2) are solved numerically using the Matlab toolbox
ODE45 based on the Runge-Kutta fourth order method. The stability of the method
is well established in [28].
3.3 Model fitting
Cases are reported continuously from March 17, 2020,
Therefore, we consider March 17, 2020 as the start date of the epidemic in
Cameroon. We set the population size of Yaounde and Douala as the initial value
of the susceptible group (S(0) = 8 × 10⁶). The incubation
period of COVID-19 varies from 2 to 14 days, with an average of 5 to 7 days,
and we take the value of 7 days in our model. The average recovery period is
about 15 days[29], and so we set disease recovery rates at ó1 =
ó2 = 1/15 per day.
3.3. MODEL FITTING 28
Master's thesis II * Molecular Atomic Physics and
Biophysics Laboratory-UYI * YAMENI STEINLEN DONAT D
(c)2021
The model fitted to the accumulation of newly reported cases
is shown in Figure 3.1. The estimated parameter values are given in Table 2. It
can be seen from Figure 3.1 that the prediction of model (2.2) has a similar
trend to the reported cumulative conforming case data [4].
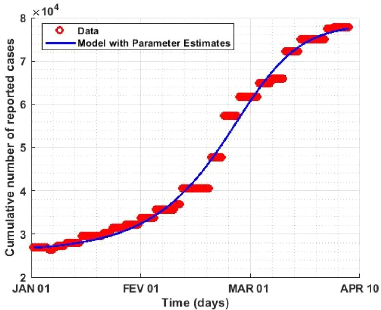
Figure 3.1: Model adapted to the new cumulative cases of COVID-19
reported for the period 01 January 2020 to 10 April 2021.
Figure (3.1) shows that our model fit well to the Cameroon data
(cumulative daily number of reported cases) for the period January 01, 2020 to
April 10, 2021. The blue curve represents the model solution and the red curve
represents the disease cases per day.
Table 2: Estimated parameters
3.4. MODEL SENSITIVITY ANALYSIS 29
Master's thesis II *
Molecular Atomic Physics and Biophysics Laboratory-UYI
* YAMENI STEINLEN DONAT D
(c)2021
|
Parameters
|
values
|
Sources
|
|
À
|
500
|
assumed
|
|
â1
|
0.7421
|
estimated
|
|
â2
|
0.0485
|
estimated
|
|
cf
|
0.0446
|
estimated
|
|
p
|
0.9150
|
estimated
|
|
ä
|
0.1428
|
assumed [29]
|
|
E
|
0.0096
|
estimated
|
|
u
|
0.0015
|
asusmed [30]
|
|
á
|
0.1473
|
estimated
|
|
u1
|
0.066
|
assumed [29]
|
|
u2
|
0.066
|
assumed [29]
|
|
è
|
0.2988
|
estimated
|
|
ø
|
0.19
|
estimated
|
3.4 Model sensitivity analysis
We do the sensitivity analysis around Rc, it is a
question of showing on the one hand the parameters which influence positively
the model, and those which influence negatively the model on the other hand.
Using the formula
n ?Rc
?n = .?n , (3.1)
Rc
Where n represents here the different parameters of our model,
we calculate the different indices of our model.
Table 2: Sensitivity indices of the model
3.4. MODEL SENSITIVITY ANALYSIS 30
|
Parameters
|
Index if sensitivity
|
|
À
|
1
|
|
â1
|
0.9748
|
|
â2
|
0.0252
|
|
cf
|
-1
|
|
p
|
0.7036
|
|
u
|
-0.2058
|
|
E
|
-0.0041
|
|
á
|
-0.5440
|
|
ó1
|
-0.2462
|
|
è
|
-0.4261
|
|
ø
|
-0.2372
|
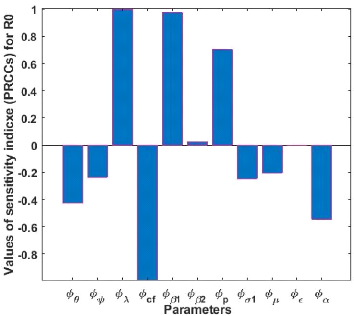
Figure 3.2: Histogram of the sensitivity analysis between
Rc and each parameter
Master's thesis II * Molecular Atomic Physics and
Biophysics Laboratory-UYI * YAMENI STEINLEN DONAT D
(c)2021
3.5. SHORT-TERM PREDICTIONS 31
Master's thesis II * Molecular Atomic Physics and
Biophysics Laboratory-UYI * YAMENI STEINLEN DONAT D
(c)2021
Because of the uncertainties that may arise in the parameter
estimates used in the simulations, a Latin hypercube sampling (LHS) [32] is
implemented on the model parameters. For the sensitivity analysis, we perform a
Partial Rank Correlation Coefficient (PRCC) between the values of the
parameters in the response function and the value of the response function
derived from the sensitivity analysis [33]. individual transmission rate /31,
the detected infection individual transmission rate /32, recovery
rate of infected individuals a1, recovery rate of quarantined individuals U2,
the accounting of parameters p, /31, /32, and a, have a positive
influence on Re, an increase of these parameters thus implies an
increase on Re. A when 0, B, a, E, a1, cf, and ,u have a negative
influence on Re; an increase in these parameters implies a decrease
in Re.
The public health implication is that, COVID-19 can be
effectively controlled in the population by reducing the rate of transmission,
achieved by preventive measures such as strict social distancing regulations
and mandatory wearing of masks in public, and also by reducing the
infectiousness of asymptomatic humans through appropriate treatment.
Furthermore, the disease burden can be significantly reduced in the population
if efforts are put in place to intensify the detection rates of asymptomatic
and symptomatic infectious humans in order to isolate them and offer them
appropriate treatment.
From this analysis, we can make the following suggestions:
* Mass screening is a good control tool because it increases
the value of the quarantine rate. * Boundary locking has proven to be an
effective control measure against the growth of COVID-19, as it reduces the
value of the susceptible recruitment rate.
* The containment rate of susceptible individuals contributes
to reducing the values of the transmission rates /31 and /32 and to
increasing cf, so this containment rate plays an important role in reducing the
number of infected individuals.
3.5 Short-term predictions
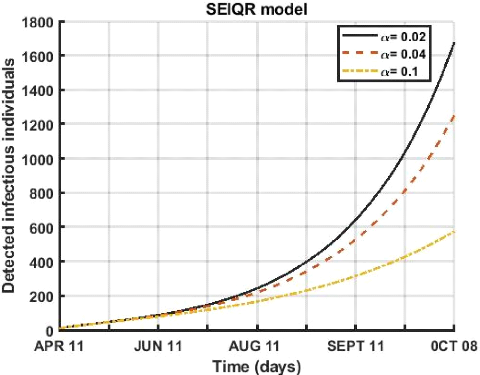
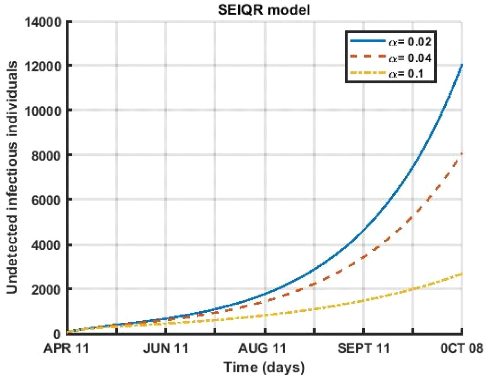
3.5.1 Effect of quarantine of undetected individuals
on the dynamics of disease transmission
The parameter a is the rate of non-detects in quarantine, the
following graphs show us the impact of this parameter on the dynamics of
disease spread.
3.5. SHORT-TERM PREDICTIONS 32
Master's thesis II * Molecular Atomic Physics and
Biophysics Laboratory-UYI * YAMENI STEINLEN DONAT D
(c)2021
Figure 3.3: Evolution of quarantine rate of undetected
contagious over a period of 180 days for different values ( á =
0.02, á = 0.04, á = 0.1
).
Figure (3.3), shows the evolution of detected infected persons
for the period from April 12 to October 8, 2021. An increase in the quarantine
rate of undetected infectious of symptomatic humans has led to a decrease in
the number of active cases.
3.5. SHORT-TERM PREDICTIONS 33
Master's thesis II * Molecular Atomic Physics and
Biophysics Laboratory-UYI * YAMENI STEINLEN DONAT D
(c)2021
Figure 3.4: Evolution of quarantine rate of undetected
contagious over a period of 180 days for different values ( á =
0.02, á = 0.04, á = 0.1
).
Figure (3.4) shows that for the period from April 12 to October
8, 2021. An increase in the quarantine rate of undetected contagious
individuals of the disease which leads to a decrease in the number of
undetected individual cases.
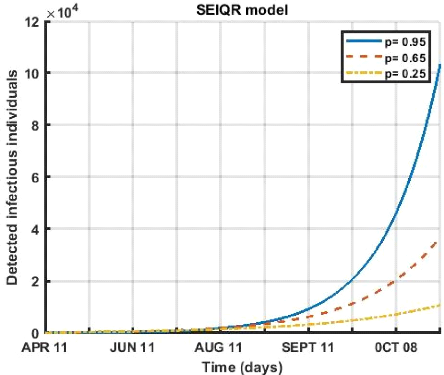
3.5.2 Effect of the proportion p on the
dynamics of disease transmission
. The parameter p is the fraction exposed that becomes
undetectable infectious, the following
graphs show us the impact of this parameter on the dynamics of
propagation of the disease.
3.5. SHORT-TERM PREDICTIONS 34
Master's thesis II * Molecular Atomic Physics and
Biophysics Laboratory-UYI * YAMENI STEINLEN DONAT D
(c)2021
Figure 3.5: Evolution of Fraction of exposures that
become infectious undetected over a period of 180 days for different
values ( p = 0.95, p = 0.65, p = 0.25 ).
In figure (3.5), we observe a decrease in the fraction exposed
that become undetectable infectious of the disease which leads to a decrease in
the number of active cases, for the period from April 12 to October 08, 2021,
any decrease in this rate also leads to a drop in the number of patients.
3.5. SHORT-TERM PREDICTIONS 35
Master's thesis II * Molecular Atomic Physics and
Biophysics Laboratory-UYI * YAMENI STEINLEN DONAT D
(c)2021
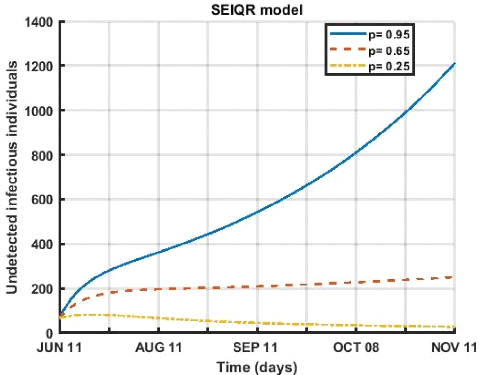
Figure 3.6: Evolution of Fraction of exposures that
become infectious undetected over a period of 180 days for different
values ( p = 0.95, p = 0.65, p = 0.25 ).
Figure (3.6) shows that for the period from 12 April to 08
October 2021. Any decrease in the fraction of exposed individuals who become
undetectable infectious of the disease that leads to a rapid decline that tends
to cancel out as a function of time, the number of undetected individual
cases.
3.5. SHORT-TERM PREDICTIONS 36
Master's thesis II * Molecular Atomic Physics and
Biophysics Laboratory-UYI * YAMENI STEINLEN DONAT D
(c)2021
3.5. SHORT-TERM PREDICTIONS 37
Master's thesis II * Molecular Atomic Physics and
Biophysics Laboratory-UYI * YAMENI STEINLEN DONAT D
(c)2021
3.5. SHORT-TERM PREDICTIONS 38
3.5.3 Effect of the quarantine of detected individuals
on the dynamics of disease transmission
The parameter c is the rate of quarantine of infectious
individuals, the following graphs show us the impact of this parameter on the
dynamics of the disease propagation.
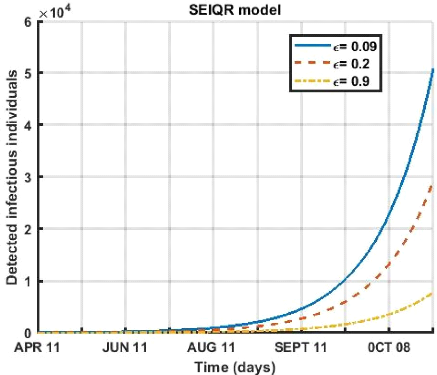
Figure 3.7: Evolution of the quarantine rate of contagious
diseases detected over a period of 180 days for different values ( € =
0.09, € = 0.02, € = 0.1 ).
Figure (3.7) depicting for the period from April 12 to October
08, 2021. Any increase in the rate of quarantine of infectious individuals
leads to a decrease in the number of active cases of the sick.
Figure 3.8: Evolution of the quarantine rate of contagious
diseases detected over a period of 180 days for different values ( € =
0.09, € = 0.02, € = 0.1 ).
Figure (3.8) shows that for the period from April 12 to
October 8, 2021. An increase in the rate of quarantine of infectious
individuals leads to a slight decrease in the number of undetected symptomatic
cases of the sick.
Master's thesis II * Molecular Atomic Physics and
Biophysics Laboratory-UYI * YAMENI STEINLEN DONAT D
(c)2021
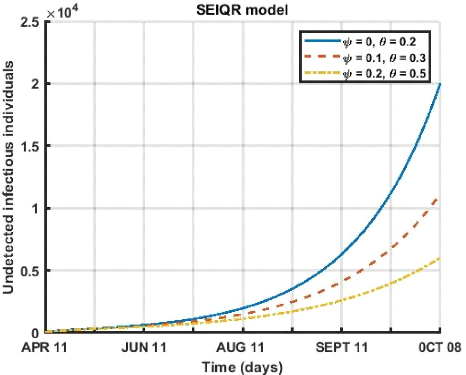
3.5.4 Effect of social distancing and the use of the
face mask
The parameters and are the rate of social distancing and the
use of the face mask , the following graphs show us the impact of this
parameter on the dynamics of the disease propagation.
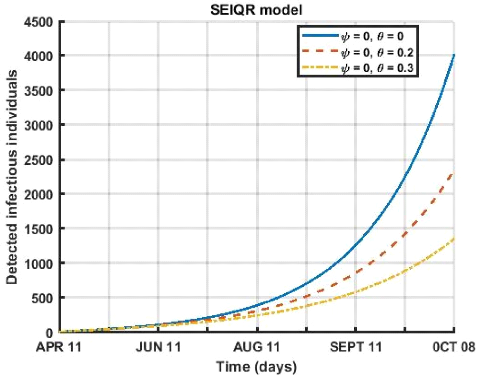
Figure 3.9: Evolution of social distancing and face mask use
over a 180-day period for different values ( = 0,0 = 0; = 0,0
= 0.2; = 0,0 = 0.3 ).
Here, in figure (3.9) we study the influence of the respect of
the barrier measures (mask wearing and social distancing) on the compartment of
detected infects. We notice that for a period going from April 12 to October 8,
2021 that within a population that does not respect the distancing ( = 0) the
detected infects decreases as the rate of mask wearing increases.
3.5. SHORT-TERM PREDICTIONS 39
Master's thesis II * Molecular Atomic Physics and
Biophysics Laboratory-UYI * YAMENI STEINLEN DONAT D
(c)2021
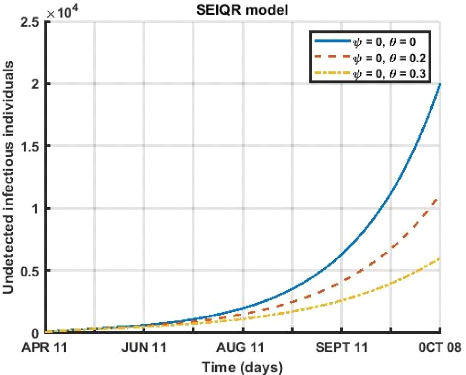
Figure 3.10: Evolution of social distancing and face
mask use over a 180-day period for different values ( = 0,0 = 0; = 0,0
= 0.2; = 0,0 = 0.3 ).
In this figure (3.10) we study the influence of the respect of
the barrier measures (wearing a mask and social distancing) on the compartment
of undetected infects. We notice that for a period going from April 12 to
October 8, that within a population that does not respect the distancing
(ø = 0) the undetected infects decreases as the rate of wearing a mask
increases.
3.5. SHORT-TERM PREDICTIONS 40
Master's thesis II * Molecular Atomic Physics and
Biophysics Laboratory-UYI * YAMENI STEINLEN DONAT D
(c)2021
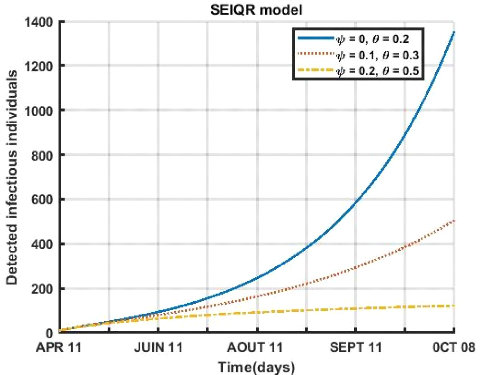
Figure 3.11: Evolution of social distancing and face
mask use over a period of 180 days for different values ( = 0,0 = 0.2;
= 0.1,0 = 0.3; = 0.2,0 = 0.5 ).
La figure (3.11) influence of the respect of the barrier
measures (wearing a mask and social distancing) on the compartment of detected
infects. We can see that for a period from April 12 to October 8, 2021 in a
population that respects less social distancing (ø = 0.1) and the
wearing of a face mask (è = 0.3) the detected infects decreases when the
rate of wearing a mask and social distancing increases.
3.5. SHORT-TERM PREDICTIONS 41
Master's thesis II * Molecular Atomic Physics and
Biophysics Laboratory-UYI * YAMENI STEINLEN DONAT D
(c)2021
Figure 3.12: Evolution of social distancing and face
mask use over a 180-day period for different values ( = 0,0 = 0.2; =
0.1,0 = 0.3; = 0.2,0 = 0.5 ).
Figure (3.12) shows the influence of the respect of the
barrier measures (wearing a mask and social distancing) on the compartment of
undetected infects. For a period from April 12 to October 8, 2021, in a
population that respects less social distancing (ø = 0.1) and face
masking (è = 0.3), the undetected infects decreases as the rate of mask
wearing and social distancing increases.
3.5. SHORT-TERM PREDICTIONS 42
Master's thesis II * Molecular Atomic Physics and
Biophysics Laboratory-UYI * YAMENI STEINLEN DONAT D
(c)2021
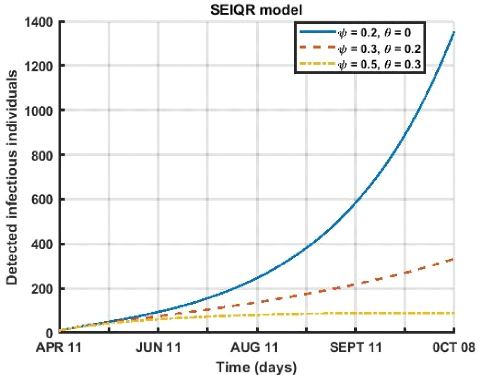
Figure 3.13: Evolution of social distancing and face
mask use over a 180-day period for different values ( = 0.2,0 = 0; =
0.3,0 = 0.2; = 0.5,0 = 0.3 ).
Figure (3.13) describes the influence of the respect of the
barrier measures (wearing a mask and social distancing) on the compartment of
detected infects. This dynamic shows that for a period going from April 12 to
October 8, 2021 that within a population that respects more social distancing
(ø = 0.5) and the wearing of a face mask (è = 0.3) the detected
infects decreases very quickly as a function of time when the rate of wearing a
mask and social distancing are high.
3.5. SHORT-TERM PREDICTIONS 43
Master's thesis II * Molecular Atomic Physics and
Biophysics Laboratory-UYI * YAMENI STEINLEN DONAT D
(c)2021
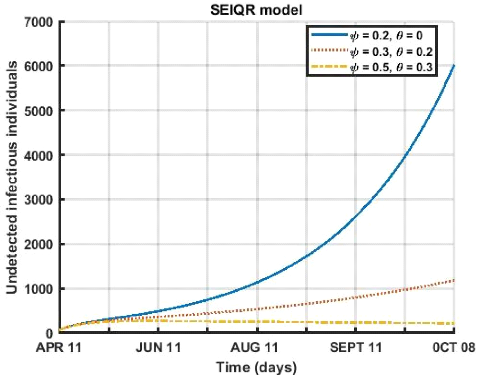
Figure 3.14: Evolution of social distancing and face mask use
over a 180-day period for different values ( = 0.2,0 = 0; = 0.3,0 = 0.2; =
0.5,0 = 0.3 ).
Figure (3.14) shows the different variations in the influence
of the respect of the barrier measures (wearing a mask and social distancing)
on the compartment of undetected infections. We see that for a period from
April 12 to October 8, 2021, in a population that respects more social
distancing (ø = 0.5) and wearing a face mask (è = 0.3), the
number of undetected infects decreases very quickly as a function of time when
the rate of wearing a mask and social distancing are high.
3.6. DISCUSSION 44
3.6 Discussion
Based on the model fitted in this work, we have estimated the
values of parameters â1, â2, c, á, è, ø, p and
cf with three sets of data, the initial values of E,
Id and Ind have
been also taking into account. Figure (3.1) shows that the model fitted the
data well, this strongly reveals that our lack of knowledge and understanding
of the long community transmission have been in the population (as at the time
of the first case index announced on March 06, 2020) could harm our knowledge
of the real burden of disease COVID-19 in Yaounde and Douala. Therefore, very
strict measures must be taken to identify the others as possible, through
aggressive screening and testing of the population, especially for asymptomatic
cases and application of other control measures.
Master's thesis II * Molecular Atomic Physics and
Biophysics Laboratory-UYI * YAMENI STEINLEN DONAT D
(c)2021
GENERAL CONCLUSION AND
OUTLOOK
In summary in this work, we aimed to address the impact of
different non-pharmaceutical control measures on the population dynamics of the
novel Coronavirus 2019(COVID-19) in Yaounde and Douala ( Cameroon), using a
formulated mathematical model. Using the available data, since its first
reported case on March 06, 2020, we developed a predictive tool for the
cumulative numbers of reported cases and active case in Yaounde and Douala, we
also estimated the basic reproduction numbers of the epidemic in the above
mentioned cities in Cameroon. Using US simulations, we show the effect of
control measures, particularly joint social distancing, face mask use, and case
detection (via tracing and subsequent testing) on the dynamics of COVID-19. We
also provided predictions for active detectable and non-detectable cases for
different levels of control measures being implemented. Numerical simulations
of the model show that if at least 50% of the population complies with the
social distancing regulation with about 50% of the population effectively using
mask wearing in public, the disease will eventually die out in the population
and that if we can increase the case detection rate among infected individuals
to about 0.8 by day with about 50% of the population complying with the social
distancing rules, this will result in a sharp decrease in the disease incidence
and prevalence of COVID-19.
Therefore, to reduce the spread of COVID-19 at the community
level, this study urgently recommends very strict measures to be taken by
policy makers and authorities to identify new cases, through aggressive
screening and testing of the population and strict enforcement of the use of
face masks and distancing rules.
45
In our future work, we intend:
3.6. DISCUSSION 46
Master's thesis II * Molecular Atomic Physics and
Biophysics Laboratory-UYI * YAMENI STEINLEN DONAT D
(c)2021
* To study other forms modeling of control measures such as that
of COVID-19 vaccines. * To analyse the intra-hote dynamics of COVID-19.
47
Bibliographic references
[1] Sene N. SIR Epidemic model with Mittag-Leffler fractional
derivative. Chaos, Solitons and Fractals 2020;137:109833.
[2] Rothana H, Byrareddy S. The epidemiology and pathogenesis
of coronavirus disease ( COVID-19) outbreak. J Autoimmun 2020;109:102433.
[3] World Health Organisation et al. Coronavirus disease 2019
(covid-19): situation report, 72. 2020.
[4] Coronavirus nombre de cas au Cameroun.
https://
www.coronavirus-statistiques.com/stats-pays/coronavirus-nombre-de-cas-au-Cameroun;
(consulté le 06 Septembre 2021).
[5] Nkague N, Mann M, Manga T, Mbang J. Modeling analysis of
a SEIQR epidemic model to assess the impact of undetected case, and predict the
early peack of the COVID-19 outbreak in Cameroon. Research square, 2020.
[6] Nofe Al-Souad, Meir Shillor Departement of Mathemetics
and Statistics Oakland University Rochester, MI 48309-4401,USA.
[7] Coronavirus et covid-19. Inserm-La science pour santé
https://www.inserm.fr/actualites-et-evenements/actualites;
( consulté le 20 Juin 2021).
[8] Coronavirus-Bulletin of the Atomic scientists.
https://thebulletin.org/coronavirus;
( consulté le 13 Juin 2021).
[9] Image: rirborne transmission of covid-19.The BMJ.
https://image.app.goo.gl/HW5iTijgmYDPvSE68;
( consulté le 29 Mai 2021).
[10]
BIBLIOGRAPHIC REFERENCES 48
Master's thesis II * Molecular Atomic Physics and
Biophysics Laboratory-UYI * YAMENI STEINLEN DONAT D
(c)2021
Image: Les médecins camerounais déploient une
unité mobile de test covid-19
https://images.app.goo.gl/UeTs53KJsfBrWjAc8;
(consulté le 16 Juin 2021).
[11] COVID-19-Causes, Symtoptômes, Traitement,
Diagnostic-salutbonjour.ca.
https://resourcessante.salutbonjour.ca/condition/getcondition/covid-19;
( consulté le 29 Mai 2021).
[12] Impact du coronavirus sur l'économie: au Cameroun,
https://www.investiraucameroun.com;
11 Juin 2020.
[13] Human coronavirus 229E-wikipedia
https://en.m.wikipedia.org/wiki/human-coronavirus-229E
Août 2021.
[14] Coronavirus: Suivi en direct des cas en Afrique-BBC;
https://www.bbc.com/afrique/resources
(consulté le 20 Juin 2021 ).
[15] Covid-19: la létalité du virus augmente en
Afrique, continent jusqu'ici plutôt épidémiologie;
https://www.Ici.fr/international/covid-19-coronavirus-pandémie
(consulté le 20 juin 2021).
[16] Brauer F, Castillo-Chavez C, Mubayi A, Towers S. Some
models for epidemic of vector-transmitted diseases. Infect Dis Model
2016;1:78-9.
[17] Kermack W, Mckendrick A. A contribution to the mathematical
theory epidemics. proc R soc A 1927;115(772):700-21.
[18] Yousefpour A, Jahansbahi H, Bekiros S, Optimal of the
novel coronavirus disease (COVID-19) outbreak. Chaos Solitons Fractals
2020;136:109883.
[19] Xue I, Jing S, Miller J, Sun W, Li H, Estrada-Franco J,
Hyman J, Zhu H. A data-driven network model for the emerging COVID-19 epidemics
in Wuhan, Toronto and Italy. Math Biosci 2020:108391.
[20] Hethcote H. The mathematic of infecious diseases. SIAM
Rev 2000;42(4):599-653.
[21] Tang B, Brangazzi N, Li Q, Tang S, Xiao Y, Wu J. An
updated estimation of the risk of transmission of the nouve coronavirus
(2019-nCoV). Infect Dis Model 2020;5:225-48.
[22]
BIBLIOGRAPHIC REFERENCES 49
Master's thesis II * Molecular Atomic Physics and
Biophysics Laboratory-UYI * YAMENI STEINLEN DONAT D
(c)2021
Crokidakis N. COVID-19 Spreading in Rio de janeiro, Brazil: do
the policies of social isolation really work? Chaos Solitons Fractals
2020;136:109930.
[23] Okuonghae D, Omame A. Analyses of a mathematical model
for COVID-19 population dynamics in Lagos, Nigeria. Chaos, Solitons and
Fractals 2020;139:110032.
[24] Van den Driessch P, Watmough J. Reproduction numbers and
sub-threshold endemic equilibria for compartimental models of disease
transmission. Math Biosci 2002;180:29-48.
[25] Gashirai T, Musekwa-hove S, Lolika P, Mushayabassa S.
Global stability and optimal control analysis of a foot-and-mouth disease model
with vaccine failure and environmental transmission? Chaos Solitons Fractals
2020;132:109568.
[26] Okuonghae D. Lyapunov function and global properties of
some tuberculosis models. J Appel Math Comput 2015;48:421-43.
[27] La Salle J, Lefschetz S. The stability of dynamical
systems. Philadelphia: SIAM; 1976.
[28] McCall J. Genetic algorithms for modelling and
optimisation. J Comput Appl Math 2005;184:205-22.
[29] Remy P, Xutong W, Michaela P, Zhanwei D, Spencer J,
Michael P, Clay J, and Lauren A. Covid-19 healthcare demand projections:
Austin, texas, 2020.
[30] Coronavirus dans le monde et par pays. http://
coronavirus. politologue.com/ coronavirus-Cameroun.cm; accessed: May 2020.
[31] Coronavirus-ce-qu'il-faut-savoir;jun2021.
https://www.doctissimo.fr/sante/epidemie/coronavirus-chinois;
(consulte le 21 Juin 2021).
[32] Blower S, Dowlatabadi H. Sensitivity and uncertainty
analysis of complex models of disease transmission: an HIV model, as an
example, Int. Stat. Rev. 1994;2:229-243.
[33] Marino S, Hogue I, Ray C, and Kirschner D. A methodology
for performing global uncertainty and sensitivity analysis in systems biology.
Journal of Theoretical Biology. 2008;254:178-196.
[34] Covid-19.
https://www.futura-sciences.com/sante/definitions/coronavirus-covid-19-18585;(
consulté le 05 Juin 2021).
|