DEVELOPMENT OF ORGANIC SOUP FROM DRIED VEGETABLES
GROWN IN RWANDADECLARATION
I, UWAYO Désiré, an under
graduated student in the Faculty of Science, Department of Food Science and
Technology, with registration N° GS20050750, declare that the content of
this report entitled « DEVELOPMENT OF ORGANIC SOUP FROM DRIED
VEGETABLES GROWN IN RWANDA » is my own and original work. It is
submitted in partial fulfilment of the requirements for the award of a
Bachelor's Degree of Science in Food Science and Technology.
To the best of its value, it has never been submitted in any
University or in any other higher learning institution for any award.
UWAYO Désiré
..................................................
Date:
........................................
KIGALI INSTITUTE OF SCIENCE AND TECHNOLOGY
INSTITUT DES SCIENCES ET DE TECHNOLOGIE DE
KIGALI
Avenue de l'Armée, B.P. 3900 Kigali, Rwanda
FACULTY OF SCIENCE
DEPARTMENT OF FOOD SCIENCE AND TECHNOLOGY
CERTIFICATE
This to certify that the Project Work entitled «
DEVELOPMENT OF FLAVOURED ORGANIC SOUP ( for export) FROM DRIED
VEGETABLES GROWN IN RWANDA » is a record of the original
benefice work done by UWAYO Désiré under my supervision, in
partial fulfilment of the requirements for the award of Bachelor's Degree of
Science in Food Science and Technology in Kigali Institute of Science and
Technology (KIST), during the Academic Year 2008.
Supervisor: Mr. Dominique S. NKUNDA
Head of Department of Food
Date..............................................
Science and Technology
....................................................
...............................................
DEDICATIONS
To JEHOVAH, the Almighty God for his protection and special
favors he provided me.
To my beloved wife KWIZERA Naomi, for her care and support
during all my work.
To my mother BARAYAVUGA M. Rose for the attention and
sacrifices she made for me to become what I am today.
To my brothers, sisters and other family members, friends and
relatives.
I dedicate this outcome of my four years.
May JEHOVAH protect and bless you.
ACKNOWLEDGEMENTS
My first and special thanks go to JEHOVAH, my Almighty God for
giving me life, and being my guide from my birth till now, without him nothing
could have been achieved.
I also thank the Rwandan government which has contributed a
lot to my studies by giving me scholarship and KIST who have contributed to my
studies by providing all the necessary course materials.
Thanks to the Head of the Department of Food Science and
Technology and its staff, they were always in touch with me for advises about
techniques to use and how to do a usability studies.
Thanks go also to my unforgettable supervisor, Dominique S.
NKUNDA, for his continuous support and collaboration during this Research
Project.
Special thanks go to my wife who took care of me and assisted
me in different ways.
Special thanks go also to my Mother for all the sacrifices she
made for me to become what I am today.
I say thanks to my brothers Parfait BIZIMANA and
Dieudonné NIYIBIZI, and to my sisters Olive MUKASE and Solange UWAMAHORO
for sharing their experience of life with me, for listening to my complaints,
and for believing in me.
Further thanks are addressed to all members of my class for
their friendship and encouragement during the course of this study, for
interesting discussions made together and being fun to be with me. Thanks go to
all persons who contributed morally, materially and in any other form of help.
May God reward them for all those done for me!
Jehovah's blessings are my wishes to you all.
UWAYO Désiré
ABSTRACT
A soup is a
food that
is made by combining ingredients such as
meat or
vegetables
in
stock
or hot/boiling
water,
until the flavor is extracted, forming a
broth, but
here, only vegetables were used to develop an organic soup. Vegetables are
defined as either whole plants or only some parts of plants served with the
main course of a meal. The edible parts can be stems, roots, leaves, flowers,
fruits and / or grains. They normally contain between 90 - 96 % of moisture
when they are fresh. Drying was found to be one of the means of processing and
preserving them.
Value was added to the dried vegetables, by mixing
different ingredients in well defined proportions, and developing a well
appreciated naturally flavoured vegetable soup.
Different vegetables used as ingredients ( carrots,
celery, garlic, leek, onion, pepper, potatoes, and spinach ), were bought in
Kimisagara market, then dried into a hybrid dryer, blended, weighed and mixed
to develop the soup which was packaged in plastic bags and labeled. Laboratory
analysis and sensory evaluation were carried out so as to know the chemical
composition of the soup and its consumer acceptability. The soup was found to
contain an average value of 4.98% moisture content, 95.02% total solid matter,
as well as 13.06% crude protein, 3.17% lipids, 8.44% ash & minerals, 1.66%
vitamin C, and 68.69% total soluble sugars.
The mean score of  obtained on overall acceptability of the soup showed that it was accepted
and judged to be satisfactory.
obtained on overall acceptability of the soup showed that it was accepted
and judged to be satisfactory.
Keywords: Soup, Vegetable.
LIST OF ABBREVIATIONS
ANOVA : Analysis of the variance
aw : Water activity
ISAE : Institut Supérieur
d`Agriculture et d`Elevage
ISAR : Institut des Science Agronomiques
du Rwanda
MC : Moisture content
LIST OF FIGURES AND TABLES
1. FIGURES
Pages
Figure 2.2.1 : Picture of
spinach................................................................12
Figure 2.2.2 : Picture of potatoes
..............................................................13
Figure 2.2.3 : Picture of
leek....................................................................14
Figure 2.2.4 : Picture of
pepper.................................................................15
Figure 2.2.5 : Picture of
tomatoes.............................................................16
Figure 2.2.6 : Picture of
celery..................................................................17
Figure 2.2.7 : Picture of
carrot...................................................................18
Figure 2.2.8 : Picture of
onion...................................................................19
Figure 2.2.9 : Picture of
garlic...................................................................20
Figure 4.1: dried vegetables (after the process
drying)......................................28
Figure 4.2.2 : flow chart of soup
development................................................30
Figure 4.3.1 : graph of comparison between sensory attributes
( before opening ).......31
Figure 4.3.2 : graph of comparison between sensory attributes
( after opening )........33
Figure 4.3.3. : graph of comparison of acceptability before
and after opening..........34
2. TABLES
Table 2.2.1: Nutritional value of
spinach.......................................................12
Table 2.2.2: Nutritional value of potato
.......................................................13
Table 2.2.5: Nutritional value of
Tomato.......................................................16
Table 2.2.6: Nutritional value of
celery.........................................................17
Table 2.2.7: Nutritional value of
carrot..........................................................18
Table 2.2.8: Nutritional value of
onion...........................................................19
Table 2.2.9: Nutritional value of
garlic...........................................................20
Table 3.3.2: composition of six proposed
soups................................................23
Table 4.1: results from the experiment of
drying..............................................28
Table 4.2.1: results of the first sensory
analysis................................................29
Table 4.2.2.a : composition of the formulated
soup...........................................29
Table 4.2.2.b : results of the second sensory
analysis.........................................30
Table 4.3.1.a : results of consumer acceptability check
(before opening)..................31
Table 4.3.1.b : summary of results of ANOVA ( before opening
)..........................32
Table 4.3.2.a : results of consumer acceptability check (after
opening)....................32
Table 4.3.2.b : summary of results of ANOVA ( after opening
)...........................33
Table 4.3.3. : comparison of acceptability before and after
opening........................34
Table 4.3.4 : results of consumer acceptability check for
packaging and labeling........35
TABLE OF CONTENT
Declaration............................................................................................i
Certificate.............................................................................................ii
Dedication.............................................................................................iii
Acknowledgments....................................................................................iv
Abstract................................................................................................v
List of
abbreviations.................................................................................vi
List of figures and
tables...........................................................................vii
Table of
content.....................................................................................viii
Chapter One :
INTRODUCTION..............................................................1
1.1. Problem
statement..............................................................................1
1.2. Significance of the
study......................................................................2
1.3. Objectives of the
study.......................................................................2
1.3.1. Main ( overall)
objective.....................................................................2
1.3. 2. Specific
objectives...........................................................................2
1.4.
Hypothesis........................................................................................3
Chapter Two: LITERATURE
REVIEW.....................................................4
2.1.
Definitions.......................................................................................4
2.1.1.
Soup............................................................................................4
2.1.2. Drying
..........................................................................................5
2.1.3.
Vegetables.....................................................................................6
2.1.3.i. Classification of
vegetables................................................................7
2.1.3.ii. Nutritional composition of
vegetables.................................................8
2.1.3.ii.a. Primary metabolites
......................................................................8
2.1.3.ii.b. Secondary
metabolites.................................................................10
2.1.3.iii. Effect of drying on
vegetables..........................................................10
2. 2. Some vegetables (
ingredients ) used ......................................................11
2.2.1. Spinach
.......................................................................................11
2.2.2.Potatoes.........................................................................................12
2.2.3.
Leek..........................................................................................13
2.2.4. Pepper
........................................................................................14
2.2.5. Tomatoes
.....................................................................................15
2.2.6.Celery...........................................................................................16
2.2.7.Carrot...........................................................................................17
2.2.8.Onion...........................................................................................19
2.2.9. Garlic
.........................................................................................20
Chapter Three : MATERIALS AND
METHODS........................................22
3.1. Research
design................................................................................22
3.2. Source of raw materials
....................................................................22
3.3. Experimental
procedures.......................................................................22
3.3.1. Preparation and drying of the
vegetables................................................22
3.3.2. Food formulation and
development......................................................23
3.3.2.i. Food formulation
proposal...............................................................23
3.3.2.ii. First sensory
analysis.....................................................................23
3.3.2.iii. Reformulation and second sensory
analysis..........................................24
3.3.3. Consumer acceptability
check...........................................................24
3.3.3.i. Statistical methods
used.................................................................24
3.3.4. Laboratory
analysis.........................................................................25
3.3.4.i. Moisture content
determination.......................................................25
3.3.4.ii. Ash and mineral content
determination.............................................25
3.3.4.iii. Carbohydrates content
determination................................................26
3.3.4.iv. Fat content
determination.............................................................26
3.3.4.v. Protein content
determination.........................................................26
3.3.4.vi. Vitamin C content
determination...................................................27
3.4. Pricing
mechanism........................................................................27
Chapter Four : RESULTS AND
DISCUSSION..........................................28
4.1.Drying of the
vegetables...................................................................28
4.2. Food formulation and
development.....................................................29
4.2.1. First sensory
analysis....................................................................29
4.2.2. Reformulation of the food and second sensory
analysis..............................29
4.3. Consumer acceptability
check............................................................31
4.3.1. Before
opening.............................................................................31
4.3.2. After
opening...............................................................................32
4.3.3. Comparison of acceptability before and after
opening..............................34
4.3.4. Assessment of the packaging and the
labeling..........................................35
4.4. Laboratory
analysis.........................................................................35
4.5. Price of the
product.........................................................................36
Chapter Five : CONCLUSIONS AND
RECOMMENDATIONS
5.1.
Conclusions................................................................................37
5.2. Recommendations
..........................................................................37
REFERENCES......................................................................................38
APPENDICES....................................................................................39
1. Questionnaire for suitable food formulation
..............................................40
2. Questionnaire for suitable cooking time and method
...................................42
3. Questionnaire for consumer acceptability
check..........................................43
4. Determination of total reducing sugar by Lane-Eynon
method.........................45
5. Determination of the fat content by the Soxhlet
method..................................47
6. Determination of protein content by the Kjeldahl
method.................................48
7. Determination of vitamin c content by indophenol
solution...........................50
8. Tables of results for consumer acceptability check ( before
opening)...................51
9. Tables of results for consumer acceptability check ( after
opening).....................52
10. Pricing mechanism for the developed
soup...............................................53
11. Label
used.......................................................................................54
Chapter One: INTRODUCTION
Fruits and vegetables are one among the most recommended and
essential foods because of their nutritional quality and effects on human body.
Some of the vegetables are considered to be important means of preventing
cancer through diet, and researches have shown mounting evidence that people
who avoid fruit and vegetables completely, or consume very little, are indeed
at increased risk of cancers diseases (TERRY et al
2001).
Some of the vegetables such as salad can be eaten uncooked,
while others require to be cooked or process before consumption. However, all
the production got can not be consumed efficiently, and this can lead to the
loss of a great part of the production of vegetables. It was observed that,
there are many varieties of vegetables and that until now, locally, there was
no way of processing them to increase their shelf life and to add to them
value. For this reason and others, it was necessary to carry out a research on
the way of processing vegetables in Rwanda.
1.1. PROBLEM STATEMENT
Rwanda, as one of the tropical region countries experiences
good climatic conditions and has a high production of different crops, among
which fruits and vegetables occupy a non negligible place.
However, an important part of this production of fruits and
vegetables is lost annually, because of poor post harvest handling. In fact,
vegetables as well as fruits have high moisture content and high water activity
(aw). These lead them to be highly perishable since
moisture content and water activity (aw) are ones
of the important factors to the growth of different microorganisms.
In addition, it is well known that during the harvest period,
the price of many food commodities including vegetables, is too low so that
farmers are losing and just after certain months, when comes the post
harvest period, there is lack or shortage of foods, then the price becomes too
high.
All these problems of production losses and fluctuation of the
vegetable prices on the market, can be overcome if the production of vegetables
were processed during the harvest period to increase their storage stability,
so that they can be stored longer and be used or sold during the post harvest
period. Keeping in mind that, water is the most important factor of the high
perishability of vegetables, their simplest method of processing, is drying
them in order to decrease their moisture content up to a level = 5% and water
activity = 0.20, where microorganisms are not favored to grow.
When are dried, vegetables can be used in many other ways, it
was necessary to study on how to develop a flavored organic soup ( for export
) from vegetables grown in Rwanda.
So these are the reason why the following research topic was
chosen: DEVELOPMENT OF ORGANIC SOUP FROM DRIED VEGETABLES GROWN
IN RWANDA.
1.2. SIGNIFICANCE OF THE STUDY
If well used, this research will be very important and
significant, since there will no longer be losses of vegetables because of lack
of (or poor) handling. In fact, this research shows how the excess production
of vegetables that can not be consumed directly during the harvest period, can
be processed in order to increase its stability and its shelf life, so that it
can be stored longer and be used further after.
Once again, the flavored organic soup produced, can be
exported to other countries, enabling the country to diversify the products it
exports and earn mach more foreign currency, what help in rising its economy.
1.3. OBJECTIVES OF THE STUDY
1.3.1. MAIN ( OVERALL) OBJECTIVE
The main objective of this study was to develop a flavored
organic soup (quality export), from dried vegetables grown in Rwanda.
1.3. 2. SPECIFIC OBJECTIVES
The specific objectives of this work were:
a. To formulate a flavoured soup (quality export), from dried
vegetables, grown in Rwanda.
b. To carry out a sensory evaluation of the formulated
food.
c. To determine the nutritional composition ( moisture
content, carbohydrates, proteins, fats, minerals and Vitamin C content) of the
formulated food.
d. To package and to label the formulated food.
1.4. HYPOTHESIS
The hypotheses of this research are as follows:
a. Dried vegetables can yield a good flavoured soup.
b. Food processing under guidance of consumer needs, allows
to achieve his satisfaction.
c. As moisture content in dried foods is too low, the storage
stability and the quality of the food will increase. However, vitamin C
content may be decreased by the fact of drying.
d. Dried soup has to be packed in containers that do not
allow (moisture) rehydration.
Chapter Two: LITERATURE REVIEW
2.1. DEFINITIONS
2.1.1. SOUP
A soup is a
food that is made by combining
ingredients such as
meat or
vegetables in
stock or
hot/boiling
water, until the flavor is
extracted, forming a
broth. It is sometimes
confused with
stew. The word soup
originates from "
sop", a dish originally
consisting of a soup or thick
stew which was soaked up with
pieces of
bread. The modern meaning of
sop has been limited to just the bread intended to be dipped.
Commercial soup became popular with the invention of
canning in the
19th century, and today
a great variety of canned and dried soups are on the market. Dr. John T.
Dorrance, a chemist with the
Campbell Soup
Company invented condensed soup in 1897. Today, Campbell's Tomato,
Cream
of Mushroom and Chicken Noodle soups are three of the most popular soups in
America. Americans consume approximately 2.5 billion bowls of these three soups
alone each
year (
www.wikipedia.org/wiki/soups
, 29/5/2008 ).
During the preparation of soups, there are so many important
factors that have to be taken into consideration. Some of them are listed below
:
The first one is «nitrate
content». Since nitrates can be carcinogenic, generally,
their use in food industry must as limited as possible. However their
limitation becomes furthermore important in soup making. This is so because
it has been demonstrated that , no nitrate was lost on cooking in accordance
with the manufacturers' directions; even when simmered for up to 25 minutes
(GARCIA-MATA et al 1995).
The second factor to be taken into account is the
«microbiological quality» of the soup. In
fact, studies have been carried out on the presence Clostridium
perfringens, one of the pathogenic and heat resistant microorganism, in
dehydrated soups and the organism was found in 18.2% of the samples. The soup
mixes had the lower incidence compared to Spaghetti sauce mixes that had the
highest incidence. One strain possessed heat-resistant spores that were able to
withstand boiling at 97.4°C for one hour prior to isolation. The presence
of preservatives in the food products did not influence the presence of C.
perfringens in these food preparations. So it is very important to pay a
strong attention on the microbiological quality of the soups and make sure
that it will be safe for human consumption since the general presence of this
microorganism in dehydrated soups and sauces may have epidemiological
significance in Clostridium perfringens food poisoning, especially
since these products are exposed to short besting periods (MITSURU, 1968).
The third factor, and last one on this list, is the
«use of organic vegetables» if the soup
must be commercialized. This will increase the consumers acceptability of the
soup and help in marketing. Studies have demonstrated that if consumers were
informed that soup is prepared with organic ingredients, they would improve
their acceptability scores, whatever the soup type. They revealed that
consumers appreciate soups made with organic crops and without seasoning
(MONACO et al 2007).
2.1.2. DRYING
Drying is probably the oldest food preservation process
practiced. Some foods, especially grains, are sufficiently dry as harvested or
with a little drying remain unspoiled for long periods under proper storage
conditions. However, most foods contain enough moisture to permit action by
their own enzymes and by microorganisms, so that to preserve them by drying ,
the removal (or binding ) of moisture is necessary.
Drying is a
mass transfer process
resulting in the removal of water
moisture by
evaporation from a
solid, semi-solid or
liquid to end in a solid
state. To achieve this, there must be a source of
heat, and a sink for evacuation
of the
vapor thus produced. Notice
that any method or technique that reduces the amount of available moisture,
i.e., lowers the water activity (aw), in a food, is
also a form of drying (FRAZIER et al 1988).
Among different methods of drying, sun drying, solar drying,
hot air drying, drum drying, freeze drying and microwave drying are briefly
discussed here as they have been explained by Vieira (1996).
- Sun drying: or natural drying is used in
hot climate, where moisture is removed by exposing foods to the sunrays
without any artificially produced heat and without controlling temperatures,
relative humidity, or air velocity.
- Solar drying: Uses solar energy to produce
heat in an artificial equipment called solar dryer.
- Hot air drying: When mechanical dehydrators
are used, the product to dry is placed on metal mesh belts in a tunnel or in
a cabinet on trays where controlled, elevated temperatures are used. The
air in dehydrators is heated ether by steam tubes or coils, or by being
mixed directly with the combustion gasses of gas or oil. Electric resistance
heaters can be used in some instances. The relative humidity and the air
velocity must also be controlled.
- Drum drying: the products to be dried are
allowed to flow onto the surface of two heated stainless steel drums located
side by side and rotating in opposite directions with little clearance
between them. The product dries on the drums and is scraped off by
stationary blades fixed along the surface of the drum.
-
Freeze
drying: is increasingly applied to dry foods, beyond its already
classical pharmaceutical or medical applications. It keeps biological
properties of proteins, and retains vitamins and bioactive compounds. The
freeze drying is carried out by first freezing the product and then
subjecting it to a very high vacuum, wherein temperatures are high enough to
assist in the evaporation of the moisture but low enough to prevent melting
of the ice in the product. In this method, the water, existing as ice in the
food, is evaporated directly as a vapor without passing through the liquid
phase (sublimation). The vapor evaporated by sublimation is removed from the
system by converting it into ice in a condenser, operating at very low
temperatures, outside the freeze drying chamber.
- Microwave drying: microwaves are used in
different drying applications including dehydration, concentration, and
finish drying where traces of moisture remaining after conventional drying
can quickly be removed from the inner portion of the product without
overheating the already dried product.
In addition to these drying methods, there is also a new one,
called
supercritical
drying or superheated steam drying, which
involves steam drying of products containing water. Strange as it seems, this
is possible because the water in the product is boiled off, and joined with the
drying medium, increasing its flow. It is usually employed in closed circuit
and allows a proportion of latent heat to be recovered by recompression, a
feature which is not possible with conventional air drying, for instance. May
have potential for foods if carried out at reduced pressure, to lower the
boiling point (
www.wikipedia.org/wiki/drying
,29/5/2008).
2.1.3. VEGETABLES
The term "vegetable" generally refers to the
edible part of a
plant. The definition is
traditional rather than
scientific. It is
somewhat arbitrary and subjective, as it is determined by individual cultural
customs of cooking and food preparation.
Vegetables can be either whole plants or only some parts of
plants served with the main course of a meal. Apart from their nutritive value,
vegetables probably do more than any other group of foods to add appetizing
colour, texture and flavour to our daily food. By a proper choice of
vegetables, the desired flavour of meal can be obtained (SHAKUNTALA et al
2001).
2.1.3.i. CLASSIFICATION OF VEGETABLES
According to SHAKUNTALA (2001); vegetables are classified on
the basis of the parts consumed of the plants, such as roots, stems, flowers,
etc. However this may not be satisfactory as some parts of the plants may be
grouped under more than one heading. Hence, vegetables are subdivided into
groups based on their cultural requirements. On this basis, the commonly used
vegetables can be classified as follows:
a. Cole crops: Some examples of vegetables
of this group are cabbage (Brassica oleracea L.var capitata), and
cauliflower( Brassica oleracea L.var. botrytis).
b. Root vegetables: As examples of
vegetables of this group, we can say ; carrot (Daucus carota), and
beetroot (Beta vulgaris).
c. Cucurbits : As examples of vegetables
of this group, we can say; cucumber (Cucumis sativus), and pumpkin
(Cucurbita moschata).
d. Fruit vegetables : These are other
vegetables, apart from cucurbits, for which the edible part is the fruit. As
examples of vegetables of this group, we can say ; tomatoes (Lycopersicon
esculentum), pepper (Capsicum annuum), egg plant ( Solanum
melongena), and chow-chow or chayote (Sechium edule).
e. Green leafy vegetables: The main edible
parts of vegetables of this group are leaves. As examples of vegetables of
this group, we can say; amaranth ( The genus of Amaranthus), celery
( Apium graveolens, L. var duluce), and spinach
(spinacea oleracea).
f. Tuber vegetables: As examples of
vegetables of this group, we can say ; Irish potato(Solanum
tuberosum), sweet potato (Ipomoea batatus), and tapioca or
cassava (Manihot esculenta).
g. Bulbs: In this group of vegetables, the
edible part is the bulb. It contains vegetables such as onions (Allium
cepa), garlic (Allium sativum), and leek ( Allium
ampeloprasum var porrum ).
h. Perennial vegetables: This group contains
a number of vegetables, botanically unrelated, which are similar in that they
are perennials. Some of them are here mentioned as asparagus ( Asparagus
officinalis), and rhubarb ( Rheum rhaponticum).
i. Other vegetables: vegetables in this group
can be broadly classified under the following heads: leguminous vegetables,
drumstick ( Moringa oleifera), mashrooms (genus Agaricus
).
j. Salads: Salads are generally green
vegetables which are eaten uncooked.
2.1.3.ii. NUTRITIONAL COMPOSITION OF VEGETABLES
Vegetables are an important part of the human diet and a major
source of biologically active substances such as vitamins, dietary fiber,
antioxidants, and cholesterol-lowering compounds. Historically, the value of
many plant nutrients and health-promoting compounds was discovered by trial and
error. By the turn of the century, the application of chromatography, mass
spectrometry, infrared spectrometry, and nuclear magnetic resonance allowed
quantitative and qualitative measurements of a large number of plant
metabolites. Approximately 50000 metabolites have been elucidated in plants,
and it is predicted that the final number will exceed 200000. Most of them have
unknown function. Metabolites such as carbohydrates, organic and amino acids,
vitamins, hormones, flavonoids, phenolics, and glucosinolates are essential for
plant growth, development, stress adaptation, and defense. Besides the
importance for the plant itself, such metabolites determine the nutritional
quality of food, color, taste, smell, antioxidative, anticarcinogenic,
antihypertension, anti-inflammatory, antimicrobial, immunostimulating, and
cholesterol-lowering properties. This review is focused on major plant
metabolites that characterize the nutritional quality of vegetables. There are
here divided in primary and secondary metabolites.
2.1.3.ii.a. PRIMARY METABOLITES
Primary metabolites such as carbohydrates, amino acids, fatty acids,
and organic acids are involved in growth and development, respiration and
photosynthesis, and hormone and protein synthesis. Primary metabolites are
found across all species within broad phylogenetic groups, and are produced
using the same (or nearly the same) biochemical pathways.
?Carbohydrates
Carbohydrates in vegetables occur as sugar monosaccharides ,
disaccharides , sugar alcohols , oligosaccharides , and polysaccharides
(starch, pectins). In terms of their physiological or nutritional role,
carbohydrates are often classified as available and unavailable. Available
carbohydrates are those that are hydrolyzed by enzymes of the human
gastrointestinal system to monosaccharides such as sucrose and digestible
starch. Unavailable carbohydrates (sugar alcohols, many oligosaccharides, and
nonstarch polysaccharides) are not hydrolyzed by endogenous human enzymes. The
consumption of high dietary fiber foods has been found to reduce symptoms of
chronic constipation, diverticular disease, and some types of colitis. It has
been suggested that diets with low fiber may increase the risk of developing
colon cancer, cardiovascular diseases, and obesity (HOUNSOME et al
2008 )
?Proteins and amino acids
Proteins provide structural material for the human body and
function as enzymes, hormones, and antibodies. Vegetables contain all essential
amino acids, but some may be in lower proportions than are required for humans.
Besides the importance for human metabolism, free amino acids contribute to the
taste of vegetables (HOUNSOME et al 2008).
? Vitamin B complex
The vitamin B complex of vegetables includes the water-soluble
vitamins thiamine (B1), riboflavin (B2), nicotinic acid (B3, niacin),
pantothenic acid (B5), pyridoxine (B6), biotin (B7), and folic acid (B9).
Vitamin B deficiency can cause polyneuritis (thiamine), cheilosis, angular
stomatitis and dermatitis (riboflavin), pellagra, diarrhea, dermatitis and
dementia (nicotinic acid), seborrhea, glossitis, peripheral neuropathies and
microcytic anemia (pyridoxine), nausea, dermatitis (pantothenic acid, biotin),
and anemia (folic acid). Green leafy vegetables such spinach, Brussels sprouts,
cauliflower, turnip, and lettuce are good sources of B vitamins (HOUNSOME
et al 2008).
? Lipids and fatty acids
Green vegetables such as Chinese cabbage, Brussels sprouts,
watercress, and parsley are known to contain a relatively high proportion of
polyunsaturated fatty acids, primarily in the form of alpha-linolenic acid. The
consumption of monounsaturated fatty acids has been shown to reduce cholesterol
levels and have a beneficial effect on some of the traditional risk factors for
cardiovascular disease and type 2 diabetes (HOUNSOME et al
2008).
? Organic acids
Plants contain citric, acetic, malic, oxalic, succinic,
fumaric, quinic, tartaric, malonic, shikimic, aconitic, ascorbic acid ( Vitamin
C ), and other organic acids. Green vegetables generally contain low
concentrations of organic acids. Ascorbic acid, known as vitamin C, is an
organic acid with strong antioxidant properties. Vegetables rich in ascorbic
acid include spinach, spring onions, cress, cabbage, broccoli, cauliflower,
sweet peppers, peas, and beans. Because vitamin C is a strong biological
antioxidant, it is also linked to the prevention of degenerative diseases such
as cataracts, certain cancers, and cardiovascular disorders (HOUNSOME et
al 2008).
2.1.3.ii.b. SECONDARY METABOLITES
Plants produce a diverse assortment of
organic compounds that do not participate directly in growth and development.
These substances, traditionally called secondary metabolites, are often
differentially distributed among taxonomic groups within the plant kingdom.
Their functions, many of which remain unknown, and are being elucidated with
increasing frequency. But generally secondary metabolites such as flavonoids,
carotenoids, sterols, phenolic acids, alkaloids, and glucosinolates determine
the color of vegetables, protect plants against herbivores and microorganisms,
attract pollinators and seed-dispersing animals, and act as signal molecules
under stress conditions. According to the nomenclature adopted by the British
Nutrition Foundation, plant secondary metabolites can be divided into 4
major groups: phenolic and polyphenolic compounds (about 8000 compounds),
terpenoids (about 25000 compounds), alkaloids (about 12000 compounds), and
sulfur-containing compounds ( HOUNSOME et al 2008 ).
2.1.3.iii. EFFECT OF DRYING ON VEGETABLES
When drying foods, the key is to remove moisture as quickly as
possible at a temperature that does not seriously affect the flavour, texture
and colour of the food. If the temperature is too low in the beginning, micro
organisms may survive and even grow before the food is adequately dried. If the
temperature is too high and the humidity too low, the food may harden on the
surface. This makes it more difficult for moisture to escape and the food does
not dry properly.
Although drying is a relatively simple method of food
preservation, the procedure is not exact. A «trial and error»
approach often is needed to decide which techniques work best. Drying, like all
methods of preservation, can result in loss of some nutrients.
Nutritional changes that occur during drying include:
· Calorie content: does not change, but
it is concentrated into a smaller mass as moisture is removed.
· Fiber: no change.
· Vitamin A: fairly well retained under
controlled heat methods.
· Vitamin C: mostly destroyed during
blanching and drying of vegetables.
· Thiamine, riboflavin, niacin: some
loss during blanching but fairly good retention if the water used to rehydrate
also is consumed.
· Minerals: some may be lost during
rehydration if soaking water is not used. Iron is not destroyed by drying.
For best retention of nutrients in dried vegetables, they
must be stored in a cool, dark, dry place and use within a year ( KENDALL
et al 2006 ).
2. 2. SOME VEGETABLES ( INGREDIENTS ) USED
2.2.1. SPINACH
a. Description: Spinach (Spinacia
oleracea) is a flowering plant in the family of Amaranthaceae. It is
native to central and southwestern Asia. It is an annual plant (rarely
biennial), which grows to a height of up to 30 cm. Spinach may survive over
winter in temperate regions. The leaves are alternate, simple, ovate to
triangular-based, very variable in size from about 2-30 cm long and 1-15 cm
broad, with larger leaves at the base of the plant and small leaves higher on
the flowering stem. The flowers are inconspicuous, yellow-green, 3-4 mm
diameter, maturing into a small hard dry lumpy fruit cluster 5-10 mm across
containing several seeds (
www.wikipedia.org/wiki/spinach,
29/5/2008).
b. Classification
Kingdom: Plantae Division: Magnoliophyta Class:
Magnoliopsida Order: Caryophyllales Family: Amaranthaceae,
Genus: Spinacia Species: S. oleracea
Binomial name Spinacia
oleracea
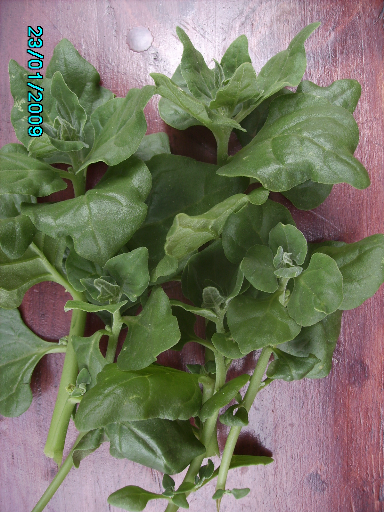
Figure 2.2.1 : Picture of spinach c. Nutritional
value per 100g
Table 2.2.1
Nutritional value of spinach
2.2.2. POTATOES
a. Description: Potato is the term which
applies either to the
starchy,
tuberous
root vegetable crop
from the various subspecies of the
perennial plant
Solanum tuberosum of the
Solanaceae, or
nightshade, family, or to
the plant itself. There is general agreement among contemporary botanists that
potato species originated in the
Andes, all the way from
Colombia and
Venezuela to
Chile and northern
Argentina, but with a
concentration of
genetic diversity,
both in the form of cultivated and wild species, in the area of modern day
Peru. The evidence thus far
shows that the potato was first cultivated in Peru some 7,000 years ago. The
potato was introduced to Europe around 1700, and subsequently by European
mariners to territories and ports throughout the world. The English
word potato comes from
Spanish
patata (the name used in
Spain). Another common name is
"ground apple": pomme de terre in
French. Potato
plants grow high to the ground and bear yellow to silver
flowers with yellow
stamens. Potatoes are
cross-pollinated mostly
by
bumblebees that carry
pollen from other potato plants, but a substantial amount of self-fertilizing
occurs as well. Any potato variety can also be
propagated
vegetatively by planting tubers, pieces of tubers, cut to include at least
one or two eyes, or also by cuttings, a practice used in greenhouses for the
production of healthy seed tubers (
www.wikipedia.org/wiki/potato
,29/5/2008).
b. Classification
Kingdom:
Plantae
Division:
Magnoliophyta
Class:
Magnoliopsida
Subclass:
Asteridae
Order:
Solanales
Family:
Solanaceae
Genus:
Solanum
Species: S. tuberosum
Binomial
name
Solanum tuberosum
c. Picture
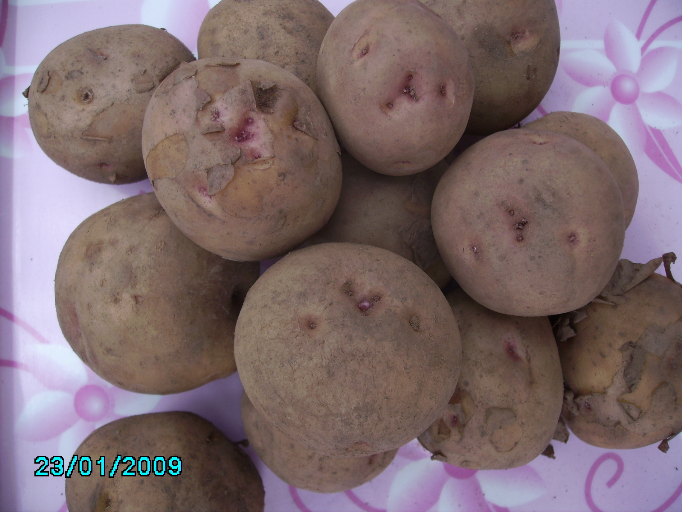
Figure 2.2.2 : Picture of potatoes
d. Nutritional value per
100 g
Table 2.2.1 Nutritional value of potato
2.2.3. LEEK
a. Description: The leek , Allium
ampeloprasum var. porrum (L.), also sometimes known as Allium
porrum, is a vegetable which belongs, along with the
onion and
garlic, to the
Alliaceae family.
Two related vegetables, the
elephant garlic and
kurrat, are also variant
subspecies of
Allium
ampeloprasum, although different in their uses as food. The
edible part of the leek plant is sometimes called a
stem, though technically
it is a bundle of leaf sheaths. Rather than forming a tight bulb like the
onion, the leek produces a long cylinder of bundled leaf sheaths which are
generally blanched by pushing soil around them (trenching)(
www.wikipedia.org/wiki/leek,29/5/2008).b.
classification
Kingdom:
Plantae
Division:
Magnoliophyta
Class:
Liliopsida
Order:
Asparagales
Family:
Alliaceae
Genus:
Allium
Species:
A.
ampeloprasum
Subspecies: A. ampeloprasum var. porrum
Trinomial
nameAllium ampeloprasum var. porrum
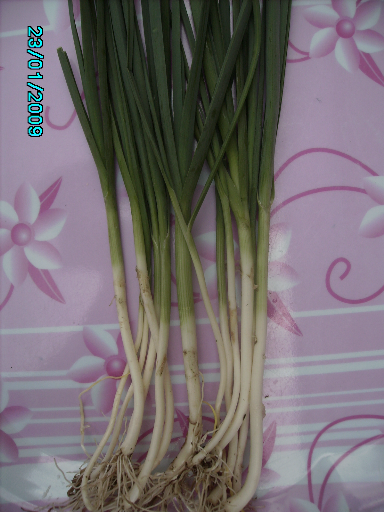
Figure 2.2.3 : Picture of leek
2.2.4. PEPPER
a. Description : Yellow pepper (Piper nigrum) is a
flowering
vine in the family
Piperaceae, cultivated
for its
fruit, which is usually dried
and used as a
spice and
seasoning. The same fruit
is also used to produce white pepper, red/pink pepper, and green pepper. Black
pepper is native to
South India and is
extensively cultivated there and elsewhere in tropical regions. The
fruit, known as a peppercorn
when dried, is a small
drupe five millimetres in
diameter, dark red when fully mature, containing a single
seed. Dried ground pepper is
one of the most common spices in European
cuisine and its descendants,
having been known and prized since antiquity for both its flavour and its use
as a
medicine. The spiciness of
black pepper is due to the chemical
piperine. Ground black
peppercorn, usually referred to simply as "pepper", may be found on nearly
every dinner table in some parts of the world, often alongside
table salt (
www.wikipedia.org/wiki/pepper,
29/5/2008).
b. Classification
Kingdom:
Plantae
Division:
Magnoliophyta
Class:
Magnoliopsida
Order:
Piperales
Family:
Piperaceae
Genus:
Piper
Species: P. nigrum
Binomial
name
Piper nigrum
c. Picture
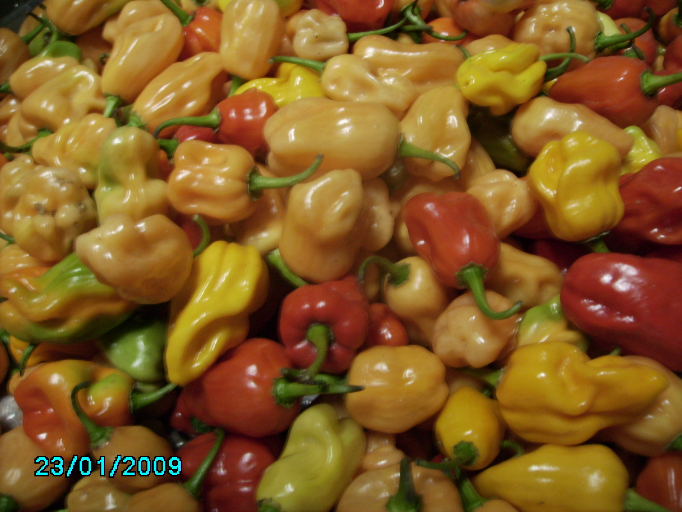
Figure 2.2.4 : Picture of pepper
2.2.5. TOMATOES
a. Description : The tomato (Solanum
lycopersicum) is a
plant in the
Solanaceae or
nightshade family, as are
its close cousins
tobacco,
chili peppers,
potato, and
eggplant. The tomato is
native to
Central,
South, and southern
North America from
Mexico to
Argentina. It is a
perennial, often
grown outdoors in temperate climates as an
annual, typically
reaching to 1-3 m (3 to 10 ft) in height, with a weak, woody stem
that often vines over other plants. The
leaves are 10-25 cm long,
odd pinnate, with 5-9 leaflets on petioles, each leaflet up to 8 cm long,
with a serrated margin; both the stem and leaves are densely glandular-hairy.
The
flowers are 1-2 cm
across, yellow, with five pointed lobes on the
corolla; they
are borne in a
cyme of 3-12 together. The word
tomato derives from a word in the
Nahuatl language,
tomatl. The
specific name,
lycopersicum, means "wolf-peach" (compare the related species
Et.alycocarpum, whose
scientific
name means "wolf-fruit", common name "wolf-apple") (
www.wikipedia.org/wiki/tomato
,29/5/2008).
b. Classification
Kingdom:
Plantae
Subkingdom:
Tracheobionta
Division:
Magnoliophyta
Class:
Magnoliopsida
Subclass:
Asteridae
Order:
Solanales
Family:
Solanaceae
Genus:
Solanum
Species: Et.alycopersicum
Binomial
name
Solanum lycopersicum
Synonyms
Lycopersicon lycopersicum
Lycopersicon
esculentum
c. Picture
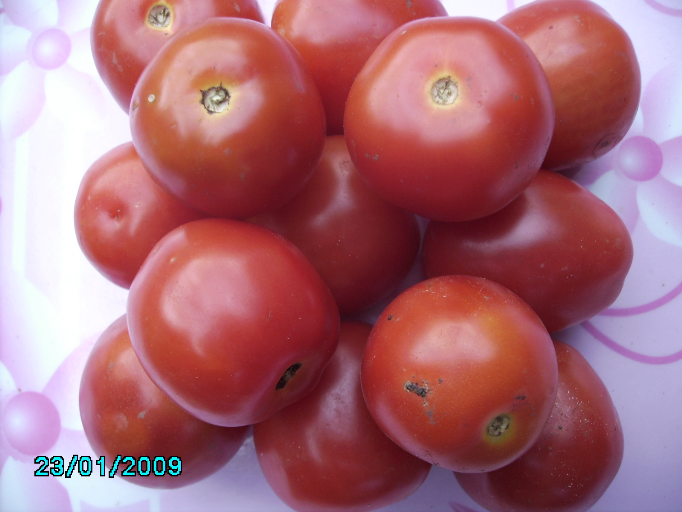 Figure 2.2.5 : Picture of tomatoes
d.
Nutritional value per 100 g
Table 2.2.1 Nutritional value of
tomato
2.2.6. CELERY
a. Description : Apium graveolens is
a
plant species in the family
Apiaceae, and yields two
important vegetables known as celery and
celeriac.
Cultivars of the species
have been used for centuries, whilst others have been domesticated only in the
last 200-300 years. The
petiole is main
the part consumed. Apium graveolens is used around the world as a
vegetable, either for the crisp petiole (leaf stalk) or fleshy taproot. In
temperate countries, celery is also grown for its seeds, which yield a valuable
volatile oil used in the perfume and pharmaceutical industries. Celery seeds
can be used as flavouring or spice either as whole seeds or, ground and mixed
with salt, as celery salt (
www.wikipedia.org/wiki/celery
,29/5/2008).
b. classification
Kingdom:
Plantae
Division:
Magnoliophyta
Class:
Magnoliopsida
Order:
Apiales
Family:
Apiaceae
Genus:
Apium
Species: graveolens
Binomial
name
Apium graveolens
c. Picture
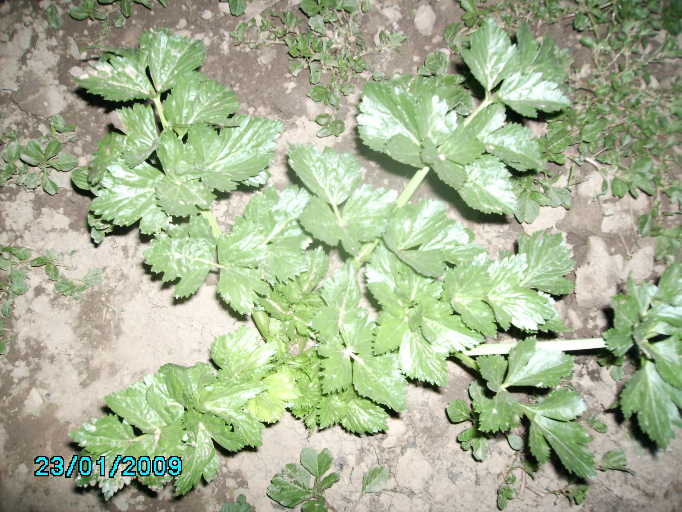
Figure 2.2.6 : Picture of celery
d. Celery, raw
Nutritional value per 100 g
Table 2.2.1 Nutritional value of
celery
2.2.7. CARROT
a. Description: The carrot (Daucus
carota subsp. sativus) is a
root vegetable,
usually
orange or white,
or red-white blend in colour, with a crisp texture when fresh. The edible part
of a carrot is a
taproot. It is a
domesticated form of the
wild carrot Daucus
carota, native to
Europe and southwestern
Asia. It has been bred for its
greatly enlarged and more palatable, less woody-textured edible taproot, but is
still the same species. It is a
biennial plant which
grows a rosette of leaves in the spring and summer, while building up the stout
taproot, which stores large amounts of
sugars for the
plant to flower in the second
year. The flowering stem grows to about 1 metre (3 ft) tall, with an
umbel of white flowers.
Carrots can be eaten in a variety of ways. They are often chopped and boiled,
fried or steamed, and cooked in
soups and
stews, as well as baby and pet
foods.
Carrot juice is also
widely marketed, especially as a health drink, either stand-alone or blended
with fruits and other vegetables. The carrot gets its characteristic and bright
orange colour from
â-carotene, which is
metabolised into
vitamin A in humans when
bile salts are present in
the intestines. Massive overconsumption of carrots can cause
hypercarotenemia, a
condition in which the skin turns orange (although effects are less dangerous
than those of vitamin A, which can cause liver damage). Carrots are also rich
in
dietary fibre,
antioxidants, and
minerals. Lack of
Vitamin A can cause poor vision, including night vision, and vision can be
restored by adding Vitamin A back into the diet (
www.wikipedia.org/wiki/carrot,
29/5/200).b. classification
Kingdom:
Plantae
Division:
Magnoliophyta
Class:
Magnoliopsida
Order:
Apiales
Family:
Apiaceae
Genus:
Daucus
Species: D. carota
Binomial
name
Daucuscarota
c. Picture
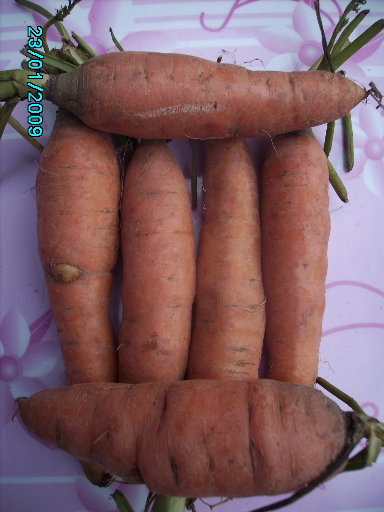
Figure 2.2.7 : Picture of carrot d. Nutritional value
per 100 g
Table 2.2.1 Nutritional value of
carrot 2.2.8. ONION
a. Description : Onion is a term used by many
plants in the genus
Allium. They are
known by the common name "onion" but, used without qualifiers, it usually
refers to Allium cepa. Allium cepa is also known as the
'garden onion' or '
bulb' onion and '
shallot'. Allium
cepa is known only in cultivation, but related wild species occur in
Central Asia. The most closely-related species include Allium
vavilovii and Allium asarense from Iran. However there are
doubts whether the vavilovii collections tested represent genuine wild
material or only feral derivatives of the crop (
www.wikipedia.org/wiki/onion
,29/5/2008).
b. classification
Kingdom:
Plantae
Division:
Magnoliophyta
Class:
Liliopsida
Order:
Asparagales
Family:
Alliaceae
Genus:
Allium
Species: A. cepa
Binomial
name
Allium cepa
c. Pictures
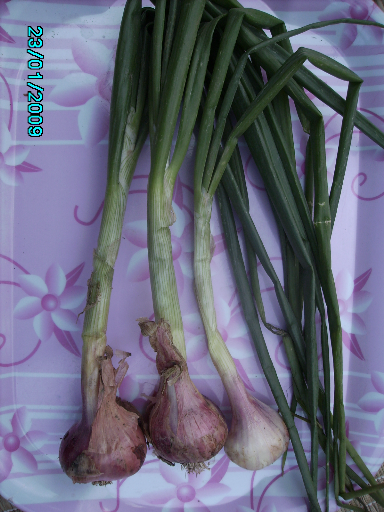
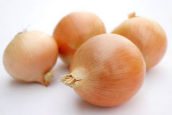
Figure 2.2.8 : Picture
of onion
d. Nutritional
value per 100 g
Table 2.2.1 Nutritional value of onion
2.2.9. GARLIC
a. Description : Allium sativum
L., commonly known as garlic, is a species in the
onion family
Alliaceae. Its close
relatives include the
onion, the
shallot, and the
leek. Garlic
has been used throughout recorded history for both
culinary and
medicinal purposes. It has
a characteristic pungent, spicy flavor that mellows and sweetens considerably
with cooking. A bulb of garlic, the most commonly used part of the plant, is
divided into numerous fleshy sections called
cloves.
The cloves are used as seed, for consumption (raw or cooked), and for medicinal
purposes. The leaves, stems (
scape) and
flowers (bulbils) on the head (spathe) are also edible and most often consumed
while immature and still tender (
www.wikipedia.org/wiki/garlic ,
29/5/2008 ).
b. Classification
Kingdom:
Plantae
Division:
Magnoliophyta
Class:
Liliopsida
Order:
Asparagales
Family:
Alliaceae
Subfamily: Allioideae
Tribe: Allieae
Genus:
Allium
Species: A. sativum
Binomial
name Allium sativum
c. Picture

Figure
2.2.9 : Picture of garlic
d.Nutritional
value per 100 g
Table 2.2.1 Nutritional value of
garlic
e. Garlic and cardiovascular diseases
Epidemiological, clinical, and laboratory studies have
reported that garlic contains many biologically and pharmacologically active
compounds. The majority of studies show that garlic lowers total serum
cholesterol and LDL-cholesterol; inhibition of HMG-CoA reductase or squalene
epoxidase appears to be the major mechanism. Lowering of blood pressure likely
results from inhibition of angiotensin-converting enzyme activity.
Antithrombosis effects may be related to inhibition of adenosine deaminase.
Antioxidant effects may be related to the inhibition of lipoxygenase. The
published studies in their aggregate suggest that appropriate usage of allium
derivatives from garlic may potentially play a role in the maintenance of
optimal cardiac function. However, further research is needed to examine the
structure-function relationships of the various allium derivatives of garlic,
the amounts in foods and supplements required for efficacy, and the possible
effects of combining garlic with other nutrients and medications.
The mechanisms of action of allium derivatives on
various aspects of cardiac function require further clarification ( MICHELLE
et al, 2000 ).
Chapter Three : MATERIALS AND METHODS
3.1. RESEARCH DESIGN
In conduction of this research, the work was partitioned and
designed as follows:
- Drying of the vegetables: Vegetables were
dried before being grinded and mixed. The drying
operation was done at Kabagali in Ruhango district.
- Food formulation and development: This was
achieved by proceeding as follows:
- Formulation of six different soups and carry out the first
sensory analysis in order to choose one.
( the most appreciated )
- Reformulation of the chosen soup according to the results of
the first sensory analysis, setting a cooking method, and carry out a second
sensory analysis.
- Consumer acceptability check : By the use
of questionnaire, the researcher gave his product
to the selected panelists and checked for consumer
acceptability
- Laboratory analysis: This was done so as to
know the chemical composition, and the nutritive
value of the soup.
- Pricing mechanism : This was done for
checking what would have to be price of the formulated food, so as to know
whether the production of that product would be economically significant or not
and if it would be affordable.
3.2. SOURCE OF RAW MATERIALS
Except tomatoes and potatoes that were bought in Kabagali
market, all other vegetables used as ingredients (carrots, celery, garlic,
leek, onion, pepper, and spinach), were bought in Kimisagara market, trying
to chose the best ones on sight and the most fresh, and then were transported
at ambient temperature up to Kabagali where they were subjected to further
treatments.
3.3. EXPERIMENTAL PROCEDURES
3.3.1. PREPARATION AND DRYING OF THE
VEGETABLES
5 Kg of carrots, 1.5 Kg of celery, 1 Kg of garlic, 1 Kg of
leek, 3 Kg of onion, 1 Kg of pepper, 3 Kg of potatoes, 3 Kg of spinach and 7.4
Kg of tomatoes were weighed with a balance. All these vegetables were then
washed with plenty of water and carrots, onions, potatoes and tomatoes were
peeled with a kitchen stainless steel knife prior to slicing. After that, all
the vegetables were sliced into small size particles with means of a kitchen
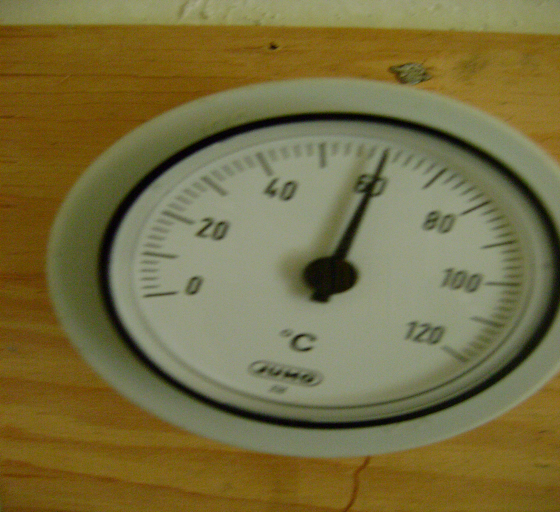
stainless steel knife or rape and then put into the hybrid dryer. The
starting and the end time, as well as the temperature inside the dryer were
both recorded.
3.3.2. FOOD FORMULATION AND DEVELOPMENT
3.3.2.i. FOOD FORMULATION PROPOSAL
In formulating the soup, six different types of soups,
which were different in the composition of some ingredients such as
potatoes, carrots and tomatoes, were proposed to people, and these ones were
allowed to evaluate and criticize them.
The main differences were that;
- Soup A was rich in potatoes, but poor in carrots and
tomatoes
- Soup B was medium in potatoes and carrots but poor in
tomatoes
- Soup C was medium in potatoes and tomatoes but poor in
carrots
- Soup D was poor in potatoes, but medium in carrots and
tomatoes
- Soup E was rich in carrots but poor in potatoes and
tomatoes
- Soup F was rich in tomatoes but poor in potatoes and
carrots
The composition of each type of soup is shown in the table
below
|
Composition per soup ( in % )
|
|
Ingredients
|
Soup A
|
Soup B
|
Soup C
|
Soup D
|
Soup E
|
Soup F
|
|
Potatoes
|
50
|
30
|
30
|
10
|
10
|
10
|
|
Carrot
|
10
|
30
|
10
|
30
|
50
|
10
|
|
Tomatoes
|
10
|
10
|
30
|
30
|
10
|
50
|
|
Spinach
|
5.5
|
5.5
|
5.5
|
5.5
|
5.5
|
5.5
|
|
Onion
|
8
|
8
|
8
|
8
|
8
|
8
|
|
Garlic
|
5.5
|
5.5
|
5.5
|
5.5
|
5.5
|
5.5
|
|
Leek
|
5.5
|
5.5
|
5.5
|
5.5
|
5.5
|
5.5
|
|
Celery
|
3
|
3
|
3
|
3
|
3
|
3
|
|
Pepper
|
2.5
|
2.5
|
2.5
|
2.5
|
2.5
|
2.5
|
Table 3.3.2 composition of six
proposed soups
3.3.2.ii. FIRST SENSORY ANALYSIS
Using a questionnaire ( see appendix 1 ), a sensory analysis
was done in order to know and choose one most suitable soup. A selected panel
of ten untrained panelists, was asked to take on each of the six soups and
evaluate them by answering the questionnaire.
Data collected were assessed by analyzing the mean and the
most accepted ( liked ) soup would have to be modified according to the
consumer's suggestions, and taking into consideration the basic scientific
principles.
3.3.2.iii. REFORMULATION AND SECOND SENSORY
ANALYSIS
Based on the results of the first sensory analysis, the
researcher tried to modify the most accepted (liked) soup in order to meet the
consumer preferences. This was done by taking into consideration the
suggestions and recommendations given by the consumers on the first sensory
analysis. For example the quantity of pepper was reduced from 2.5% up to 1%,
and little cooking oil was included during cooking.
For establishing a good and correct cooking time, a second
sensory analysis was carried out.
Three identical samples were prepared and cooked for different
intervals of period and a six untrained panelists tested the three soups and
answered a questionnaire ( see appendix 2 ).
For the first sample, 50g of food were taken, mixed with
800ml of water and 5ml of oil and then cooked for 15
minutes.
For the second sample, 50g of food were taken, mixed with
850ml of water and 5ml of oil and then cooked for 20 minutes.
For the third on, 50g of food were taken, mixed with 900ml of
water and 5ml of oil
and then cooked for 25 minutes.
3.3.3. CONSUMER ACCEPTABILITY CHECK
In order to know whether the researcher has met the consumer
needs and preferences or not, and to be sure that the new product will be sold
on the market, he carried out the consumer acceptability check.
This was achieved by using questionnaire ( see appendix 3 ),
where fifteen untrained panelists were asked to assess all the characteristics
of the product, as well as its packaging and its labeling, and rate them using
a five-point hedonic scale that was provided. The product was firstly evaluated
before being opened, then after opening and lastly after being consumed.
3.3.3.i. STATISTICAL METHODS USED
One Way ANOVA (Analysis Of the Variance) statistical
method, and analysis of the mean, as well as computer software( MS EXCEL ) were
used to analyze the data obtained from sensory evaluation.
3.4.4. LABORATORY ANALYSIS
The soup formulated was analyzed in the laboratory so as to
know its chemical composition, and its nutritive value.
This was so important since, those information would have to
be indicated on the label.
Thus, it was analyzed for the moisture content, ash and
mineral content, carbohydrates, fat content, protein content and Vitamin C
content.
The following are the procedures for all these analysis.
3.3.4.i. MOISTURE CONTENT DETERMINATION
The moisture content of the formulated food was checked in
order to be able to estimate its storage stability and shelf life. It was also
necessary to be checked so as to write its true value on the label.
For this a sample for moisture content determination was sent
to the laboratory of ISAR - Rubona for being analyzed. The procedure used is as
follows.
Different samples of the mixture (formulated food), were
weighed and dried again in the microwave oven, being cooled and weighed at
some intervals of time, until difference became less than 1.0 mg for 30minutes
heating.
By calculation (W1- W2)
the weight of moisture evaporated was determined.
Then, the percentage moisture content was obtained as
follows:
where W1 =Weight of sample before
drying
%Moisture =  W2 =Weight of sample after
drying
W2 =Weight of sample after
drying
3.3.4.ii. ASH AND MINERAL CONTENT
DETERMINATION
As the formulated food had to be packed and well labeled, it
has been necessary to determine its ash and mineral content so as to write the
true value on the label.
For this a sample for ash and mineral content determination
was sent to the laboratory of
ISAR - Rubona for being analyzed. The procedure used is as
follows.
- A laboratory sample of food to be analyzed was weighed
accurately (W1)
- Incinerate the sample by heating it in a muffle furnace on a
temperature of 500°C-600°C,
for a period of 2-5hours
- Cool to room temperature in a desiccator and
weigh.
- Repeat the procedure until difference becomes less
than 1.0 mg for 30 min heating
- Weigh the ash remaining
(W2)
- Carry out the calculations to get the value of ash
content.
%Ash content = 
3.3.4.iii. CARBOHYDRATES CONTENT
DETERMINATION
As the formulated food would have to be packed and well
labeled, it was necessary to determine its carbohydrate content so as to write
the true value on the label.
A sample for carbohydrate content determination was sent to
the laboratory of ISAE - Busogo for being analyzed and analysis was done by
Lane-Eynon method (see appendix 4)
3.3.4.iv. FAT CONTENT DETERMINATION
Lipids are one of the major constituents of the foods, and an
important source of energy. Nevertheless, over-consumption of certain lipid
components such as cholesterol and saturated fats can be detrimental to our
health. Because of that, the formulated food has been analyzed for the fat
content and the true value is indicated on the label.
A sample for fat content determination was sent to the
laboratory of ISAR - Rubona for being analyzed.
In order to determine the fat content of the food the soxhlet
method ( see appendix 5) was used .
3.3.4.v. PROTEIN CONTENT DETERMINATION
T he protein content of the food was determined in order to
get true value that will be put on the label.
A sample for protein content determination was sent to the
laboratory of ISAE - Busogo for being analyzed.
The protein content of the food was analyzed by the Kjeldahl
method ( see appendix 6 ).
3.3.4.vi. VITAMIN C CONTENT
DETERMINATION
Vitamin C (in vegetables) is very heat sensitive. Hence, it is
possible that during drying, the vitamin C content of different ingredients may
decrease considerably.
Experiments for determining the vitamin C content of the
formulated food, were carried out in KIST food processing laboratory, by using
the method of Indophenol solution ( see appendix 7 ).
3.5. PRICING MECHANISM
For calculating the average cost of production per unit, all
the expenses made during the research ( cost of ingredients, transport,
energy, and labor ) were calculated as well as the tools and machinery buying
up. Then , the price of the formulated food were estimated by applying a
reasonable benefit margin of 15%.
Chapter Four : RESULTS AND DISCUSSION
A flavoured organic soup was developed as explained in chapter
three. This chapter four , focuses on the results obtained from different
experiments, and from sensory evaluation as well as their discussion.
These results are presented and discussed in the same order as
the steps of the research design.
4.1. DRYING OF THE VEGETABLES
The results obtained from the experiment of drying are
summarized in the table below
|
Vegetable
|
Mass before preparation ( Kg )
|
Mass after preparation & before drying ( Kg
)
|
Mass after drying
( Kg )
|
Water evaporated
( Kg )
|
Drying time
( hours )
|
Drying T°
( °C )
|
|
Carrot
|
5
|
3.80
|
0.36
|
3.44
|
9
|
60
|
|
Celery
|
1.5
|
1.00
|
0.08
|
0.92
|
4
|
|
Garlic
|
1
|
0.82
|
0.26
|
0.56
|
10
|
|
Leek
|
1
|
0.80
|
0.06
|
0.74
|
7
|
|
Onion
|
3
|
2.00
|
0.28
|
1.72
|
6
|
|
Pepper
|
1
|
0.96
|
0.17
|
0.79
|
6
|
|
Potatoes
|
3
|
1.88
|
0.50
|
1.38
|
6
|
|
Spinach
|
3
|
2.60
|
0.18
|
2.42
|
8
|
|
Tomatoes
|
7.4
|
6.00
|
0.48
|
5.52
|
12
|
Table 4.1 results from the experiment of drying
The following is one of the pictures taken after the drying
process
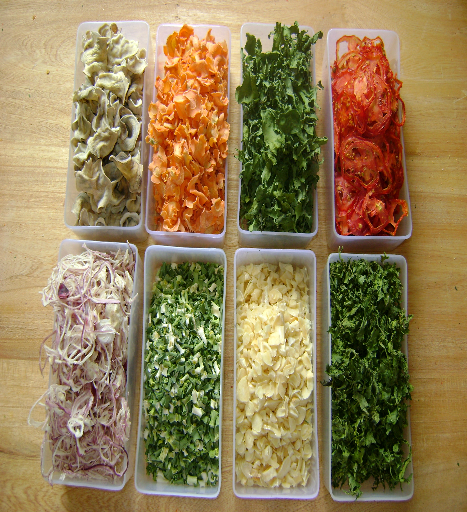
Figure 4.1: dried vegetables
(after the process)
As it can be observed in the table, the drying time was
affected by the initial moisture content, and the structure of vegetables.
That is why tomatoes ( with high moisture content) have a long drying time,
followed by garlic which the structure does not allow easy removal of water.
4.2. FOOD FORMULATION AND DEVELOPMENT
4.2.1. FIRST SENSORY ANALYSIS
From six different soups proposed, a questionnaire was used
for sensory analysis in order to know and choose one most suitable soup.
The table below shows the mean score of the results obtained
by each of sensory attributes assessed for the six soups (in percentage).
|
Score obtained by different soup ( in % )
|
|
Soup A
|
Soup B
|
Soup C
|
Soup D
|
Soup E
|
Soup F
|
|
Appearance
|
54
|
62
|
60
|
62
|
69
|
58
|
|
Aroma
|
55
|
53
|
53
|
55
|
65
|
56
|
|
Colour
|
62
|
60
|
58
|
55
|
66
|
59
|
|
Taste
|
55
|
56
|
58
|
56
|
62
|
57
|
|
Texture
|
56
|
57
|
53
|
53
|
60
|
60
|
|
Overall acceptability
|
49
|
58
|
54
|
57
|
67
|
53
|
Table 4.2.1 results of the first sensory analysis
As you can see in the table, the fifth soup (Soup E) was the
most appreciated with respect to all characteristics, and had a record of 67%
in overall acceptability.
However, at this step, there were also many other suggestions
and recommendations; 69% of the panelists suggested to reduce the quantity of
pepper, 18% wanted it to be removed, while 13% did not say anything about it.
With that 72% of them said that the palatability could be increased by
addition of little cooking oil, and 58% recommended the cooking time to be
lengthened.
4.2.2. REFORMULATION OF THE FOOD AND SECOND SENSORY
ANALYSIS
Based on the results of the first sensory analysis, the most
appreciated food (soup E) was reformulated in order to meet the consumer
preferences.
The final composition of the food formulated was established
as follows:
|
Ingredients
|
Quantity
|
|
Carrot
|
50%
|
|
Potatoes
|
10%
|
|
Tomatoes
|
10%
|
|
Onion
|
8%
|
|
Garlic
|
6%
|
|
Spinach
|
5%
|
|
Leek
|
5%
|
|
Celery
|
3%
|
|
Salt
|
2%
|
|
Pepper
|
1%
|
Table 4.2.2.a : composition of the formulated
soup
The flow chart of the flavoured dry vegetable soup development
was established as follows:
Carrots
Celery
Garlic
Onion
Pepper
Potatoes
Spinach
Leek
Tomatoes
Peeling and / or Slicing
Washing
Packaging
Mixing
Weighing
Drying
Blending
Figure
4.2.2 : flow chart of soup development
After reformulation of the soup that was liked, the researcher
carried out a second sensory analysis for establishing good and correct
cooking method and time.
Three identical samples were prepared and cooked for different
intervals of period as described in chapter three. The following are the mean
score of the results obtained by each of the sensory attributes assessed for
the three soups (in percentage).
|
Score obtained by different soup ( in % )
|
|
Soup1
|
Soup2
|
Soup3
|
|
Appearance
|
96
|
93
|
94
|
|
Aroma
|
75
|
82
|
80
|
|
Colour
|
92
|
90
|
92
|
|
Taste
|
95
|
95
|
89
|
|
Texture
|
87
|
85
|
87
|
|
Overall acceptability
|
94
|
90
|
91
|
Table 4.2.2.b : results of the second sensory analysis
Observations
- The first soup (cooked for 15 min) is the most
appreciated, but 16% of the panelists said that they could still feel
some little undercooked odour.
- The last two soups did not have the same undercooking sign
odour, but also have lost some of the good flavour found in soup1
- The consistence and the taste are almost the same for all
the three soups.
4.3. CONSUMER ACCEPTABILITY CHECK
As discussed in chapter three, In order to know whether the
consumer needs and preferences were met or not, and to be sure that the new
flavoured dry vegetable soup could be sold on the market, the consumer
acceptability check was carried out. This was achieved by using questionnaire
(See appendix 3).
The following are the summaries of the results obtained on
each step.
4.3.3. BEFORE OPENING
Before opening, four attributes ( appearance, aroma, colour
and texture ) were assessed. The following is the table showing the mean scores
of the results obtained by each of those attributes.
|
Attributes
|
Mean Scores
|
|
Appearance
|
4.2666667
|
|
Aroma
|
4.2
|
|
Colour
|
4.2666667
|
|
Texture
|
4.2
|
Table 4.3.1.a : results of consumer acceptability check
(before opening).
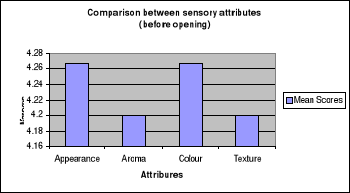
Figure 4.3.1 : graph of comparison between sensory attributes
( before opening )
As it can be observed from the above figure and table
comparing the mean scores of the attributes of the flavoured dry vegetable
soup, before opening, appearance and color were most appreciated by the
panelists over other attributes. Aroma and texture were appreciated at the same
level. However, there was in general very little and non-significant difference
in the appreciation of the attributes. This was confirmed by subjecting the
results to the analysis of the variance, and its results are summarized in the
tables below.
|
SUMMARY
|
|
|
|
|
|
|
Attributes
|
N. of panelists
|
Totals
|
Mean values
|
Variance
|
|
|
|
Appearance
|
15
|
64
|
4.26666667
|
0.35238095
|
|
|
|
Aroma
|
15
|
63
|
4.2
|
0.31428571
|
|
|
|
Colour
|
15
|
67
|
4.46666667
|
0.55238095
|
|
|
|
Texture
|
15
|
63
|
4.2
|
0.45714286
|
|
|
|
|
|
|
|
|
|
|
ANALYSIS OF VARIANCE
|
|
|
|
|
|
|
Source of variations
|
SS
|
df
|
MS
|
F
|
P-value
|
F crit
|
|
Between Groups
|
0.71666667
|
3
|
0.23888889
|
0.57007576
|
0.63703944
|
2.76943095
|
|
Within Groups
|
23.4666667
|
56
|
0.41904762
|
|
|
|
|
|
|
|
|
|
|
|
Total
|
24.1833333
|
59
|
|
|
|
|
Table 4.3.1.b : summary of results of ANOVA ( before opening
)
Since calculated F-Coefficient 0.57007576 was less than
Tabulated F-Coefficient 2.76943095, it led to the conclusion that there was
no significant difference (p = 0.05) between mean scores of the five point
hedonic scale results of the flavoured dry vegetable soup, before opening.
4.3.4. AFTER OPENING
After opening and preparing the soup, five attributes
(appearance, aroma, colour, taste and texture), as well as the overall
acceptability, were assessed. The following is the table showing the mean
scores of the results obtained by each of those attributes and that of overall
acceptability.
|
Attributes
|
Mean Scores
|
|
Appearance
|
4.5333333
|
|
Aroma
|
4.466667
|
|
Colour
|
4.6
|
|
Taste
|
4.2
|
|
Texture
|
4.33333
|
|
Ov. acceptability
|
4.2
|
Table 4.3.2.a : results of consumer acceptability check (after
opening)
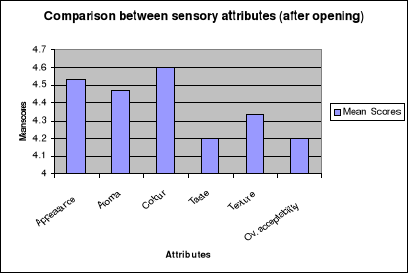
Figure 4.3.2 : graph of comparison between sensory attributes
( after opening )
From the above figure and table, it was evident that the
colour of the flavoured dry vegetable soup developed was the most appreciated
attributes, followed by appearance, aroma, texture and taste respectively. The
fact that taste was not appreciated as other sensory attributes may be due to
the fact that panelists used were not trained and specialists of sensory
evaluation or on the fact that people are not used to the special flavour
developed by mixing different flavour raising ingredients such as garlic,
celery, leek and onion together.
However, the score of overall acceptability shown that the
flavoured dry vegetable soup developed was acceptable to almost all the
panelists. This was also confirmed, by subjecting the results to the analysis
of the variance, and its results are summarized in the tables below.
|
SUMMARY
|
|
|
|
|
|
|
Attributes
|
N. of panelists
|
Totals
|
Mean values
|
Variance
|
|
|
|
Appearance
|
15
|
68
|
4.53333333
|
0.26666667
|
|
|
|
Aroma
|
15
|
67
|
4.46666667
|
0.40952381
|
|
|
|
Colour
|
15
|
69
|
4.6
|
0.25714286
|
|
|
|
Taste
|
15
|
63
|
4.2
|
0.6
|
|
|
|
Texture
|
15
|
65
|
4.33333333
|
0.66666667
|
|
|
|
Ov. acceptability
|
15
|
63
|
4.2
|
0.45714286
|
|
|
|
|
|
|
|
|
|
|
ANALYSIS OF VARIANCE
|
|
|
|
|
|
|
Source of variations
|
SS
|
df
|
MS
|
F
|
P-value
|
F crit
|
|
Between Groups
|
2.18888889
|
5
|
0.43777778
|
0.98853047
|
0.42976752
|
2.3231265
|
|
Within Groups
|
37.2
|
84
|
0.44285714
|
|
|
|
|
|
|
|
|
|
|
|
Total
|
39.3888889
|
89
|
|
|
|
|
Table 4.3.2.b : summary of results of ANOVA ( after opening
)
Since calculated F-Coefficient 0.98853047 was less than
Tabulated F-Coefficient 2.3231265, it led to the conclusion that there was no
significant difference (p = 0.05) between mean scores of the five point hedonic
scale results of the flavoured dry vegetable soup after opening. Therefore, the
hypothesis stating that « Food processing under guidance of consumer
needs, allows to achieve his satisfaction.» was verified. Hence, the
product was accepted.
4.3.5. COMPARISON OF ACCEPTABILITY BEFORE AND AFTER
OPENING
The results of consumer acceptability check obtained before
and after opening were compared so as to see whether the impression given by
the product to the consumers before opening was conserved or not. The
following table shows the summary of the comparison.
|
Attributes
|
Mean scores obtained
|
|
Before opening
|
After opening
|
|
Appearance
|
4.2666667
|
4.5333333
|
|
Aroma
|
4.2
|
4.466667
|
|
Colour
|
4.2666667
|
4.6
|
|
Taste
|
_____
|
4.2
|
|
Texture
|
4.2
|
4.33333
|
|
Ov. acceptability
|
_____
|
4.2
|
Table 4.3.3. : comparison of acceptability before and after
opening
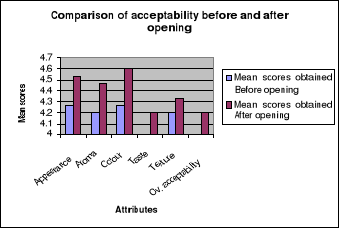
Figure 4.3.3. : graph of comparison of acceptability before
and after opening
The results showed that the impression given by the product
to the consumers before opening was reinforced after opening and consumers were
not disappointed by the product. This is certified by the fact that for all
attributes assessed both before and after opening, the mean scores obtained
after opening were high than those obtained before.
ASSESSMENT OF THE PACKAGING AND THE LABELING
Packaging and labeling were assessed so as to know, to which
extend they were able to attract consumers , and if those last ones were
satisfied by them.
The following table, shows the mean score obtained.
|
Attributes
|
N. of panelists
|
Mean score
|
|
Packaging & labeling
|
15
|
4.2
|
Table 4.3.4 : results of consumer acceptability
check for packaging and labeling
The mean score obtained of  showed that the packaging and the labeling were accepted and judged to be
satisfactory. However this remains a challenging subject since the plastic
bags used are not allowed to be used as packaging material in Rwanda.
showed that the packaging and the labeling were accepted and judged to be
satisfactory. However this remains a challenging subject since the plastic
bags used are not allowed to be used as packaging material in Rwanda.
4.4. LABORATORY ANALYSIS
The results of laboratory analysis indicated that the
flavoured dry vegetable soup developed contained an average value of 4.98%
moisture content over 95.02% total solid matter. It also showed that it
contained 13.06% crude protein, 3.17% lipids, 8.44% ash & minerals, 1.66%
vitamin C, and 68.69% total soluble sugars. The vitamin C content of the
product reduced significantly, ( only 1.66% ). This may be linked to the
drying operation which exposed vegetables to a relatively high temperature (
60°C ) for a long period of time.
4.5. PRICE OF THE PRODUCT
The price of the flavoured dry vegetable soup developed was
calculated as follows:
?Calculation of Cost of production: -
Ingredients 6295 Frw
- Transport 4000 Frw
- Energy 4000 Frw
- Labor 6000 Frw
- Tools and machinery 5000 Frw
TOTAL 25 295
Frw
?Reasonable benefit margin of 15% =  =
3794.25 Frw
=
3794.25 Frw
?Total revenue must be of 25295 Frw +
3764.25 Frw = 29089.25 Frw
Since 18 packets were produced, it was deduced that the price
of one packet of flavoured dry vegetable soup would be 1616.069 Frw.
This price is relatively high, and the product may not be
affordable by local people. This high price may be the result of lack of
drying facilities near Kigali city, high cost of energy used for drying, and
possibly the fact that only small amount of vegetables was used leading to an
underutilization of the capacities available.
Chapter Five : CONCLUSIONS AND
RECOMMENDATIONS
5.2. CONCLUSIONS
From the work done during this research, it has been
concluded that, drying is one of the efficient methods of processing and
preserving vegetables that can be used to save a great part of the production
that is lost annually because of poor post harvest handling. It can be done
anywhere and anytime, and even non educated people, if they are well trained,
can do it.
Dried vegetables are easily stored without the need of freezer
and / or refrigerators. So, they can be used further after they have been
harvested, and they can be transported easily to be sold in other parts.
Value was added to dried vegetables, by mixing different
ingredients in well defined proportions, and developing a well appreciated
flavoured vegetable soup. The cooking method of the flavoured dry vegetable
soup developed was established as follows:
- Put 1 ltr (3 small metal tea cups) of water
in a cooking pan
- Add the content of the package
- Add about 10 ml (3 soup spoons) of cooking
oil
- Add little salt to fit your taste
- Boil for 15 - 20 minutes
- Keep stirring while boiling
- Serve hot
The flavoured vegetable soup developed has a good nutritional
value, and good sensory attributes since there was no significant difference (
p = 0.05 ), between acceptability of sensory attributes of the developed
soup.
5.2. RECOMMENDATIONS
Investors should be informed about the opportunity of adding
value to the production of vegetables and should be encouraged to invest in
that sector of agriculture which is a potential way of making money and
diversifying the export products.
Farmers should be encouraged and trained on the way of
increasing their production of vegetables without fear of loosing their
efforts, since the production will be now processed.
Further researches should be carried out on the storage
stability of this product, as well as on the packaging possibility or
influence of different packaging materials on its quality so as to solve the
problem of packaging material.
REFERENCES
FRAZIER C.W., WESTHOFF C.D.(1988) Food microbiology,
4th edition,
Tata McGraw-Hill edition.
GARCIA-MATA M., BOSCH-BOSC N., PEREZ-RODRIGUEZ M.L (1995)
«Effects of cooking on nitrates in dehydrated soups».
International journal of Food Science and
Technology, Volume30, Issue1, page 45-48, February 1995.
HOUNSOME N., HOUNSOME B., THOMAS D., EDWARDS-JONES G. (2008)
«Plant metabolites and nutritional quality of
vegetables» Journal of Food Science, Volume73,
Issue4, page R48-R65, May 2008.
KENDALL P., DIPERSIO P., SOFOS J.(2006) Drying vegetables.
(www.ext.colostate.edu/PUBS/FOODNUT/09308.html)
MEILGAARD M., CIVILLE G.V., CARR B.T. (1999)
Sensory evaluation techniques, 3rd edition. CRC Press LLC
MITSURU NAKUMARA, KATHERINE D. KELLY(1968).
«Clostridium perfrigens in dehydrated soups and
sauces».
Journal of Food Science, Volume33, Issue4, page 426-426, July
1968.
MICHELLE H., LOY R.S., RIVLIN M.D. (2001).Nutritional clinical
care, Volume3,
Issue3, Pages 145-152. 25th December 2001
MONACO R.D., CAVELLA S., TORRIERI E., MASI P. (2007).
« Consumer acceptability of vegetable
soups » Journal of sensory studies, Volume22, Issue1, page 81-98,
February 2007
NIELSEN S.S (1998) Food analysis 2nd edition. Aspen
publishers
ROLAND P.C. and LYON, H.D., (2000). Guidelines for Sensory
Analysis in Food Products Development and Quality
Control, 2nd Ed., an Aspen Publisher, Inc., USA
SHAKUNTALA M.N., SHADAKSHARASWAMY M.(2001)
FOODS : Facts and Principles, 2nd edition. New age
international publishers.
TERRY P., TERRY J.B., and WALK A. (2001)
« Fruits and vegetable consumption in prevention of
cancer»
Journal of international medicine, volume 250, Issue4,
page280-290, October 2001
TOMOHIRO SEKI (1990), Laboratory manual for food analysis.
VIEIRA E. R. (1996) Elementary Food Science, 4th
edition. Chapman & Hall
www.fao.org ( 24th July 2008 )
www.wikipedia.org ( 29th May 2008 )
APPENDICES
![]()
QUESTIONNAIRE FOR SUITABLE FOOD FORMULATION
Date.............................
Instructions
Be sure that your hands are clean before starting and rinse
your mouth before tasting and re-tasting, and then evaluate the products in
front of you.
1°After eating on each of the 6 presented soups,
complete the following tables by the symbol .
Soup1
|
Excellent
|
Very good
|
Good
|
Neither good nor bad
|
Bad
|
Very bad
|
Rejected
|
|
Appearance
|
|
|
|
|
|
|
|
|
Aroma
|
|
|
|
|
|
|
|
|
Colour
|
|
|
|
|
|
|
|
|
Taste
|
|
|
|
|
|
|
|
|
Texture
|
|
|
|
|
|
|
|
|
Overall acceptability
|
|
|
|
|
|
|
|
Soup2
|
Excellent
|
Very good
|
Good
|
Neither good nor bad
|
Bad
|
Very bad
|
Rejected
|
|
Appearance
|
|
|
|
|
|
|
|
|
Aroma
|
|
|
|
|
|
|
|
|
Colour
|
|
|
|
|
|
|
|
|
Taste
|
|
|
|
|
|
|
|
|
Texture
|
|
|
|
|
|
|
|
|
Overall acceptability
|
|
|
|
|
|
|
|
Soup3
|
Excellent
|
Very good
|
Good
|
Neither good nor bad
|
Bad
|
Very bad
|
Rejected
|
|
Appearance
|
|
|
|
|
|
|
|
|
Aroma
|
|
|
|
|
|
|
|
|
Colour
|
|
|
|
|
|
|
|
|
Taste
|
|
|
|
|
|
|
|
|
Texture
|
|
|
|
|
|
|
|
|
Overall acceptability
|
|
|
|
|
|
|
|
Soup4
|
Excellent
|
Very good
|
Good
|
Neither good nor bad
|
Bad
|
Very bad
|
Rejected
|
|
Appearance
|
|
|
|
|
|
|
|
|
Aroma
|
|
|
|
|
|
|
|
|
Colour
|
|
|
|
|
|
|
|
|
Taste
|
|
|
|
|
|
|
|
|
Texture
|
|
|
|
|
|
|
|
|
Overall acceptability
|
|
|
|
|
|
|
|
Soup5
|
Excellent
|
Very good
|
Good
|
Neither good nor bad
|
Bad
|
Very bad
|
Rejected
|
|
Appearance
|
|
|
|
|
|
|
|
|
Aroma
|
|
|
|
|
|
|
|
|
Colour
|
|
|
|
|
|
|
|
|
Taste
|
|
|
|
|
|
|
|
|
Texture
|
|
|
|
|
|
|
|
|
Overall acceptability
|
|
|
|
|
|
|
|
Soup6
|
Excellent
|
Very good
|
Good
|
Neither good nor bad
|
Bad
|
Very bad
|
Rejected
|
|
Appearance
|
|
|
|
|
|
|
|
|
Aroma
|
|
|
|
|
|
|
|
|
Colour
|
|
|
|
|
|
|
|
|
Taste
|
|
|
|
|
|
|
|
|
Texture
|
|
|
|
|
|
|
|
|
Overall acceptability
|
|
|
|
|
|
|
|
2. Comments: Please indicate what in
particular you liked or disliked about this products (use words not
sentence).
SOUP 1
SOUP 2 SOUP
3
Liked Disliked
Liked Disliked Liked
Disliked
.................. ..................
.................. .................. ..................
..................
.................. ..................
.................. .................. ..................
..................
.................. ..................
.................. .................. ..................
..................
.................. ..................
.................. .................. ..................
..................
SOUP 4
SOUP 5
SOUP 6
Liked Disliked
Liked Disliked Liked
Disliked
.................. ..................
.................. .................. ..................
..................
.................. ..................
.................. .................. ..................
..................
.................. ..................
.................. .................. ..................
..................
.................. ..................
.................. .................. ..................
..................
3° a. Do you want any of the
characteristics to be changed ? Yes No
b. If Yes, suggest the
changes................................................
.................................. ..
....................................................................................................................
.....................................................................................................................
......................................................................................................................
N.B: -Excellent > 80% -Neither good
nor bad > 50% -Extremely bad(Rejected) < 20%
-Very good >70% -Bad >
40%
-Good > 60% -Very bad
> 30%
QUESTIONNAIRE FOR SUITABLE COOKING TIME AND
METHOD Date.....................
Instructions
Be sure that your hands are clean before starting and rinse
your mouth before tasting and re-tasting, and then evaluate the products in
front of you.
1°After eating on each of the 3 presented soups,
complete the following tables by the symbol .
Soup1
|
Excellent
|
Very good
|
Good
|
Neither good nor bad
|
Bad
|
Very bad
|
Rejected
|
|
Appearance
|
|
|
|
|
|
|
|
|
Aroma
|
|
|
|
|
|
|
|
|
Colour
|
|
|
|
|
|
|
|
|
Taste
|
|
|
|
|
|
|
|
|
Texture
|
|
|
|
|
|
|
|
|
Overall acceptability
|
|
|
|
|
|
|
|
Soup2
|
Excellent
|
Very good
|
Good
|
Neither good nor bad
|
Bad
|
Very bad
|
Rejected
|
|
Appearance
|
|
|
|
|
|
|
|
|
Aroma
|
|
|
|
|
|
|
|
|
Colour
|
|
|
|
|
|
|
|
|
Taste
|
|
|
|
|
|
|
|
|
Texture
|
|
|
|
|
|
|
|
|
Overall acceptability
|
|
|
|
|
|
|
|
Soup3
|
Excellent
|
Very good
|
Good
|
Neither good nor bad
|
Bad
|
Very bad
|
Rejected
|
|
Appearance
|
|
|
|
|
|
|
|
|
Aroma
|
|
|
|
|
|
|
|
|
Colour
|
|
|
|
|
|
|
|
|
Taste
|
|
|
|
|
|
|
|
|
Texture
|
|
|
|
|
|
|
|
|
Overall acceptability
|
|
|
|
|
|
|
|
2. Comments: Please indicate what in
particular you liked or disliked about this products (use words not
sentence).
SOUP 1
SOUP 2 SOUP
3
Liked Disliked
Liked Disliked Liked
Disliked
.................. ..................
.................. .................. ..................
................... .................. ..................
.................. .................. ..................
..................
.................. ..................
.................. .................. ..................
..................
N.B: -Excellent > 80% -Neither good
nor bad > 50% -Extremely bad(Rejected) < 20%
-Very good >70% -Bad >
40%
-Good > 60% -Very bad
> 30%
Thank you for evaluating our product!!!
QUESTIONNAIRE FOR CONSUMER ACCEPTABILITY CHECK
Date:..................
1. Before opening
Dislike very much
Dislike moderately
Neither like nor
dislike
Like moderately
Like very much
1.1. Without opening, look at the product in
the package, evaluate it and indicate your consideration basing on the
following:
Appearance
5 4 3 2 1
Colour
5 4 3 2 1
Texture
5 4 3 2 1
1.2. Please, observe carefully the packaging
and the labeling and then indicate how much you liked or disliked them. Show
your score by circling one of the numbers below that matches the best with your
overall consideration.
1.3. Please answer these question in
accordance to you
a) Are the packaging and the labeling attractive enough?
Yes No
b) Can you suggest changes, that can be made in order to
make them more attractive!
.....................................................................................................................
......................................................................................................................
.....................................................................................................................
c) Are the information given on the label sufficient?
Yes No
d) Is there any thing, you think is missing?
......................................................................
.......................................................................................................................
......................................................................................................................
2. After opening
2.1. Open the package and try to fill how the
product smells and then indicate how much you appreciated it.
Show your score by circling one of the numbers below that matches the best with
your overall consideration.
3. After preparing
3.1. Prepare the soup, following the
instructions given on the label.
Please observe, eat and taste this product and then, indicate
how much you liked or disliked it. Show your score by circling one of the
numbers below that matches the best with your overall consideration.
3.2. Comments: Please
indicate what in particular you liked or disliked about this product (use words
not sentences).
Liked
Disliked
.......................................
...........................................
.......................................
...........................................
.......................................
...........................................
3.3. Assessment of particular characteristics
Please re-taste the product as needed and indicate how much
you liked or disliked the following. Show your score by circling one of the
numbers below that matches the best with your overall consideration.
Dislike very much
Dislike moderately
Neither like nor
dislike
Like moderately
Like very much
Appearance
5 4 3 2 1
Aroma
5 4 3 2 1
Colour
5 4 3 2 1
Taste
5 4 3 2 1
Texture
5 4 3 2 1
Thank you very much for evaluating our
product!!!
DETERMINATION OF TOTAL REDUCING SUGAR BY LANE-EYNON
METHOD
1. EQUIPMENTS AND REGENTS NEEDED
- Laboratory glassware
- Electronic balance
- Bunsen burner
- Fehling solution 1 ( cooper sulphate
solution )
- Fehling solution 2 (alkaline tartrate solution )
- Standard invert sugar solution ( for standardization of
Fehling so in.1)
- Methylene blue solution (1% in water)
2. SAMPLE PREPARATION
Dissolve 5g of sample with water and dilute to 100ml in a
volumetric flask.
NOTE: the sample sugar solution is prepared so that 100ml of
the solution
Contain 200 ~ 250mg of reducing sugar
3. PROCEDURE
3.1. standardization of Fehling solution
- Pipette each 5ml of Fehling solution. 1& 2
- Add 19ml of standard invert sugar solution from burette ,
and mix well
- Boil 4min ( keeping to avoid bumping)
- Add 4 drops of methylene blue
- Without removing the flame, complete the titration with
standard invert sugar solution, until the indicator is decolorized. Record the
volume required
* the titration should be finished
10ml, of mixed Fehling solution should require 20.36ml of
standard invert sugar therefore
Factor of Fehling solution. ( f ) = ml of standard invert
sugar required / 20.36
NOTE: titration volume of standard invert sugar should be
20.36 #177; 0.5ml if difference is more than that adjust concentration of
Fehling solution 1 by addition of copper sulphate or water
3.2. preliminary titration
- Pipette each 5ml of Fehling solution.1&2
- Add 15ml of sample sugar solution from burette and mix well
- Heat the mixture to boil ( keeping to avoid bumping )
- Add 4 drops of methylene blue if blue color is disappeared
already, dilute sample solution and try again from 1
- Without removing the flame, complete the titration with
sample sugar solution, until the indicator is decolorized. Record the volume
required
3.3. final titration
- Pipette each 5ml of Fehling solution. 1 & 2
- Add the sample solution of which volume is 1ml less than the
volume required in the preliminary titration.
- Boil for 2min ( keeping to avoid bumping )
- Add 4 drops of metylene blue
- Without removing the flame complete the titration until the
indicator is decolorized with sugar solution.
* the titration should be finished within 3min.
4. CALCULATION
Total reducing sugar content ( %) = 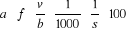
a = Lane-Eynon factor as mg of reducing
sugar corresponding to the milliliters of sample sugar
 solution required from table
b = ml of the sample sugar solution
required
f = Factor of Fehling solution 1
s = Weight of the sample taken (g )
v = Volume of the sample solution prepared
DETERMINATION OF THE FAT CONTENT BY THE SOXHLET
METHOD
1. EQUIPMENTS AND REAGENT NEEDED
- Laboratory electron balance
- Laboratory flasks
- Extraction thimble
- Soxhlet extraction apparatus
- Ethyl ether
2. SAMPLE PREPARTION
The sample that will be analyzed by the Soxhlet method must be
well dried and grinded so as to pass a N°30 sieve. It must be stored in an
air-tight bottle if it is not used immediately.
3. PROCEDURE
- Weigh accurately about 5g of sample ( W1)
- Transfer to an extraction thimble and stopper with defatted
cotton wool
- Dry at 105°C - 110°C for one hour
- Place the thimble in the Soxhlet extraction apparatus
- Put ethyl ether up to 2/3 of flask
- Set up the apparatus and start extraction. (the temperature
has to be controlled so that 80
condensed drops fall down on the thimble per minute, and
keep this for 8 - 16hours).
- Evaporate the used ether, so as to remain with lipids
only
- Weigh the fat extracted ( W2 )
- Calculate the percentage fat of the food by the formula:
% Fats = 
DETERMINATION OF PROTEIN CONTENT BY THE KJELDAHL
METHOD
4. EQUIPMENTS AND REAGENT NEEDED
- Laboratory glassware apparatus
- Electron balance
- Concentrated
H2SO4
- Potassium sulfate
- Copper sulfate
- 45% NaOH solution
- 4% H3BO3 Solution
- Mixed indicator
- Standard 0.02N- HCl solution
5. SAMPLE PREPARTION
The sample that will be analyzed by the Kjeldahl method must
be well dried and grinded so as to pass a N°30 sieve. It must be stored in
an air-tight bottle if it is not used immediately.
6. PRINCIPLE AND PROCEDURE
The food is digested first, by means of heating it into a
digestion flask, in presence of concentrated sulfuric acid (which digest the
food), sodium or potassium sulfate (to speed up the reaction by rising the
boiling point) and copper sulfate (as catalyst). This digestion converts
nitrogen in the food into ammonia in the form of ammonium
(NH4+) which binds to the sulfate ions
(SO42-), and produces gases such as
CO2, H2O.
H2SO4 /
Heat
N (food) Catalysts
(NH4) 2SO4
After digestion has been completed, the solution in the
digestion flask must be made alkaline by addition of sodium hydroxide, which
converts the ammonium sulfate into ammonia gas.
(NH4) 2SO4
+2NaOH 2NH3 +
2H2O + Na2 SO4
The ammonia gas produced is received into another flask,
containing an excess of boric acid. The low pH of the solution in the
receiving flask converts ammonia gas into the ammonium ion, and simultaneously
converts the boric acid to borate ion:
NH3 +H3BO3
NH4+ +
H2BO3-
The nitrogen content is then estimated by titration of the
ammonium borate formed, by standard sulfuric or hydrochloric acid, using a
suitable indicator to determine the end-point of the reaction. The
concentration of hydrogen ions (in moles) required to reach the end-point, is
equivalent to the concentration of nitrogen that was in the original
food.
H2BO3- + H+
H3BO3
The following is the equation that can be used to determine
the nitrogen concentration of a sample that weighs
m grams, using xM
HCl acid solution for the titration.
% Nitrogen = 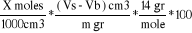
Where x = Molar concentration of the acid used for
titration
Vs= Titration volume for the sample
Vb= Titration volume for the blank
m = Mass of the original sample
Once the nitrogen content has been determined, it is converted
to a protein content using the appropriate conversion factor F
(usually 6.25 is used).
% Proteins = F % Nitrogen
DETERMINATION OF VITAMIN C CONTENT BY INDOPHENOL
SOLUTION
1. EQUIPMENTS AND REAGENT NEEDED
- Laboratory glassware apparatus
- Electron balance
- 10% TCA solution
- Standard ascorbic acid solution (1mg/ml)
- Standard Indophenol solution
2. PRINCIPLE AND PROCEDURE
The determination of vitamin C is based on the fact that it is
titratable by Indophenol in presence of Trichloroacetic Acid (TCA)
solution.
The procedure of the experiment is briefly described below.
- Standardization of Indophenol solution
- Weigh a sample, grind it, and mixing the ground sample with
TCA in a flask
- Titrating with Indophenol solution
- Titrating also TCA without sample (for blank)
- Calculate the % Vit C, by the formulae
% Vit C (mg/100g) = (A - B) C 100/10 1/S 100
Where A = Volume (in ml) of Indophenol solution used for
sample
B = Volume (in ml) of Indophenol solution used for blank
C = Mass (in mg) of ascorbic acid equivalent to 1.0 ml of
standard Indophenol
solution
S = Weight of the sample taken.
TABLES OF RESULTS FOR CONSUMMER ACCEPTABILITY CHECK (
BEFORE OPENING)
|
Score per sensory attributes
|
|
Panelist
|
Appearance
|
Aroma
|
Colour
|
Texture
|
Total
|
|
1
|
4
|
4
|
5
|
5
|
18
|
|
2
|
4
|
4
|
5
|
4
|
17
|
|
3
|
5
|
4
|
5
|
4
|
18
|
|
4
|
4
|
5
|
4
|
4
|
17
|
|
5
|
4
|
4
|
5
|
4
|
17
|
|
6
|
3
|
4
|
3
|
3
|
13
|
|
7
|
5
|
5
|
5
|
5
|
20
|
|
8
|
5
|
4
|
4
|
5
|
18
|
|
9
|
5
|
4
|
4
|
4
|
17
|
|
10
|
4
|
5
|
5
|
4
|
18
|
|
11
|
4
|
4
|
3
|
4
|
15
|
|
12
|
5
|
4
|
5
|
4
|
18
|
|
13
|
4
|
4
|
5
|
5
|
18
|
|
14
|
4
|
5
|
4
|
3
|
16
|
|
15
|
4
|
3
|
5
|
5
|
17
|
|
Total
|
|
64
|
63
|
67
|
63
|
257
|
|
Average
|
|
4.26666667
|
4.2
|
4.466667
|
4.2
|
|

= (257)2/ 4*15 =
66049/60 = 1100.817
SSS = ( ) /
N = (642+632+672+632) / 15 =
0.716667
) /
N = (642+632+672+632) / 15 =
0.716667
TSS = 1125 - 1100.817 = 24.18333
ESS = 24.18333 - 0.716667 = 23.46667
DfT = ( n*N ) - 1 = (4*15) - 1 = 60 - 1 = 59
DfS = n - 1 = 4 - 1 = 3
DfE = DfT - DfS = 59 - 3 =
56
MST =  =
=
 = 0.409887
MSS =  =
=
 = 0.238889
EMS =  =
=
 = 0.419048
Fcalc =  =
=
 = 0.570076
Ftab at 5% = 2.774
Ftab at 1% = 4.163
TABLES OF RESULTS FOR CONSUMMER ACCEPTABILITY CHECK (
AFTER OPENING)
|
Score per sensory attributes
|
|
Panelist
|
Appearance
|
Aroma
|
Colour
|
Taste
|
Texture
|
Over.accept
|
total
|
|
1
|
5
|
4
|
5
|
5
|
5
|
3
|
27
|
|
2
|
4
|
5
|
4
|
4
|
3
|
4
|
24
|
|
3
|
5
|
4
|
5
|
5
|
4
|
5
|
28
|
|
4
|
4
|
5
|
4
|
3
|
4
|
3
|
23
|
|
5
|
5
|
4
|
5
|
4
|
3
|
4
|
25
|
|
6
|
4
|
5
|
5
|
5
|
5
|
5
|
29
|
|
7
|
5
|
5
|
5
|
5
|
5
|
5
|
30
|
|
8
|
5
|
4
|
4
|
4
|
5
|
4
|
26
|
|
9
|
5
|
5
|
4
|
3
|
5
|
4
|
26
|
|
10
|
4
|
5
|
4
|
5
|
4
|
4
|
26
|
|
11
|
4
|
5
|
4
|
4
|
5
|
4
|
26
|
|
12
|
5
|
5
|
5
|
4
|
4
|
4
|
27
|
|
13
|
5
|
4
|
5
|
3
|
5
|
5
|
27
|
|
14
|
4
|
4
|
5
|
5
|
3
|
5
|
26
|
|
15
|
4
|
3
|
5
|
4
|
5
|
4
|
25
|
|
Total
|
|
68
|
67
|
69
|
63
|
65
|
63
|
395
|
|
Average
|
|
4.533333333
|
4.466667
|
4.6
|
4.2
|
4.333333
|
4.2
|
|

= (396)2 / 15*6 = 156025 /
90 = 1733.611
SSS = [ ( ) /
N ] - CF = [ (
682+672+692+632+652+632)
/ 15 ] - 1733.611 = 2.188889
) /
N ] - CF = [ (
682+672+692+632+652+632)
/ 15 ] - 1733.611 = 2.188889
TSS = 1773 - 1733.611 = 39.38889
ESS = 39.38889 - 2.188889 = 37.2
DfT = ( n*N ) - 1 = (15*6) - 1 = 89
DfS = n - 1 = 6 - 1 = 5
DfE = DfT - DfS = 89 - 5 = 84
MST =  =
=
 = 0.442572
MSS =  =
=
 = 0.437778
EMS =  =
=
 = 0.442857
Fcalc =  =
=
 = 0.98853
Ftab at 5% = 2.3368
Ftab at 1% = 3.273
PRICING MECHANISM FOR THE DEVELOPED
SOUP
|
Object
|
Quantity(Kg)
|
U.Price (Frw)
|
Total (Frw)
|
|
Carrot
|
5
|
250
|
1250
|
|
Celery
|
1.5
|
150
|
225
|
|
Garlic
|
1
|
1200
|
1200
|
|
Leek
|
1
|
150
|
150
|
|
Onion
|
3
|
250
|
750
|
|
Pepper
|
1
|
400
|
400
|
|
Potatoes
|
3
|
100
|
300
|
|
Spinach
|
3
|
400
|
1200
|
|
Tomatoes
|
7.4
|
100
|
740
|
|
Salt
|
0.4
|
200
|
80
|
|
TOTAL
|
6295 Frws
|
1. Cost of ingredients
2. Other expenses
- Transport 4000 Frw
- Energy 4000
Frw
- Labor 6000
Frw
- Tools and machinery 5000 Frw
TOTAL
25 295 Frw
?Reasonable benefit margin of 15% =  =
3794.25 Frw
=
3794.25 Frw
?Total revenue must be of 25295 Frw +
3764.25 Frw = 29089.25 Frw
Since 18 packets were produced, it was deduced that the price
of one packet of flavoured dry vegetable soup would be 1616.069 Frw.
LABEL USED
1. RECTO OF THE PACKAGE
INGREDIENTS
Carrot Carotte
Potato P.de Terre
Tomato Tomate
Onion Ognon
Garlic Ail
Leek Poireaux
Spinach Epinard
Celery Céleri
Salt Sel de cuisine
Red pepper Piment
Manufact : 05 / 08 / 2008
Best before end ...........
Net Weight : 60 g Store in a cool &
dry place
Manufactured at KIST by UWAYO Désiré,
4th year, Food science and technology
(Tel. N° 08 76 82 76)
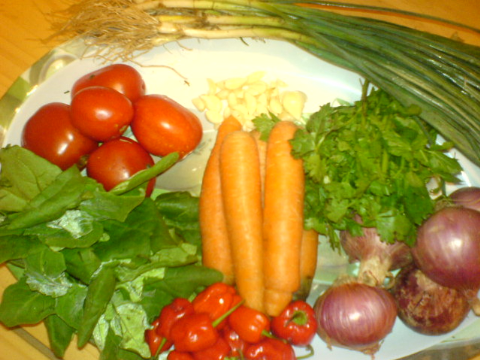
![]()
![]()
Made in Rwanda Lot N° .........
INSTRUCTIONS FOR USE
- Put 1 ltr (3 small metal tea cups) of water in a cooking
pan
- Add the content of the package
- Add about 10 ml
(3 soup spoons) of cooking oil
- Add a pink of salt to taste
- Boil for 15 - 20 minutes
- Keep stirring while boiling
- Serve hot
MODE D`EMPLOI
-Mettez 1 ltr (3 petits gobelets en métal) d`eau dans
un casserole
-Ajoutez le contenu d`un paquet
-Ajoutez 10 ml
(3 cuillères à soupe) d`huile
-Mettez un peu de sel selon votre goût
- Faites bouillir pendant 15-20 minutes tout en remuant.
-Servez chaud
2. VERSO OF THE PACKAGE
NUTRITIONAL VALUE(per100g)
- 4.98% moisture content
- 95.02% total solid matter
- 13.06% crude protein
- 3.17% lipids
- 8.44% ash & minerals
- 1.66% vitamin C
- 68.69% total soluble sugars


 Figure 2.2.5 : Picture of tomatoes