DECLARATION
I Paterne RUKUNDO, hereby declare that this dissertation
entitled «the role of National bank of Rwanda on Rwandan economic
development» is my own work and it has not been submitted anywhere for the
award of any degree.
Signed...........................................................
Paterne RUKUNDO
DEDICATION
To the almighty God for his blessing,
To my parents with my whole family for their endless
affection,
To my brothers, my friends and beloved
Relatives,
I dedicate this dissertation.
ACKNOWLEDGEMENT
I would like first to acknowledge and thank Almighty God for
loving and blessing me since my birth until now.
I thank particularly prof. RUTAZIBWA Gerard who devoted part
of his time to the supervision of this work. His invaluable guidance
contributed to the successful completion of this dissertation.
I recognize my parents who cared for me since the
time of birth especially during the period of abolition of bursary.
I would expend my thanks to all people and best friends,
especially, Mr. Augustin NDAHAYO, Mr. Augustin NIYONZIMA, Ms Egidie NIYONSABA
and their families who more contributed to the achievement of this
dissertation.
Thanks go to my friends and colleagues classmates in the economic
department precisely to my girlfriend Clotilde MUKAMUGANGA for
making my student life enjoyable.
May God bless them in whatever they do!
TABLE OF CONTENTS
DECLARATION
i
DEDICATION
ii
ACKNOWLEDGEMENT
iii
TABLE OF CONTENTS
iv
LIST OF TABLES
vi
APPENDICES
vii
LIST OF ABBRAVIATIONS
viii
ABSTRACT
xi
CHAPTER I: GENERAL INTRODUCTION
1
1.1. Introduction
1
1.2. Statement of the problem
2
1.3. Significance of the study
3
1.4. Hypothesis
3
I.5. Objectives of the study
4
1.6. Identification of research.
4
1.7. Scope and limitations of the study
5
1.8. Organization of the study
5
CHAPTER II. LITERATURE REVIEW
6
2.1. Introduction
6
2.2. Development
6
2.3. Financial institutions
6
2.4. Financial institutions and financial
system
7
2.5. Functions of financial system
7
2.5.1. Credit
7
2.5.2. Payments
8
2.5.3. Money creation
8
2.5.4. Savings
8
2.6. Financial development
8
2.7. Financial development and Economic growth
9
2.8. Formal financial sector and Economic
activities
10
2.9. Semi-formal financial sector and Economy
11
2.10. Informal financial sector and Economic
activities
11
2.11. Problems affecting financial development in
developing countries
12
2.12. Banking institutions
13
2.13. Non banking institutions
14
2.14. Diversified firms
14
2.15. The role of financial system
15
2.16. Structure of Rwandan financial sector
16
2.17. Recent evolution of Rwandan banking
sector
16
2.18. Monetary policy
18
2.18.1 Theory on monetary policy
19
2.19. Bank credit and transmission of monetary
policy
21
2.20. Role of a central bank
23
CHAPTER III: METHODOLOGY
24
3.1. Introduction
24
3.2. Data collection
24
3.2.1. Sources of data
24
3.2.2. Data collection procedure
25
3.3. Data processing
25
3.3.1. Editing
25
3.3.2. Tabulation
25
3.4. Data presentation, analysis and
interpretation
25
3.5. Research techniques
28
3.5.1. Documentation
28
3.5.2. Computer programs
28
3.6. Limitations to the study
28
CHAPTER IV . MODEL ESTIMATION AND FINDINGS
29
4.1. Introduction
29
4.2. Historical background of National Bank of
Rwanda (NBR)
29
4.3. Mission of National Bank of Rwanda
30
4.4. Activities and Objectives of the NBR
31
4.5. Used data
32
4.6. Test for stationary
32
4.7. INTERPRETATION OF THE RESULTS
43
CHAPTER V. CONCLUSION AND SUGGESTION
45
BIBLIOGRAPHY
49
Academic course notes
50
Dissertations
50
LIST OF TABLES
TABLE 4.1: Money Stock stationary
3
TABLE 4.2: Inflation Gap stationary
34
Table 4.3: Output Gap stationary
35
TABLE 4.4: Variation of Exchange stationary
36
TABLE 4.5: Previous Money Stock stationary
37
TABLE 4.6: Previous Inflation Gap stationary
38
Table 4.7: previous Output Gap stationary
39
Table 4.8: Previous Variation of Exchange
stationary
40
Table 4.9: Error Term stationary
41
APPENDICES
1. Orginal data of used variable in Taylor rule
2. Values of all used variables in Taylor rule
3. AIC and SIC for finding used lags
4. Error correction model
5. Ramsey reset test for model specification
6. Autocorrelation test of Durbin-Watson (DW)
7. Test for cointegration
8. To whom it may concern
9. Access to the library
10. Authorisation of dissertation submission
LIST OF ABBRAVIATIONS
ACHs: Automated Clearing Houses
ADF: Augmented Dickey-Fuller
ATM: Automatic Teller
Machine
B.E.R. B: Banque d'Emission du Rwanda et du
Burundi
BACAR: Banque Continentale Africaine du Rwanda
BANCOR: Banque à la Confiance d'Or
BCDI: Banque de Commerce, de Development et
d'Industries
BCR: Banque Commerciale du Rwanda
BHR: Bank de l'Habitat du Rwanda
BK: Banque de Kigali s.a
BNR: National Bank of Rwanda
BRD: Bank Rwandaise de Development
CAMEL: Capital adequacy, Asset quality,
Earnings, and Liquidity
COGEBANQUE: Companie Generale des Banques
CPI: Cost Price Index
CSR: Caisse Socialle du Rwanda
DF: Dickey-Fuller
EFT: Electronic Fund Transfer
ESAF: Enhanced Structural Adjustment Facility
GDP: Gross Domestic Product
IMF: International Monetary Found
MFIs: Micro Finance Institutions
NCUA: National Credit Union Association
NGOs: Non-Government Organizations
OLS: Ordinary Least Squared
OMO: Open Market Operating
PRGF: Poverty Reduction and Growth Facility.
RNIS: Rwanda National Institute of Statistics
UOPB: Urwego Opportunity Bank
VAR: Vector Autoregration
VECM: Vector Error Correction Model
WB: World Bank
ABSTRACT
The aim of this dissertation is to study how monetary policy
is conducted in Rwanda by National Bank of Rwanda (BNR). The task has been
accomplished by designing and estimating a Taylor rule, monetary policy
reaction function for the National Bank of Rwanda over the period 1995-2010.
Applying Ordinary Least Squared (OLS) on the time series data,
we test whether the Central Bank in Rwanda reacts to changes in the inflation
gap, the output gap and the exchange rate. The results of the study show that
the Central Bank of Rwanda has had a monetary policy over the years with the
monetary stock aggregate (Mt) as the principal instrument. The results also
show that the Central Bank of Rwanda reacted by giving much importance to the
exchange rate than to inflation and neglected the output.
CHAPTER I: GENERAL
INTRODUCTION
1.1. Introduction
Since the views of Schumpeter (1911) on the role of financial
development on economic growth, strengthened by empirical works of McKinnon
(1973) and Shaw (1973), and invaluable contribution of Levine (1997) who
portrayed the functions through which financial development may affect economic
growth, a bulk of studies have been conducted across regions and countries to
provide further evidence on the link between financial development and economic
growth toward development. It is in this spirit that we have undertaken this
study to determine whether there is evidence of relationship between financial
development supervised by National Bank of Rwanda (NBR) and economic growth
in Rwanda.
This chapter presents the knowledge gap to be filled, problem
statement and objectives alongside the significance, justification,
identification of research and hypotheses of the study. Moreover, the chapter
shows at what extend the study is relevant for Rwanda, highlights the scope and
limitations, the organization of the study and summary.
The central bank is the most important
institutions in a financial system. It occupies a unique position in the
monetary and banking system of the country in which it operates. The central
bank is always inspired by the principle of national welfare and in order to
achieve this it must be done not under the influence of government, the reason
being that the economy problem of the country cannot be satisfactorily solved
without the fullest co-operations between the central bank and the government
(Foundations of banking, 2005)
The central bank should under no circumstances compete with
other banks that is receiving deposits from the public or extending loans to
needy borrowers.
If it competes with other banks, this will conflict with its
important function of being the bankers' bank, controller of credit and lender
of last resort (comparative banking systems, 2005).
1.2. Statement of the
problem
The economic growth toward development has been a major
concern of the government of Rwanda by putting a lot of efforts to sustain
Rwandan economy and to improve social welfare. Even though Rwandan economy has
recovered considerably since the 1994 genocide; the GDP per capita is still
low, around 460 US$, and over 56 percent of the population live under the
poverty line. The agricultural sector, employing more than two-third of the
population is underdeveloped and its contribution to GDP is still small,
accounting less than 35 percent. The industry sector too seems not to be in a
good position to be an alternative measure since it remained on infant stage
and its contribution to GDP has never reached 20 percent. Like many other
developing countries, Rwanda was also affected by global economic recession and
negative effects were particularly observed in its export sector through low
international commodity prices.
The economic declines significantly while the agriculture
sector performed well boosted by favorable weather conditions and government
green revolution program, the tightened credit conditions in the banking
system.
Despite the negative effect of the global economic recession
on the external sector, Rwanda managed to record a positive balance of payment,
banks to relatively important foreign capital inflows. These inflows offset the
current account deficit and allow Central bank to keep a comfortable external
position with gross official reserves.
To avoid deeper decline of the growth rate, policy measures
were undertaken by government and National Bank of Rwanda. While government
kept momentum to stimulate agriculture production, the appropriate policy
measures have been taken by central bank for addressing the liquidity crunch
and credit to private sector conditions, with the objective of restoring
confidence in the bank system.
1.3. Significance of the
study
.
This research helps the student in partial fulfillment of the
requirements of attaining a bachelor's degree and also enabled him to gain more
knowledge in handling complex problems of management.
The study was intended to encourage the policy makers to
closely examine the reasons why the National Bank of Rwanda must put in
practice its influence on financial sector for economic stability especially by
using monetary policy.
At academic level, this work will constitute an important
source of data, both theoretical and practical to researchers, students from
different faculties, and all the whole community.
This topic has also the interest to know the relationship of
monetary policy and other macroeconomic variables.
1.4. Hypothesis
Hypothesis is an early response to questions that arose in
the problem and must be confirmed to achieve a result.
By excess money supply, however there are other factors like,
low level of production, high wages, high level of import rising market prices,
nominal exchange rates, and macroeconomic instability, etc.
Accordingly, we argue that monetary policy is probably best
served by drawing models that summarize different paradigms of the transmission
mechanism, or that use of different technical approaches to represent the
transmission mechanism. Taking such strategy, diversified approach to inform
policy judgments is likely to reduce the risk of making serious policy
errors.
.
I.5. Objectives of the
study
The study has the general and specific objectives
General objective
The performance of the economy as reflected in factors such as
law inflation rate, economic output and full employment.
The impact of financial sector through stabilizer-controller
(NBR) on the economic growth towards development for Rwanda is necessary to
determine whether financial sector can be viewed as an alternative pillar for
future economic growth especially within the Vision 2020 framework.
Specific objectives
v To identify the activities of central bank on bank system,
v To examine the participation of the beneficiaries on
development,
v To examine the real impact of National Bank of Rwanda's
activities on beneficiaries of development,
v To come up with suggestions and recommendations to the
above.
1.6. Identification of
research.
It is mindset that there are many indicators of development
but some of them will be selected for being estimated and others will be
represented by error term.
The topic has four variables that are explained (dependent)
variable and explanatory (independent) variables.
Explained variable is money stock (Mt) and the
explanatory variables are output gap that is the variation of GDP and its
potential (GDP Gap or GY), inflation Gap that is variation of inflation and its
potential (IG) and variation of exchange rate (DEX). The model from these
variables explains the role of central bank through monetary policy.
Mt= B0 + B1Mt-1 +
B2IGt + B3IGt-1 +
B4YGt + B5YGt-1 +B
6DEXt +B 7DEXt-1 +
åt
Where, Mt is money stock or quantity of money,
IGt is inflation gap, YGt is GDP gap and DEX is variation
of exchange rate.
In this research, only quantitative methods with secondary data
analyzed by computer program called «E-VIEWS 3.1» will be
considered.
1.7. Scope and limitations
of the study
Development economic has a greater scope, in addition to being
concerned with the efficient allocation existing scarce productive resources
and with their sustained growth over time. It must also deal with the economic,
social, political and institutional mechanisms, both public and private,
necessary in level of living for the people. It means that this study is
located in macroeconomics science.
The study analyses the role of National Bank of Rwanda on
economic growth towards development through development of financial
institutions by monetary policy covers the period of 1995 to 2010.
In space, the study is concerned with case of National Bank of
Rwanda (NBR)
The topic under study may not be easy to conduct and therefore
may not be properly achieved. This is merely because of the fact that there are
a number of obstacles encountered in gathering data, ranging from limitations
of time and finance, doubtfulness of data availability etc.
1.8. Organization of the
study
As the first chapter of general introduction is seen above,
the rest of the study is structured as follows: chapter two gives brief review
of literature on the subject, Chapter three presents the methodology used, in
chapter four we analyze data and report our results, last chapter contains
conclusion and suggestions.
CHAPTER II. LITERATURE
REVIEW
2.1. Introduction
This chapter presents a review of the research literature
already carried out in the field under study. It is a reflection of what
economic theory reveals about the topic under study and also what different
researchers have come up with as empirical findings in their different studies.
This review helps to understand the topic under study and also identifies
different gaps of further research. Unfortunately, as shall be noticed, little
has been researched in Rwanda relating to the topic under study.
2.2. Development
Development has been defined by many writers (scholars) in
different ways; some argue that development involves growth of per capita
income which others based on the view of improving living conditions by
reducing inequality of income distribution.
According to Kocher (1973: 4), the term development is defined
as the process of a general improvement in levels of living together with
decreasing of inequality of income distribution and the capacity of sustaining
continuous improvements overtime.
Todaro (2000: 56) defines development as a multi-dimension
process involving the reorganization and the reorientation of the entire
economic and social systems. He further argues that development of physical
reality and a state of mind in which society has, through some combinations of
social, economic and political process secured the way of obtaining better
life.
2.3. Financial
institutions
There are different definitions with respect to financial
institutions. According to Collins (1993: 193), financial institutions are
institutions that act primarily as a financial intermediary in channeling funds
from lenders to borrowers (e.g commercial banks and building societies), or
from savers to investors (e.g pension funds, insurance companies).
Financial institutions are institutions that move funds from
people who save to people who have investments opportunities (mishkin, 2001:
179).
Financial institutions are business firms whose principal
assets are financial assets or claims (stocks, bonds, loans, etc) and make
loans to customers or purchase investment securities in the market place and
offer other financial services (Rose et al, 1993: 11).
2.4. Financial institutions
and financial system
Financial intermediaries and other financial institutions are
part of a vast financial system that serves the public. The financial system is
composed of a network of financial markets, institutions, businesses,
households, and governments that participate in that system and regulate its
operation. That system today knows no geographic or political boundaries, but
girdles the globe, marking loans, issuing securities, and proving outlets for
the public's savings 24 hours a day. (Rose: 1993, 6)
2.5. Functions of
financial system
The basic function of the financial system is to transfer
loanable funds from lenders or savings surplus units to borrowers or savings
deficit units. These funds are allocated by negotiations and trading in wide
web of financial markets that bring together individuals and institutions
supplying funds with those demanding funds. Most savings flowing through the
financial system come from households: the principal borrowers in the financial
system are business firms and the government. (Rose (1993))
Rose, Kolari and Fraser (1993) further reveal that the
financial system is one of the most important components of the global economy.
It provides essential services without which a modern economic system could not
function, thus presenting us with some roles of financial intermediation. Among
these roles we analyze the important ones: credit, payments, money creation
and savings.
2.5.1. Credit:
the financial system supplies credit to support purchases of goods and services
and to finance capital investments , construction of buildings, highways,
bridges, and other structures, and the purchase of machinery and equipments.
Investment increases the productivity of society's resources
and makes possible a higher standard of living for individuals and families.
(Rose et al, 1993: 7)
2.5.2.
Payments: the financial system supplies mechanisms for making payments
in the forms of currency, checking accounts and other transactions media. In
recent years institutions operating in the financial system have developed many
new payment services, including money market and NOW accounts and share draft
(all types of interest- bearing checking accounts), telephone bill- paying
services, and electronic machines that accept deposits and dispense cash.( Rose
et al, 1993: 7)
2.5.3. Money creation:
through the services of supplying credit providing a mechanism for
making payments, the financial system makes possible the creation of money.
Although several different definitions and forms of money are in use today, all
forms of money serve as medium of exchange for purchasing goods and services.
(Rose et al, 1993: 7)
2.5.4. Savings:
finally, the financial system provides a profitable outlet for
savings. Both individuals and institutions save today to be able to consume
more goods and services tomorrow. Saving performs an essential economic
function because it releases scarce resources from producing goods and services
for current consumption in order to produce investment goods (buildings,
equipments, etc). (Rose et al, 1993: 8)
2.6. Financial
development
The costs of acquiring information, enforcing contracts, and
making transactions create incentives for the emergence of particular types of
financial contracts, markets and intermediaries. Different types and
combinations of information, enforcement, and transaction costs in conjunction
with different legal, regulatory, and tax systems have motivated distinct
financial contracts, markets, and intermediaries across countries and
throughout history. In arising to ameliorate market frictions, financial
systems naturally influence the allocation of resources across space and time.
(Merton and Bodie, 1995: 12)
To organize a discussion of how financial systems influence
savings and investment decisions and hence economic growth, Levine (1996) focus
on five functions provided by the financial system. In easing information,
enforcement, and transaction costs, financial systems provide five broad
categories of services to the economy. While there are other ways to classify
the functions of the financial system, we believe that the following five
categories are helpful in organizing a review of the theoretical literature and
tying this literature to the history of economic thought on finance and growth.
In particular, financial systems:
- Produce information ex ante about possible investments and
allocate capital;
-Monitor investments and exert corporate governance after
providing finance;
-Facilitate the trading, diversification and management of
risk;
-Mobilize and pull savings;
-Ease the exchange of goods and services.
While all financial systems provide these financial functions,
there are large differences in how well financial systems provide these
functions. Financial development occurs when financial instruments, markets,
and intermediaries ameliorate- though do not necessarily eliminate-the effects
of information, enforcement, and transactions costs. Thus, the financial
development involves improvements in the above-mentioned functions.
2.7. Financial development
and Economic growth
Nobel Prize Laureates and other influential economists
disagree sharply about the role of the financial sector in economic growth.
Finance is not even discussed in a collection of essays by the «pioneers
of development economics», which includes three winners of the Nobel Prize
(Meier and Seers, 1984). Nobel Laureate Robert Lucas (1988) dismisses finance
as a major determinant of economic growth calling its role
«over-stressed».
Joan Ribinson (1952, p. 86) famously argued that» where
enterprise leads finance follows«. From this perspective, finance does not
cause growth; finance responds automatically to changing demands from the
«real sector».
At the other extreme, Nobel Laureate Merton Miller (1988: 14)
argues that, the idea that financial markets contribute to economic growth, is
a proposition too obvious for serious discussion. Similarly, Schumpeter (1912),
Gurley and Shaw (1955) and McKinnon (1973) have all rejected the idea that the
finance-growth nexus can be safely ignored without substantially impending our
understanding of economic growth.
Resolving the debate and advancing our understanding about
the role of financial sectors in economic growth has helped to distinguish
among competing theories of the process of economic growth.
Furthermore, information on the importance of finance in the
growth process has affected the intensity with which researchers study the
determinants, consequences and evolution of financial systems. Finally, a
better understanding of the finance-growth nexus may influence public policy
choices since legal, regulatory, tax and macroeconomic policies all shape the
operation of financial systems.
2.8. Formal financial
sector and Economic activities
The formal financial sector falls under the banking law and
regulations and supervision of financial authorities. It includes various kinds
of banks (commercial, development and specialized, regional, cooperatives),
insurance companies, social security schemes, and pension funds and some
counties capital markets.
In many countries, the formal financial sector is largely
urban-based and organized primarily to supply the financial needs of the
wealthier population and large co-operations.
Formal financial intermediaries, such as commercial banks
usually refuse to serve poor households and micro-enterprises because of the
high cost of small transactions, lack of traditional collateral, and lack of
basic requirements for financing and geographical isolation by doing so, these
institutions ignore the economic potential in talents and entrepreneurship of
this stratum of society. In many developing countries the formal financial
sector serves only 5%-20% of the population and the number of institutions are
very limited (Gallard A.O, 2003: 68).
However, the share of the formal financial sector in total
assets is about 95% this means that poor people in developing countries depend
on semi-formal and informal financial intermediaries for their credit needs.
2.9. Semi-formal financial
sector and Economy
The organizations in the semi-formal financial authorities;
nevertheless, they may operate under particular laws and regulations. This
sector includes credit unions, non-government organizations (NGOs) and Micro
Finance Institutions (MFIs). The semi-formal financial sector operates in urban
as well as rural areas and is mostly dependent on subsidies and assistance from
governments or donors and principally from central bank.
These contribute more significantly to rural and urban
employment and purchasing power that provokes the increment of social welfare
and economy in general. (Robertson, 2001: 162).
2.10. Informal financial
sector and Economic activities
The informal sector is characterized in general, by social
structures, individual operators, ease of access, simple procedures, rapid
transactions and flexible loan terms and amounts. It includes local
member-based organizations such as rotating savings and credit associations and
self-help organizations. Individual money lenders also are widely found in
developing countries. There are many types of informal money lenders including
shopkeepers, traders, and landlords.
Last but not least, there are relatives, friends and neighbors
from whom those in need can borrow, although primarily for emergencies or
special purposes rather than for going working capital needs. In this
situation, lenders tend to provide small loans at no or low interest, but they
may expect non financial obligations in return for their credit. (Robertson,
2001: 162).
2.11. Problems affecting
financial development in developing countries
One of the major factors affecting financial sector
development in developing countries and Africa in particular according to
Richard and Montiel (1999) is the regressive mechanisms of monetary control.
Many African countries choose to repress their financial systems by adopting
direct instruments of monetary policy hence preventing their financial sectors
from operating at their full potential. Monetary policy in repressive regimes
consists of imposition of high reserve requirements on banks as well as legal
ceiling on lending and borrowing rates. Interest rates are fixes at
unrealistically low rates that are often negative in real terms.
The consequence of this, is an inefficient linkage between the
supply of savings and the demand for investments. The failure to signal true
sacristy of capital and the flows of capital is created, and therefore
unnecessary low growth of the economic is initiated.
In addition to fixing interest rates, financial repression may
consist of introducing all kinds of regulations, laws and other forms of market
restrictions to bank behavior and other intermediaries. Restrictions are
imposed on the competition of banking industry by forming barriers to entry
into the banking system or through public ownership of bank. Restrictions can
also be imposed on the composition of the bank portfolio, by putting
requirements that banks engage in certain form of lending, as well as
prohibitions from acquiring other types of assets. It includes the imposition
of liquidity ratios, requiring banks to invest specific shares of their
portfolio in government instruments, as well as directed lending to specific
sectors, typically the export sector and agriculture.
Besides financial repression, poor macroeconomic policy
management has been noted as other serious obstacles to financial development
in developing countries (Richard and Montiel, 1999). Those policies include
among others; price controls, foreign exchange allocation, infrastructure
bottlenecks, overvalued exchange rates, and financial mismanagement. However,
Richard and Montiel (1999) believe that administered exchange and credit
allocation policies may not be easy to reform because of permanent balance of
payment problem and associated shortage of foreign exchange services.
African countries are also characterized by present potential
instabilities, wars, conflicts and nonconductive macroeconomic environment.
Such factors can increase the risk of breaking financial contracts and loosing
funds and hence discourage the flow of funds into such areas.
Richard and Montiel (1999) further argue that developing
countries have common microeconomic problems, which can hinder financial
development. In particular they focus on the weak bank management (including
lack of professional staff, inadequate capital, etc).
Furthermore, bank supervision characterized by over reliance
on external audits, outdated laws, lack of surveillance capacity, and
inadequate punitive control powers of central bank has received special
attention from researchers.
To summarize microeconomic obstacles to financial development
in Africa, Collier (1990) focused on the CAMEL framework (capital adequacy,
asset quality, earnings, and liquidity).
2.12. Banking institutions
Accept money deposits from and make loans to individual
consumers and businesses. Some of the most important banking institutions
include: commercial banks, savings and loan associations, credit unions, and
mutual savings banks. Historically, these have all been separated institutions.
However, new hybrid forms of banking institutions that perform two or more of
theses functions have emerged over the last two decades. The following banking
institutions all have one thing in common: they are businesses whose objective
is to earn money by managing, safeguarding, and lending money to others. Their
sales revenues come from the fees and interest that they charge for providing
these financial services. (O.C.Ferrel, 2006)
Ø Commercial banks: the largest and
oldest of all financial institutions, relying mainly on checking and savings
accounts as sources of loans to businesses and individuals.
Ø Savings and loans associations: are
financial institutions that primarily offer savings accounts and make long term
loans for residential mortgages; also called thrifts.
Ø Credit union: is a financial
institution owned and controlled by its depositors who usually have a common
employer, profession, trade group or religion.
Ø Mutual saving banks: are financial
institutions that are similar to saving and loan associations but, like credit
unions; are owned by their depositors.
Ø Insurance for banking institutions:
they insure individual bank accounts.
Ø National credit union association
(NCUA): is agency that regulates and charters credit unions and
insures their deposits through its national credit union insurance fund.
2.13. Non banking
institutions
Offer some financial services, such as short term loans or
investments products, but do not accept the deposits. These include insurance
companies, pension funds, mutual funds, brokerages firms, non financial firms
and finance companies.
v Insurance companies: businesses that protect
their clients against financial losses from certain specified risks (death,
accident and theft, etc)
v Pension funds: managed investment pools set
aside by individuals, corporations, unions, and some nonprofit organizations to
provide retirement income for members.
v Mutual fund: an investment company that pools
individual investor dollars and invests them in a large numbers of
well-diversified securities.
v Brokerage firms: firms that buy and sell
stocks, bonds, and other securities for their customers and provide other
financial services.
2.14. Diversified firms
ü Finance companies: business that offers
short term loans at substantially higher rates of interest than banks.
ü Electronic banking: since the advent of
the computer ages, a wide range of technological innovations has made it
possible to move money all across the world electronically. Such as paper less
transaction have allowed financial institutions to reduce costs in what has
been virtual competitive battle field.
· Electronic Fund Transfer (EFT): any
movement of funds by means of an electronic terminal, telephone, computer or
magnetic tape such transactions order a particular financial institution to
subtract money from one account and add it to another. The most commonly used
form of EFT are automated teller machines, automated clearing-houses, and home
banking systems.
· Automatic Teller Machines (ATM):
is the most familiar form of electronic banking, which dispenses cash,
accepts deposits and allows balance inquires and cash transfers from one
account to another. ATMs provide 24 hours banking services, both at home and
far away.
· Automated Clearing Houses (ACHs):
a system that permits payments such deposits or withdraws to be made
to and from bank account by magnetic computer tape.
· Online banking (home banking
systems): with the growth of the internet banking activities may
now be carried out on a computer at home or at work, or through wireless
devices such as cell phone any where there is a wireless «hot point»
consumers and small businesses can now make a bewildering any of financial
transactions at home or on the go 24 hours a day. (O.C.Ferrel,2006)
2.15. The role of financial
system
Providing payment services
It is inconvenient, inefficient and risky to carry around
enough cash to pay for purchased goods and services. Financial institutions
provide on efficient alternative. The most obvious examples are personal and
commercial checking and check-clearing and credit card services, each are
growing in importance, in the modern sectors at least of given low-income
countries. (O.C.Ferrel, 2006)
Matching savers and investors
Although many people save such as for retirement and many have
investment projects, such as building of a factory or ex-pending the inventory
carried by family microenterprise, it would be only the wildest of coincidences
that each investor saved exactly as much as needed to finance a given project.
Therefore, it is important that savers and investors somehow meet and agree on
terms for loans or other forms of finance.
This can occur without financial institutions, even in highly
developed markets, many new entrepreneurs obtain a significant fraction of
their initial funds from family and friends. However, the presence of banks and
later venture capitalists or stock markets, can greatly facilitate matching in
an efficient manner. Small savers simply deposit their savings and let the bank
decide where to invest them.
Financial systems play a key role in the smooth and efficient
functioning of the economy;
Their most fundamental contribution is to channel resources
from individuals and companies with surplus resources to those with resources
deficit;
The financial system not only mobilizes the savings of the
economy but also facilitates the accumulation of investment capital that is
critical to growth and development. (O.C.Ferrel, 2006)
2.16. Structure of Rwandan
financial sector
Rwandan financial sector is relatively small. It comprises: 8
commercial banks, 3 specialized banks (BHR, BRD and CDHR), one microfinance
bank (UOPB), 122 micro finances institutions, 8 insurance companies, one public
pension fund (CSR), 10 growing private pension funds.(NBR website)
2.17. Recent evolution of
Rwandan banking sector
In the 1980s a deep transformation of Rwandan
financial system began. At that point, Rwandan banks were public-owned and
operated under over-regulatory environment in which both lending and borrowing
rates were determined by the authorities, banks were subjected to a legal
service requirement which presented a compulsory credit to the government (and
was the main instrument of monetary policy conditions as open market operations
did not exist), and system of quotas that placed ceiling on the amount of
credit that banks could provide to specific sectors.
The transformation was initiated with a profound deregulation
effort. Interest rates were liberalized; the legal reserve requirement was
lifted while the central bank was declared autonomous and started to use open
market operations to conduct monetary policy, and cross-ownership restrictions
that prevented the formation of financial groups-were removed.
In addition, in1997 a new law was approved allowing banks to
participate in a wide variety of activities such mutual funds and management
derivatives trading, foreign exchange dealings. This deregulation effort
created the conditions to have a more competitive banking system.
After deregulation, came the privatization process. Rwandan
banks had been created in 1980s, in 2000, a presidential decree
created the special committee for bank privatization.
The process was divided into two stages: 1) all groups
interested in acquiring a bank had to be pre-approved on the basis of technical
capability, financial situation and honorability. 2) All pre-approved groups
sent their economic proposals and bank went to the highest bidders. One
important condition was that, priority was given first to the Rwandan
nationals.
The newly privatized banks have started to provide credit in
an accelerated form. Credit outstanding to the private sector has increased
from 14% of GDP in 2000 to 20% of GDP in 2005. Unfortunately, given the
inexperience of some new bankers, this increase in credit was accompanied by a
steep in the non-performing loans.
Banks in Rwanda are generally well run and provide a range of
most important financial services. There is however room for the expansion of
activities as the economy recovers; there will be scope for other institutions
to enter the market.
European banking institutions have played a major role in the
development of commercial banking in Rwanda. During the last 40 years,
commercial banking has been dominated by three main commercial banks:
Banque Commerciale du Rwanda (BCR) was founded on
9th April 1963 by Banque Bruxelles Lambert, it has a share capital
of two billion Frw as at 31st Dec 2001 and have six branches. BCR is
one of the leading commercial banks in Rwanda. Its head office is located in
Kigali at rue de la revolution. On 2nd Oct 2004 an investment
company owned by Actis Africa fund acquired 80% share in BCR and 19.8% are
still in government hands and the remaining of 0.2% in hands of some private
investors.
Banque de Kigali s.a (BK) created on 22nd Dec 1966
and began its activities on 17th Jan 1967. At the beginning, it had
a share capital of 40 million Frw divided into 20,000 shares.
Fina Bank s.a formerly known as Banque Continentale Africaine
duRwanda (BACAR) established in 1983 by Banque Continentale du Luxembourg. The
bank was liquidated on orders of the national bank of Rwanda (NBR) for it had
provided its insolvency beyond a reasonable doubts and the government of Rwanda
owner of 80% of the shares.
Later the bank's assets were sold to commercial company
dealing in petroleum products called FINA and it renamed FINA BANK. It
continues to carry out commercial activities and it is now being owned
privately.
However, other commercial banks have emerged after the resume
of activities from the 1994 genocide.
Banque de Commerce, de Development et d'Industries (BCDI)
which become Ecobank, established in 1995 with a share capital of 1.1 billion
Frw.
Banque à la confiance d'Or (BANCOR) created in 1995 but
has been acquired by new owners. And then there is a Companie Generale des
Banques (COGEBANQUE) that was created in July 1999.
Throughout the early times of 1980s was a period of
moderate economic growth, total assests of the commercial banks increased by
70% between 1982 and 1986, while the ratio of average total commercial bnks to
GDP increased from 9.2% to 12.6% (NBR, 1996: 143).
Although the Rwandan government has equal participation in all
six commercial banks, their day to day management has been largely the
responsibility of the foreign shareholders. However, Rwandan commercial banks
are undercapitalized and their loan loss provisions are inadequate. This
combined with the excessive concentration in a few priority economic activities
makes commercial banking system quite vulnerable. (Rwanda financial sector
review,2004: 143).
The commercial banking market is characterized by the
concentration of its business activities in Kigali, where between 80% and 90%
of all bank banking transactions are carried out (BNR; 1999: 146). Each bank
strives to win over a core group of approximately 50 major customers, in
respect of both deposits and loans. The three largest commercial banks have
offices outside Kigali essentially to capture deposits transfer funds abroad.
BCDI opened three offices in the border areas, which started operating after
2001. NBR (2001).
2.18. Monetary policy
It is first responsibility of central bank, Means by which
central bank uses to control amount of balancing money available in the economy
for demand and supply. (O.C. Ferrell et al, 2006)
2.18.1 Theory on monetary
policy
Monetary policy is the process by which the government,
central bank, or monetary authority of a country controls (i) the supply of
money, (ii) availability of money, and (iii) cost of money or rate of interest
to attain a set of objectives oriented towards the growth and stability of the
economy. Monetary theory provides insight into how to craft optimal monetary
policy.
Monetary policy rests on the relationship between the rates of
interest in an economy, that is the price at which money can be borrowed, and
the total supply of money. Monetary policy uses a variety of tools to control
one or both of these, to influence outcomes like economic growth, inflation,
exchange rates with other currencies and unemployment.
Where currency is under a monopoly of issuance, or where there
is a regulated system of issuing currency through banks which are tied to a
central bank, the monetary authority has the ability to alter the money supply
and thus influence the interest rate (to achieve policy goals).
If policymakers believe that private agents anticipate low
inflation, they have an incentive to adopt an expansionist monetary policy
(where the
marginal
benefit of increasing economic output outweighs the
marginal cost of
inflation); however, assuming private agents have
rational
expectations, they know that policymakers have this incentive. Hence,
private agents know that if they anticipate low inflation, an expansionist
policy will be adopted that causes a rise in inflation. Consequently, (unless
policymakers can make their announcement of low
inflation credible), private agents expect high inflation. This
anticipation is fulfilled through adaptive expectation (wage-setting behavior);
so, there is higher inflation (without the benefit of increased output). Hence,
unless credible announcements can be made, expansionary monetary policy will
fail.
While a central bank might have a favorable reputation due to
good performance in conducting monetary policy, the same central bank might not
have chosen any particular form of commitment (such as targeting a certain
range for inflation).
Reputation plays a crucial role in determining how much
markets would believe the announcement of a particular commitment to a policy
goal but both concepts should not be assimilated. Also, note that under
rational expectations, it is not necessary for the policymaker to have
established its reputation through past policy actions; as an example, the
reputation of the head of the central bank might be derived entirely from his
or her ideology, professional background, public statements, etc.
In fact it has been argued that to prevent some pathologies
related to the
time
inconsistency of monetary policy implementation (in particular
excessive inflation), the head of a central bank should have a larger distaste
for inflation than the rest of the economy on average. Hence the reputation of
a particular central bank is not necessary tied to past performance, but rather
to particular institutional arrangements that the markets can use to form
inflation expectations.
Despite the frequent discussion of credibility as it relates
to monetary policy, the exact meaning of credibility is rarely defined. Such
lack of clarity can serve to lead policy away from what is believed to be the
most beneficial. For example, capability to serve the public interest is one
definition of credibility often associated with central banks.
The reliability with which a central bank keeps its promises
is also a common definition. While everyone most likely agrees a central bank
should not lie to the public, wide disagreement exists on how a central bank
can best serve the public interest. Therefore, lack of definition can lead
people to believe they are supporting one particular policy of credibility when
they are really supporting another. (
B.M. Friedman,
2001)
According to Ferrell, there are four basic tools of monetary
policy:
Open market operations: refers to decisions
to buy or sell the T-bills and investments in the open market. This monetary
tool is the most commonly employed of all central banks operations, is
performed almost daily in an effort to control the money supply
Reserve requirement: is the percentage of
deposits that banking institutions must hold in reserve. Funds so held are not
available for businesses and consumers. Because the reserve requirement has
such a powerful effect on the money supply, the central bank does not change it
very often, relying instead on open market operations most of the time.
Discount rate: is the rate of interest the
central bank charges to loan money to any banking institution to meet reserve
requirements.
Credit control: the authority to establish
and enforce credit rules for financial institutions and some private
investors.
Regulatory function: second responsibility of
central bank is to regulate banking institutions that are members of central
bank.
Accordingly, the National Bank of Rwanda establishes and
enforces banking rules that affect monetary policy and the overall level of the
competition between different banks. It determines which non-banking
activities, such as brokerage services, leasing and insurance, are appropriate
for banks and which should be prohibited.
The National Bank of Rwanda is also responsible for
supervising the central insurance funds that protects the deposits of member
institution. (O.C. Ferrell et al, 2006)
2.19. Bank credit and
transmission of monetary policy
For modern industrial countries the usual point for a
discussion of monetary transmission channels is the effect of monetary on
interest rates. Policy changes are transmitted from interest rates to aggregate
demand through various channels, first, increase in interest rates reduce the
expenditure of private non financial sector by raising the cost of obtaining
funds. Second, expenditure of private non financial sector is curbed by
negative quantities and land.
Third, interest rates affect the exchange rates and stimulate
the economy by changing the international price competitiveness of domestic
firms. These combined channels of monetary policy have become known as
«money view» of the monetary policy. (Carlos Serrano, 2001: 65).
Several conditions must be presented simultaneously for a bank
credit channel of monetary policy to operate (Kashap and Stein, 1994:
278).first, monetary policy must be able to affect the total volume of bank
intermediation (securities and loans).
Reserve requirement impose on deposit liabilities are argument
for monetary control, but not all bank liabilities are subjected to reserve
requirements. Banks can borrow (CDs, equity, bonds loans) to finance
intermediation. Even if bank credit is special, the leverage of monetary policy
over bank lending may be limited. (Romer, 1990: 51).
According to (Gorton and Pennacchi, 1993: 333), the increase
in research on a credit channel for monetary policy can be attributed to four
main motives: 1) Desire for new policy instruments in addition to the
traditional instrument money supply or interest rates.
They argued that, a bank credit channel might allow central
bank actions to affect the real spending of borrowers directly and improve the
trade-off between inflation and output objectives, or exchange rate and
domestic economic objectives. This concept of credit controls is reminiscent of
policies used in many countries. 2) Reduced the share of bank credit in the
total amount of funds available to the private sector.
Thonton (1994: 71) and Ceccetti (1995: 30), contend that, if
the economic effect of monetary policy depends on the influence that the
central bank has on the lending behavior of commercial banks, monetary policy
may be in danger of losing its effectiveness.
Furthermore, some authors have argued that deregulation,
innovation and global integration of financial market tend to reduce the
influence of central bank on market interest rates. While bank credit becomes a
reduced factor in funding the private sector, central banks may increasingly
have to rely on bank credit channel to affect the economy. 3) To examine the
credit channel is to develop a more reliable information variable for monetary
policy. The experience in many countries is that the short-run relationship
between money aggregates and the economy tends to breakdown time to time. If
the credit channel is important, bank credit aggregates may be more reliable
indicators of monetary policy effects than money aggregates (Friedman, 1983:
353), changes in the way banks create deposit money may provide useful
information on the relationship between money and economy. 4) Use of credit
channel is strengthened the case for the proposition that monetary policy
affects the real economy. Despite a large body of statistical evidence in favor
of short run real effects of monetary policy, the transmission mechanisms
remain unclear.
It has remained a somewhat troublesome proposition that
relatively small changes on real interest rates cause such pronounced effects
on investment, consumer expenditure (Bernanke and Gertler, 1995).
Bernanke and Blinder (1988: 78), Greenwald and Stiglitz (1990:
149) show how interaction with bank credit increases the real effect of
monetary policy, while at the same time mitigating the effect on market
interest rates.
Bernanke and Blinder (1988: 79) argue that, uses of credit
channel dependent on the relationship between money effects and bank credit;
effects on economic activity.
Money and bank credit are two sides of the same balance sheet
and bank loans are the main source of the expansion of the deposit money in the
modern fractional-reserve banking systems. The money view of the transmission
of monetary policy contends that, as a first approximation, the volume and the
composition of bank credit is important.
2.20. Role of a central
bank
In developed nations, the central bank, conduct a wide range
of banking, regulatory and supervisory functions. They have a substantial
public responsibilities and abroad array of executive powers. Their major
activities can be grouped into five general functions:
Issuer of currency and manager of foreign
reserves
Central bank prints money, distributes notes and coins,
intervenes in foreign-exchange markets to regulate the national currency's rate
of exchange with other currencies and manage foreign assets reserves to
maintain the external value of the national currency.
Banker to the government
Central bank provides bank deposit and borrowing facilities to
the government while simultaneously acting as the government's fiscal agent and
under writer.
Banker to domestic commercial banks
Central bank also provides bank deposit and borrowing
facilities to commercial banks and act as a lender of last resort to
financially troubled commercial banks.
Regulatory of domestic financial
institutions
Central bank ensures that commercial bank and other financial
institutions conduct their business prudently and in accordance with relevant
laws and regulations. It also monitors reserve ratio requirements and supervise
the conduct of local and regional banks.
Operator of monetary and credit policy
Central bank attempts to manipulate monetary and credit policy
instruments (the domestic money supply, the discount rate, foreign exchange
rate, commercial bank reserve ratio requirement, etc) to achieve major
macroeconomic objectives such as controlling inflation. (Rose, 1993)
CHAPTER III:
METHODOLOGY
3.1. Introduction
This chapter explains in few words how the research has been
conducted. It gives the plan, strategy research design that is required for the
study. Plan includes what is done from writing the hypotheses and their
operational implications to the final analysis of data. Strategy includes the
methods to be used to gather and analyze the data and implies how the research
objectives was reached and how the problems encountered will be tacked
(Kerlinger, 1973: 300)
The study covers the period of 1995-2010. It includes
explanatory variables that explain the money stock. These variables are
typically of those identified in most studies of role of central bank. The
money stock has been used as the dependent variable in the estimation. The
study employs an econometric technique of cointegration methodology. The data
that are used in this study are secondary data obtained from Ministry of
Economics and Finance, Rwanda National Institute of Statistics publications as
well as reports prepared by National Bank of Rwanda.
3.2. Data collection
3.2.1. Sources of data
Secondary data: data analysis in the
econometric part of this research requires data provided by different
institutions. As such, these data are secondary data. The National Bank of
Rwanda is the principally source of data on Inflation, GDP, exchange rate and
of course Money supply. So, figures on these indicators as well as on other
that could help specify an appropriate Taylor rule model have been collected at
the National Bank of Rwanda. But because a big part of the research deals with
the role of Central Bank on Rwandan economic development , the national bank of
Rwanda is not only a source of data.
Primary data: the methodology for
the compilation of the role of National Bank of Rwanda (NBR) at the beginning
of the research through monetary policy. So, staff from the national bank of
Rwanda provided useful information on how the Inflation, Money stock, GDP and
Exchange had been compiled during the period covered by the present research.
Because the researcher had difficulty of finding out that
piece of information, it became necessary to interview the staff in charge of
the research at the National Bank of Rwanda.
3.2.2. Data collection
procedure
Most of the data was collected from the NBR library. Where,
the staff was very helpful in the delivering the appropriate documents. Many of
the documents were annual reports, but some other reading materials, like
monthly publications; relevant to this study was also provided.
3.3. Data processing
3.3.1. Editing
Much of the information did not come from one source. Indeed,
different publications had to be explored deeply. So, the figures from National
Bank of Rwanda had to be properly arranged so as to allow for the analysis
proceed.
3.3.2. Tabulation
The data from the National Bank of Rwanda have been then
arranged into table format. This exercise allows for comparison between
different indicators at the same period. Furthermore, it becomes possible,
thanks to tables, to have an idea of trends and their possible causes in time
series.
3.4. Data presentation,
analysis and interpretation
The data obtained were analyzed using econometrics
methodology. Money stock constitutes the dependent variable. The study employs
an econometric technique of cointegration methodology.
To formulate a monetary reaction function for National Bank of
Rwanda, the Taylor rule equation was adopted to the context of monetary policy
in Rwanda.
The original Taylor rule can be expressed as following:
FFR=f (YG, IG) (1)
Where: FFR= the federal funds rate, YG= the output gap, IG= the
inflation gap.
Because of data availability problems for the monetary base
series of Rwanda, the monetary stock aggregate (Mt) will be used as the
instrument policy. Indeed, the monetary stock aggregate (M) plays an important
role in Rwanda monetary policy since the National Bank of Rwanda assumed its
responsibility to regulate liquidity in the economy and the data of the
monetary base are frequently referred to Mt.
In respect of goal variables, inflation and output will be
used. The former variable has emerged from many economists as the real goal of
monetary policy in order to maintain price stability and the latter is
considered as a historically objective of monetary policy in various
countries.
In the context of Rwanda, the strategy used by the Central
Bank is to ensure that liquidity expansion is consistent with target inflation
and GDP growth levels. Thus, the modified version of Taylor's rule to be
estimated can be written as:
Mt= B0+ B1 (IGt) + B2
(YGt) + t (2)
However, recently, with number of empirical studies related to
the Taylor rule, economists argue that the exchange rate would also be an
essential state variable that has to be included in the model in the case of a
small and open economy. On this basis, the equation (2) is extended as
follow:
Mt= B0+ B1 (IGt) +
B2(YGt) + B3DEXt + t
(3)
EXt = the change in exchange rate in terms of the
Rwandan Francs per US Dollars,
B0 is constant term and B1, B2,
B3 are coefficients respectively to be estimated
empirically,
t = the error term that presents all other variables
which can have effects on Money stock in Rwanda.
The equation (3) can be seen as a function in which the money
stock aggregate reacts to the Inflation gap, Output gap and the change in
Exchange rate.
The version of the equation (3) to be empirically estimated can
take a dynamic form since there is the lag response of Monetary Authority. On
this basis, the equation (3) is expressed as follows:
LnMt= B0+ lnMt-1 + lnIGt +
lnIGt-1 +lnYGt + lnYGt-1 +lnDEXt
+lnDEXt-1 + t (4) and finally the equation (4) become:
Mt= B0+ B1Mt-1 +
B2IGt + B3IGt-1 +B
4YGt + B5YGt-1 +B
6DEXt +B7DEXt-1 + t
(5)
(Mukunzi, 2004: 34)
The Taylor Rule has been considered as a representation of
Central Bank behavior in various countries. It provides information about the
responsiveness of the monetary policy instrument to the monetary variables.
Therefore, estimating the policy behavior of the Rwandan Central Bank and
determining the target the Central Bank followed, is essential to the different
policy implications, especially to the implementation of an accurate and
successful monetary policy.
According to Mishkin (1997) six basic goals are continually
mentioned by Central Banks when they discuss the objective of monetary
policy:
- High employment level, - Economic growth, - Price stability,
- Interest- rate stability, - Stability of financial markets, - Stability in
foreign exchange rate markets.
The primary objective is to establish a model that explains
well the relationship between the money stock and some macroeconomic variables
in Rwanda. In addition, the qualitative and quantitative impacts of each of
these variables on money stock are determined. A lot of other information is
also obtained. For instance, it will be possible to know what the different
partial elasticity that pertained by each variable is.
The augmented Duckey-Fuller Unit Root Test will be used for
the purpose of data analysis throughout the research. According to Gujarati
(1999: 455-467), it is this test which detects the stationary of a variable.
Many other tests will also be conducted.
According to Gujarati (1999: 377-398), the Durbin-Watson test,
the Runs test or the examination of the residuals are techniques that will be
used in relation the problem of serial correlation.
3.5. Research techniques
3.5.1. Documentation
Time was devoted to searching for appropriate literature,
reports and reading material containing the underpinning theory. A great deal
of attention was devoted to publications on econometrics to provide the major
support for the current study. Also, a number of websites have been visited not
only in the intention of econometric modeling but also with the main of
acquiring knowledge on money stock determinants around the globe in general and
in economies similar to ours in particular. Many of these websites had
information on money stock theories.
3.5.2. Computer programs
The whole work of analyzing the data was done with the help of
computer programs. One search program that was used extensively in the study is
E-Views 3.1. The choice of E-Views 3.1 program is constrained by the
availability of programs and the appropriateness to handle the task at hand.
This program is chosen because it is appropriate for this kind of research and
can handle the estimations envisaged.
3.6. Limitations to the
study
Some problems were encountered mostly because of the way the
inflation has been compiled through the years. Indeed, prices of goods and
services that entered the CPI were collected in the Kigali area only.
Therefore, we do not really have data on inflation in Rwanda. What is available
is only a rough approximation of reality.
It is only with the recent creation of the national institute
of statistics of Rwanda that the methodology changed. Indeed, nowadays, the CPI
covers data collected all over the country. Another limitation was the
reliability of the data.
Because of different methodologies for compiling the monetary
stock, inflation, GDP and exchange; the BNR, the Ministry of Economics and
Finance (MINECOFIN) and Rwanda National Institute of Statistics (RNIS) have
different values.
CHAPTER
IV . MODEL ESTIMATION AND FINDINGS
4.1. Introduction
So far we have presented the literature both on theoretical
and empirical side on the causality between economic development and central
bank through financial development. It is now time to turn to the empirical
testing of this relationship for Rwandan economy. This chapter presents the
results obtained from econometric testing and discusses the meaning and reason
behind the figures.
4.2. Historical background
of National Bank of Rwanda (NBR)
It is most impossible to dissociate the study of Rwanda's
monetary history from that of the former Congo and Burundi, since the three
countries had, until 1960, a common currency issued by a common monetary
authority.
At the end of 19th century and early
20th century, transactions in Belgian Congo was as well as in
Rwanda. Burundi was rudimentary. The means of transactions used included salt,
ivory, shells, copper, hoes, and axes. During the earliest days of the
exploitation of railway in Belgian Congo, people used chickens to play their
tickets. As in many African countries it was rather a barter economy.
In October 1912, the bank of Belgian Congo issued its first
convertible bank notes of 20, 10, and 1000 francs. The circulation of these
banknotes was difficult despite its extension to Rwanda-Burundi territories.
(BNR handbook, 1964-89: 13).
Congo became independent on 30th June 1960 and
acquired a political status different from that of Rwanda-Burundi.
Consequently, a review of statutes of the institutions common to Congo and
Rwanda-Burundi was necessary. (BNR handbook, 1964: 14).
The role of decree of 21th August 1960 established
a public institution called «Banque d'emission du Rwanda et du
Burundi» (B.E.R, B.) whose heard office was in Bujumbura with a branch in
Kigali.
Banque d'Emission du Rwanda et du Burundi's mission was to
promote the economic development, the development of human and material
resources as well as currency stability.
Rwanda and Burundi common monetary system did not last for
long. Political economic and psychological factors led to the dissolution of
this union.
Rwanda, which was kept apart from the Leopoldville centre of
influence, noticed once again that the installation of various common
institutions in Bujumbura would harm its economic development. The years of
economic and monetary union were just a failure, each party feeling cheated and
blaming each deficiency on the other party.
The divorce between Rwanda and Burundi became a reality when
the economic union was liquidated from 1st January 1964. (BNR
handbook, 1964: 15).
A liquidation committee was put in place. Its outcomes were
the convention of 18th May 1964 that put on end to the common
monetary rule and to the issuing authority imparted to the B.E.R.B.
The National Bank of Rwanda, established by the law of
24th April 1964, came into force from 19th May 1964 with
the aim of fulfilling one of its main missions, namely the issuing of currency
on Rwandan territory. The B.E.R.B. rights and obligations were ex officio
transmitted to the Royal Bank of Burundi (BRB) and to the National Bank of
Rwanda (BNR).(BNR handbook,1964:15).
4.3. Mission of National
Bank of Rwanda
Main mission of the Rwandan central bank are to ensure and
maintain price stability, to enhance and maintain a stable and competitive
financial system without any exclusion, to support government general economic
policies, promoting investment or regulating international currency movements.
(NBR, website)
4.4. Activities and
Objectives of the NBR
The objectives the BNR are to preserve the value of the
currency and to ensure its stability. To do so it exercises control on money
supply and credit, it ensures good functioning of the money and the foreign
exchange markets. It controls the working of the banking and financial
system.
Being the central bank, it has the exclusive right to carry
out the following activities so as to fulfill its objectives:
Issue of currency, act as a bank for the government, control
foreign exchange and manage foreign services.
The NBR is the monetary authority of the state, it formulates
monetary policy, supervises all banks and quite often carriers out research for
economic planning purposes.
It is the duty of the NBR to ensure quality of the Rwandan
francs, in times of durability, portability and more importantly ensure a
stable parity with other currencies.
In its capacity as the government's bank, the NBR does hold
the government accounts, administers all government transactions and lends to
government, though at an interest. The NBR sells government treasury bills. In
ensuring a good and effective foreign exchange market, the NBR controls and
manages foreign reserves. In pursuing that, the NBR carries out the following
duties:
- Fixing the exchange rate at a realistic level to ensure an
equitable balance of payment and price stability.
- Suppress the double foreign exchange market
- Liberalizing trade, both imports and exports and capital
transfers.
The NBR, in its duty to ensure an effective foreign exchange
market, introduced forex-bureau and liberalized the exchange rate, to be
determined by forces of demand and supply.
In the domain of institution reform, on 26 July 1997,
the act of parliament No.11/97 was passed promulgating the National Bank's
statutes. The statutes confer to the bank larger autonomy and powers than
before, necessary to fulfill its mission.
With respect to the bank circular No.02/97 of August
12th 1997 reorganizing the money market, the NBR now has autonomous
authority, on the money market, since that date. (NBR, website) Important
objectives of the bank are as follows: Issuing currencies, Managing
foreign exchange, Reserves, Regulates the money market, Maintaining
relationship with the Government and public institutions.
4.5. Used data
|
years
|
Mt
|
IG
|
YG
|
DEXCH(EX)
|
|
1995
|
62.9
|
-9.863
|
12.303
|
NA
|
|
1996
|
75.6
|
-4.698
|
19.649
|
6.47
|
|
1997
|
92.5
|
4.926
|
15.874
|
0.51
|
|
1998
|
97.8
|
-12.8
|
26.471
|
26.05
|
|
1999
|
104.2
|
4.48
|
70.009
|
18.81
|
|
2000
|
119.5
|
1.931
|
56.101
|
80.96
|
|
2001
|
130.7
|
-3.585
|
57.528
|
13.25
|
|
2002
|
144.3
|
4.19
|
75.261
|
28.19
|
|
2003
|
167.5
|
0.232
|
0.403
|
44.14
|
|
2004
|
187.4
|
-1.715
|
-0.23
|
61.45
|
|
2005
|
218.4
|
-3.514
|
0.17
|
-19.71
|
|
2006
|
286
|
3.307
|
-0.32
|
-6.01
|
|
2007
|
375.1
|
-2.502
|
-3.26
|
-4.8
|
|
2008
|
384.1
|
6.887
|
11.71
|
-0.2
|
|
2009
|
402
|
-4.663
|
25.93
|
21.47
|
|
2010
|
516.7
|
-6.173
|
3.74
|
244.73
|
Source of basic data: NBR, NISR and MINECOFIN
4.6. Test for
stationary
The footstep of this analysis is to determine whether the
series are stationary or not. The ADF was used to test for stationary of these
series as it provides a superior test to DF, especially in case the residuals
of the regression could be serially correlated. The lag length has been
automatically selected by AIC from eleven proposed lags and all three
possibilities have been tested: neither intercept nor trend, intercept but no
trend and both intercept and trend.
TABLE 4.1: Money Stock
stationary (MT)
|
ADF Test Statistic
|
5.023678
|
1% Critical Value*
|
-2.7411
|
|
|
5% Critical Value
|
-1.9658
|
|
|
10% Critical Value
|
-1.6277
|
|
*MacKinnon critical values for rejection of hypothesis of a unit
root.
|
|
|
|
|
|
|
|
|
|
|
|
Augmented Dickey-Fuller Test Equation
|
|
Dependent Variable: D(MT)
|
|
Method: Least Squares
|
|
Date: 07/20/11 Time: 09:07
|
|
Sample(adjusted): 1996 2010
|
|
Included observations: 15 after adjusting endpoints
|
|
Variable
|
Coefficient
|
Std. Error
|
t-Statistic
|
Prob.
|
|
MT(-1)
|
0.159544
|
0.031758
|
5.023678
|
0.0002
|
|
R-squared
|
0.322881
|
Mean dependent var
|
30.25333
|
|
Adjusted R-squared
|
0.322881
|
S.D. dependent var
|
33.05061
|
|
S.E. of regression
|
27.19644
|
Akaike info criterion
|
9.508390
|
|
Sum squared resid
|
10355.05
|
Schwarz criterion
|
9.555593
|
|
Log likelihood
|
-70.31292
|
Durbin-Watson stat
|
1.871053
|
As /ADF/ is greater than /5%/
critical value, MT is stationary at lag 0, level and function
of none.
TABLE 4.2: Inflation Gap
stationary (IG)
|
ADF Test Statistic
|
-4.663015
|
1% Critical Value*
|
-4.0113
|
|
|
5% Critical Value
|
-3.1003
|
|
|
10% Critical Value
|
-2.6927
|
|
*MacKinnon critical values for rejection of hypothesis of a unit
root.
|
|
|
|
|
|
|
|
|
|
|
|
Augmented Dickey-Fuller Test Equation
|
|
Dependent Variable: D(IG)
|
|
Method: Least Squares
|
|
Date: 09/19/11 Time: 11:40
|
|
Sample(adjusted): 1997 2010
|
|
Included observations: 14 after adjusting endpoints
|
|
Variable
|
Coefficient
|
Std. Error
|
t-Statistic
|
Prob.
|
|
IG(-1)
|
-2.059676
|
0.441705
|
-4.663015
|
0.0007
|
|
D(IG(-1))
|
0.347099
|
0.247617
|
1.401760
|
0.1886
|
|
C
|
-1.341209
|
1.262206
|
-1.062591
|
0.3107
|
|
R-squared
|
0.796606
|
Mean dependent var
|
-0.105357
|
|
Adjusted R-squared
|
0.759626
|
S.D. dependent var
|
9.320982
|
|
S.E. of regression
|
4.569890
|
Akaike info criterion
|
6.064265
|
|
Sum squared resid
|
229.7229
|
Schwarz criterion
|
6.201206
|
|
Log likelihood
|
-39.44985
|
F-statistic
|
21.54115
|
|
Durbin-Watson stat
|
1.603652
|
Prob(F-statistic)
|
0.000157
|
As /ADF/ is greater than all
critical values especially /5%/, IG is stationary at lag 1,
level and function with intercept.
Table 4.3: Output Gap
stationary
|
ADF Test Statistic
|
-4.887496
|
1% Critical Value*
|
-4.1366
|
|
|
5% Critical Value
|
-3.1483
|
|
|
10% Critical Value
|
-2.7180
|
|
*MacKinnon critical values for rejection of hypothesis of a unit
root.
|
|
|
|
|
|
|
|
|
|
|
|
Augmented Dickey-Fuller Test Equation
|
|
Dependent Variable: D(YG,3)
|
|
Method: Least Squares
|
|
Date: 09/19/11 Time: 12:11
|
|
Sample(adjusted): 1999 2010
|
|
Included observations: 12 after adjusting endpoints
|
|
Variable
|
Coefficient
|
Std. Error
|
t-Statistic
|
Prob.
|
|
D(YG(-1),2)
|
-2.449332
|
0.501143
|
-4.887496
|
0.0009
|
|
D(YG(-1),3)
|
0.595279
|
0.284900
|
2.089433
|
0.0662
|
|
C
|
-1.073325
|
9.702328
|
-0.110626
|
0.9143
|
|
R-squared
|
0.832995
|
Mean dependent var
|
-4.231833
|
|
Adjusted R-squared
|
0.795882
|
S.D. dependent var
|
74.27310
|
|
S.E. of regression
|
33.55613
|
Akaike info criterion
|
10.07663
|
|
Sum squared resid
|
10134.12
|
Schwarz criterion
|
10.19786
|
|
Log likelihood
|
-57.45980
|
F-statistic
|
22.44524
|
|
Durbin-Watson stat
|
1.843834
|
Prob(F-statistic)
|
0.000318
|
As /ADF/ is
greater than all critical values especially /5%/, YG is
stationary at lag 1, second difference and function with intercept.
TABLE 4.4: Variation of
Exchange stationary
|
ADF Test Statistic
|
-4.393650
|
1% Critical Value
|
-4.1366
|
|
|
5% Critical Value
|
-3.1483
|
|
|
10% Critical Value
|
-2.7180
|
|
*MacKinnon critical values for rejection of hypothesis of a unit
root.
|
|
|
|
|
|
|
|
|
|
|
|
Augmented Dickey-Fuller Test Equation
|
|
Dependent Variable: D(DEXCH,3)
|
|
Method: Least Squares
|
|
Date: 09/19/11 Time: 12:16
|
|
Sample(adjusted): 1999 2010
|
|
Included observations: 12 after adjusting endpoints
|
|
Variable
|
Coefficient
|
Std. Error
|
t-Statistic
|
Prob.
|
|
D(DEXCH(-1),2)
|
-1.616566
|
0.367932
|
-4.393650
|
0.0013
|
|
C
|
17.89631
|
23.68642
|
0.755552
|
0.4673
|
|
R-squared
|
0.658752
|
Mean dependent var
|
14.17417
|
|
Adjusted R-squared
|
0.624627
|
S.D. dependent var
|
133.8383
|
|
S.E. of regression
|
81.99966
|
Akaike info criterion
|
11.80232
|
|
Sum squared resid
|
67239.43
|
Schwarz criterion
|
11.88314
|
|
Log likelihood
|
-68.81391
|
F-statistic
|
19.30416
|
|
Durbin-Watson stat
|
1.534741
|
Prob(F-statistic)
|
0.001348
|
As /ADF/ is
greater than all critical values especially /5%/, DEXCH is
stationary at lag 0, second difference and function with intercept.
TABLE 4.5: Previous Money
Stock stationary
|
ADF Test Statistic
|
-3.699480
|
1% Critical Value*
|
-4.1366
|
|
|
5% Critical Value
|
-3.1483
|
|
|
10% Critical Value
|
-2.7180
|
|
*MacKinnon critical values for rejection of hypothesis of a unit
root.
|
|
|
|
|
|
|
|
|
|
|
|
Augmented Dickey-Fuller Test Equation
|
|
Dependent Variable: D(M1,3)
|
|
Method: Least Squares
|
|
Date: 09/19/11 Time: 12:20
|
|
Sample(adjusted): 1999 2010
|
|
Included observations: 12 after adjusting endpoints
|
|
Variable
|
Coefficient
|
Std. Error
|
t-Statistic
|
Prob.
|
|
D(M1(-1),2)
|
-1.159214
|
0.313345
|
-3.699480
|
0.0041
|
|
C
|
0.034242
|
8.436719
|
0.004059
|
0.9968
|
|
R-squared
|
0.577812
|
Mean dependent var
|
0.391667
|
|
Adjusted R-squared
|
0.535594
|
S.D. dependent var
|
42.88315
|
|
S.E. of regression
|
29.22374
|
Akaike info criterion
|
9.738851
|
|
Sum squared resid
|
8540.268
|
Schwarz criterion
|
9.819669
|
|
Log likelihood
|
-56.43311
|
F-statistic
|
13.68615
|
|
Durbin-Watson stat
|
2.076159
|
Prob(F-statistic)
|
0.004112
|
As / ADF/ is greater than / 5%/
critical value, M1 is stationary at lag 0, second difference
and function with intercept.
TABLE 4.6: Previous Inflation
Gap stationary
|
ADF Test Statistic
|
-4.663015
|
1% Critical Value*
|
-4.0113
|
|
|
5% Critical Value
|
-3.1003
|
|
|
10% Critical Value
|
-2.6927
|
|
*MacKinnon critical values for rejection of hypothesis of a unit
root.
|
|
|
|
|
|
|
|
|
|
|
|
Augmented Dickey-Fuller Test Equation
|
|
Dependent Variable: D(IG)
|
|
Method: Least Squares
|
|
Date: 09/19/11 Time: 11:40
|
|
Sample(adjusted): 1997 2010
|
|
Included observations: 14 after adjusting endpoints
|
|
Variable
|
Coefficient
|
Std. Error
|
t-Statistic
|
Prob.
|
|
IG(-1)
|
-2.059676
|
0.441705
|
-4.663015
|
0.0007
|
|
D(IG(-1))
|
0.347099
|
0.247617
|
1.401760
|
0.1886
|
|
C
|
-1.341209
|
1.262206
|
-1.062591
|
0.3107
|
|
R-squared
|
0.796606
|
Mean dependent var
|
0.105357
|
|
Adjusted R-squared
|
0.759626
|
S.D. dependent var
|
9.320982
|
|
S.E. of regression
|
4.569890
|
Akaike info criterion
|
6.064265
|
|
Sum squared resid
|
229.7229
|
Schwarz criterion
|
6.201206
|
|
Log likelihood
|
-39.44985
|
F-statistic
|
21.54115
|
|
Durbin-Watson stat
|
1.603652
|
Prob(F-statistic)
|
0.000157
|
As /ADF/ is
greater than all critical values especially /5%/, IG1 is
stationary at lag 1, level and function with intercept.
Table 4.7: previous Output
Gap stationary
|
ADF Test Statistic
|
-5.810852
|
1% Critical Value*
|
-4.1366
|
|
|
5% Critical Value
|
-3.1483
|
|
|
10% Critical Value
|
-2.7180
|
|
*MacKinnon critical values for rejection of hypothesis of a unit
root.
|
|
|
|
|
|
|
|
|
|
|
|
Augmented Dickey-Fuller Test Equation
|
|
Dependent Variable: D(YG1,3)
|
|
Method: Least Squares
|
|
Date: 09/19/11 Time: 12:27
|
|
Sample(adjusted): 1999 2010
|
|
Included observations: 12 after adjusting endpoints
|
|
Variable
|
Coefficient
|
Std. Error
|
t-Statistic
|
Prob.
|
|
D(YG1(-1),2)
|
-1.539314
|
0.264903
|
-5.810852
|
0.0002
|
|
C
|
1.842228
|
10.71345
|
0.171955
|
0.8669
|
|
R-squared
|
0.771512
|
Mean dependent var
|
0.864250
|
|
Adjusted R-squared
|
0.748663
|
S.D. dependent var
|
74.01819
|
|
S.E. of regression
|
37.10790
|
Akaike info criterion
|
10.21655
|
|
Sum squared resid
|
13769.96
|
Schwarz criterion
|
10.29737
|
|
Log likelihood
|
-59.29929
|
F-statistic
|
33.76600
|
|
Durbin-Watson stat
|
2.583075
|
Prob(F-statistic)
|
0.000170
|
As /ADF/ is greater than all
critical values especially /5%/, YG1 is stationary at lag 0,
second difference and function with intercept.
Table 4.8: Previous Variation
of Exchange stationary
|
ADF Test Statistic
|
-5.187147
|
1% Critical Value*
|
-4.1366
|
|
|
5% Critical Value
|
-3.1483
|
|
|
10% Critical Value
|
-2.7180
|
|
*MacKinnon critical values for rejection of hypothesis of a unit
root.
|
|
|
|
|
|
|
|
|
|
|
|
Augmented Dickey-Fuller Test Equation
|
|
Dependent Variable: D(DEXCH1,2)
|
|
Method: Least Squares
|
|
Date: 09/19/11 Time: 12:36
|
|
Sample(adjusted): 1999 2010
|
|
Included observations: 12 after adjusting endpoints
|
|
Variable
|
Coefficient
|
Std. Error
|
t-Statistic
|
Prob.
|
|
D(DEXCH1(-1))
|
-1.469962
|
0.283386
|
-5.187147
|
0.0004
|
|
C
|
1.485446
|
10.59132
|
0.140251
|
0.8912
|
|
R-squared
|
0.729045
|
Mean dependent var
|
2.302500
|
|
Adjusted R-squared
|
0.701949
|
S.D. dependent var
|
67.19665
|
|
S.E. of regression
|
36.68534
|
Akaike info criterion
|
10.19364
|
|
Sum squared resid
|
13458.14
|
Schwarz criterion
|
10.27446
|
|
Log likelihood
|
-59.16186
|
F-statistic
|
26.90649
|
|
Durbin-Watson stat
|
2.085680
|
Prob(F-statistic)
|
0.000409
|
As /ADF/ is greater than all
critical value /5%/, DEXCH1 is stationary at lag 0, first
difference and function with intercept.
Table 4.9: Error Term
stationary
|
ADF Test Statistic
|
-4.335477
|
1% Critical Value*
|
-4.1366
|
|
|
5% Critical Value
|
-3.1483
|
|
|
10% Critical Value
|
-2.7180
|
|
*MacKinnon critical values for rejection of hypothesis of a unit
root.
|
|
|
|
|
|
|
|
|
|
|
|
Augmented Dickey-Fuller Test Equation
|
|
Dependent Variable: D(E)
|
|
Method: Least Squares
|
|
Date: 07/20/11 Time: 09:46
|
|
Sample(adjusted): 1999 2010
|
|
Included observations: 12 after adjusting endpoints
|
|
Variable
|
Coefficient
|
Std. Error
|
t-Statistic
|
Prob.
|
|
E(-1)
|
-1.299467
|
0.299729
|
-4.335477
|
0.0015
|
|
C
|
16.62786
|
9.471546
|
1.755559
|
0.1097
|
|
R-squared
|
0.652734
|
Mean dependent var
|
1.986182
|
|
Adjusted R-squared
|
0.618007
|
S.D. dependent var
|
49.59723
|
|
S.E. of regression
|
30.65385
|
Akaike info criterion
|
9.834405
|
|
Sum squared resid
|
9396.583
|
Schwarz criterion
|
9.915223
|
|
Log likelihood
|
-57.00643
|
F-statistic
|
18.79636
|
|
Durbin-Watson stat
|
1.976710
|
Prob(F-statistic)
|
0.001477
|
As /ADF/ is
greater than /5%/ critical value, error term is stationary at 0 lag, level and
function with intercept.
Notes: all tests of stationary are done in Eviews 3.1
CUSUM TEST
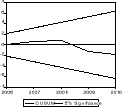
Source of basic data: BNR, NISR and MINECOFIN
As the line of cusum does not get out of the corridor, means that
the parameters of the regression model are stable.
M = 48.62344 + 0.996100M1 + 1.492988IG + 2.824734IG1 - 0.549954YG
+ 0.099609YG1 -
P (0.001) (0.003) (0.002)
(0.000) (0.02) (0.007)
0.088485EX - 0.311933EX1.
(0.0045) (0.01)
F table = 4.7 Fcritical =
38.02
R2 = 0.98 dw = 2.46
As dw is greater than R2, the estimated model is
correctly specified.
DW and BREUCH-GODFREY TEST show that there is no autocorrelation
because the
DW is the zone of none autocorrelation zone and nR2
> ÷2 for LM (Lagrangian Multiplier or
Breuch-Godfrey Test)
nR2=31.36 > X2 =9.88623
R2 is coming from estimation of errors.
All coefficients have an econometric sense explained by
Fcritical that is greater than Ftable , means that the
concerned variables have an effect on current money stock aggregate.
After testing stationary for all variables and model
specification, now interpretation.
4.7. INTERPRETATION OF THE
RESULTS
Considering the one period lagged value of the monetary stock
aggregate (M1), one observes that one unit change in the previous
period monetary stock aggregate results in about 0.99 units change in the
current monetary stock aggregate, holding other variables the same. This means
that, the increase of previous monetary stock aggregate by 1unit, current
monetary stock aggregate will increase by 0.99 units, so there is positive
relationship between the previous and the current monetary stock aggregate.
Considering the current and the one period lagged inflation
gap: It is noticed that for a given change in the one period lagged deviation
of the inflation from its target, the monetary stock aggregate reacts by a
change of about 1.49 units to current inflation gap and by a change of about
2.8 units to one period lagged inflation gap. This means that, if inflation
were 1unit point above its target, the Central Bank would increase the monetary
stock aggregate by 1.49 in terms of reaction against current inflation gap,
holding other things the same. Regarding the current period of inflation gap,
the coefficient 1.49 can be interpreted as the change in the value of monetary
stock aggregate following a unit change in current inflation gap in the same
period and same sense. If inflation were 1 point above its target, the Central
Bank would increase the monetary stock aggregate by 2.8 in terms of reaction
against previous inflation gap, holding other things the same. Regarding the
one year lagged period of inflation gap, the coefficient 2.8 can be interpreted
as the change in the value of monetary stock aggregate following a unit change
in previous inflation gap in the same period and same sense.
Considering the output, the results show that the Central Bank
of Rwanda reacts to 1unit change in the current output gap by a change of 0.54
units in the monetary stock aggregate inversely, and by a change of 0.09 units
in the monetary stock aggregate positively, holding other things the same.
Considering the exchange rate, the results show that the
Central Bank of Rwanda reacts to 1unit change in the current exchange rate by a
change of 0.08 in the monetary stock aggregate inversely and previous exchange
rate by 0.31 in the monetary stock aggregate inversely holding other things the
same.
When looking at the results more closely with the objective of
highlighting the variable that has influenced monetary policy decisions over
the period of study, it is apparent that the monetary authorities were mainly
concerned with the exchange rate. This is relevant given the importance of the
exchange rate in a small, open, and developing country especially Rwanda, in
the present case. Indeed, as noted previously, the exchange rate policy in
Rwanda aims at approaching a balanced level of the exchange rate, to stabilize
prices, to ensure a support for the growth and to connect Rwanda's foreign
exchange market to the international market. These objectives are pursued under
a controlled flexible policy regime, that is, the exchange rate can fluctuate
from day to day but the Central Bank attempts to influence the exchange rate by
buying and selling currencies in the foreign exchange market. The impact of
such interventions is to affect the monetary base. According to this fact, the
exchange rate considerations play a great role in the conduct of monetary
policy and this has been shown through the estimation results.
Given the fact that Rwanda has a strong dependence on
assistance from multilateral financial institutions which in its turn has a
real impact on the balance of payment, apparently, the importance of reacting
to exchange rates seems to be relevant in Rwanda since it could limit the
pressure exerted on the Rwanda currency in order to meet international prices
and the debt service management. In addition, these findings about the exchange
rate influence on monetary policy are consistent with the state of the Rwanda's
economy from 1995 when it started to benefit from financial assistance from
international institutions in the context of the Enhanced Structural Adjustment
Facility (ESAF) and the Poverty Reduction and Growth Facility (PRGF). This may
lead one to think that changes in the flow of international assistance could
contribute to the significant changes in official reserves for the country.
CHAPTER V. CONCLUSION AND
SUGGESTION
This dissertation intended to study how monetary policy was
conducted in Rwanda. The task has been accomplished by designing and estimating
a Taylor rule, monetary policy reaction function for the National Bank of
Rwanda over the period 1995-2010.
Applying Ordinary Least Squared (OLS) on data taken from the
National Bank of Rwanda, the Ministry of Economic and Finance of Rwanda and
Rwanda National Institute of Statistics (RNIS) together, the study shows that
the National Bank of Rwanda has had a monetary policy over the years with the
monetary stock aggregates as the principal instrument.
According to the Taylor rule, monetary policy responds
directly to inflation as any inflation-targeting central bank must. But it also
responds to the output gap, which can be viewed as a measure of inflationary
pressures.
The Rwanda Central Bank's reaction function can be
characterized by:
- A previous monetary stock aggregate weight of
(0.9961), which is positively related to the current monetary
stock aggregate,
- Current inflation gap weight of 1.492988,
which is positively related to the monetary stock aggregate,
- A previous inflation gap weight of
2.824734, which is positively related to the monetary stock
aggregate,
- A Current Output gap weight of - 0.549954 that is negatively
related to the monetary stock,
- A previous Output gap weight of 0.099609, which is
positively related to the monetary stock aggregate,
- A Current variation of Exchange weight of - 0.088485, which
is negatively related to the monetary stock,
- A previous variation of Exchange weight of -
0.311933, which is negatively related to the monetary stock.
Judging these results according to the importance of each
variable weight, one may be inclined to contend that while the National Bank of
Rwanda reacted to the inflation from the previous and the contemporaneous
period, there was a much stronger response to the change in the previous
exchange.
In general, such strong response of the National Bank of
Rwanda to the exchange rate may reflect the economic environment in which the
monetary policy was operating, because international aid has flow into Rwanda
since 1995 in the context of various economic programs undertaken with the help
of the International Monetary Fund (IMF) or World Bank (WB). In addition, the
estimated results indicated a neglect of output gap as a goal variable.
Given the fact that the Rwanda Central Bank claimed to be
following the objective of preserving the internal and the external value of
the currency in order to maintain harmony between the pace of the money
creation and that of economic growth it may be suggested that the Central Bank
of Rwanda should give more consideration to the way the output changes, that
is, the Central Bank should respond to the variation of output gap following
the influence of its change in the economic state.
In addition, the results of this study of course, are backward
looking, in the sense that they represent the relationships that existed so far
in the data. It is worth noting that a forward-looking model may enable the
implantation of a more successful monetary policy rule for Rwanda and there may
be areas for future research.
The NBR's monetary programming could benefit from attributing
a higher weight to the specification of money demand. The analysis in this
dissertation shows that, despite political and economic volatility, and
extensive controls, money demand, both in the short and long terms, reacts in a
way consistent with economic fundamentals.
Taking this into account when planning interventions in the
foreign exchange and money markets (both through changes in discount interest
rates and open market operations) could help the NBR to avoid monetary
overhangs and exchange rate volatility, or bursts in the core inflation
rate.
· The National Bank of Rwanda should continue to promote
measures that could stabilize
excess reserves. Measures could include closing the commercial
bank accounts at the central bank later in the day and promoting the interbank
market by reducing credit risk through more transparency (for example, an
automated book-entry system).
· Based on the results of the study, it is urgent
suggested that Rwandan government could take the financial sector as a pillar
of economic growth which can replace non performing industrial sector and
agriculture. The emphasis put on it can allow Rwanda to be the net exporter of
financial services within East African Community and Commonwealth where Rwanda
was admitted recently, as we do not have any comparative advantage in remaining
sectors.
· The emphasis should be put on the level of financial
intermediation through increase in the credit allocated to private sector. It
is however important to note that the allocation of the credit should be
changed from private consumption and services to agriculture and other
investment projects like construction sector. Additionally, credit allocation
should be based on the profitability of the investment rather than personal
considerations or values.
· More so, National Bank of Rwanda should continue to
accelerate the financial innovations which are currently very low, by making
compulsory: distribution of ATM cards by banks upon bank account opening; and
the use of credit cards as a means of payment in strong legalized supermarkets
and shops, as a first step in the introduction of card-based system of
payment.
· BPR S.A has provided evidence that bank branch
proximity is a key factor in bank profitability. It is therefore, suggested
that other commercial banks in Rwanda should open at least one branch in each
district. Due to the absence of positive impact of financial innovations on
economic growth explained by inflationary pressures and exchange rate
depreciation, the national bank of Rwanda should put more efforts on price and
exchange rate stability.
· It is important for policymakers to make credible
announcements. If private agents (
consumers and
firms) believe that
policymakers are committed to lowering
inflation, they will
anticipate future prices to be lower than otherwise (how those expectations are
formed is entirely different matter; compare for instance
rational
expectations with
adaptive
expectations). If an employee expects prices to be high in the future, he
or she will draw up a wage contract with a high wage to match these prices.
Hence, the expectation of lower wages is reflected in wage-setting behavior
between employees and employers (lower wages since prices are expected to be
lower) and since wages are in fact lower there is no
demand pull
inflation because employees are receiving a smaller wage and there is
no
cost push
inflation because employers are paying out less
in wages. If an announcement about low-level inflation targets
is made but not believed by private agents, wage-setting will anticipate
high-level inflation and so wages will be higher and inflation will rise. A
high wage will increase a consumer's demand (
demand pull
inflation) and a firm's costs (
cost push
inflation), so inflation rises. Hence, if a policymaker's announcements
regarding monetary policy are not credible, policy will not have the desired
effect.
· More so, Rwandan government should accelerate financial
innovations which are currently very low, by making compulsory: distribution of
ATM cards by banks upon bank account opening; and the use of credit cards as a
means of payment in strong legalized supermarkets and shops.
BIBLIOGRAPHY
Books
1. B.M.
Friedman, 2001,
Monetary
Policy,
International
Encyclopedia of the Social & Behavioral Sciences
2. Bodie. Z, Kane A. and Marcus A. 2008, Essentials of
Investments, McGraw -Hill International ed, 7ed, New York, USA
3. Brooks, C.,2004, Introductory Econometrics for Finance,
2nd ed, The ICMA Centre, University of Reading, Cambridge University
Press
4. Frederic S.Mishkin,2004, the Economics of money, Banking,
and Financial markets,7th Edition, Columbia University
5. Greenwood, J. and Jovanovic, B. , 1990, Financial
Development and the Development of Income; Journal of
political economy, Vol. 98
6. Gujarati J.Porter, 2009, Basic Econometrics,
5th Edition
7. Gujarati, D. (1992). Essentials of econometrics. New-York:
McGraw-Hill.
8. Gujarati, D. 2004, Basic Econometrics, 4th
edition, The MacGraw-Hill companies.
9. Gurley, John, G, 1970, Money in the Theory of
Finance, the bookings institutions
10. Kocher, James E., 1973, rural development income
distribution and fertility decline, population council
11. Levine, R. and King, R.G., 1997, Financial
Entrepreneurship and Growth, Theory and Evidence, Journal of Monetary
Economics.
12. Lucas, R. E., 1988, the Mechanics of Economic
Development, Journal of monetary economics.
13. Mackinnon, 1973, Consolidated Accounts, Amsa
14. Mankiw, N. G. (2000). Macroeconomics. 4th Edition.
New-York: Worth Publisher
15. Michael P. Todaro (1982); Economics for a Developing
World
16. Michael P. Todaro,1994, Poverty Indicators,
Washington DC, U.S.A
17. Mill Hamilton, (1988), Urban Economics,
5th edition
18. Miller and Van Hoose, 1997, Essential Of Money, Banking,
And Financial Market
19. Mishkin, F. S. (1997), The economics of money, banking
and financial. 5th Edition. Massachusetts: Addison-Wesley
20. O. C. Ferrel et al, 2006, Business, 5th
Edution
21. Rose, poter s., 1993, financial institutions,
understanding and managing financial services, homeword
22. Schumpeter, J.A., 1911, The Theory of Economic
Development, An Inquiry into the Profits, Capital, Credit Interests and the
Business Cycles, Cambridge, MA: Harvard, University press.
23. Shaw, 1973, A Bibliography for the study of African
politics
24. Taylor, J. B., The monetary transmission mechanism: an
empirical framework. The Journal of Economic Perspectives, Vol 9
25. Todaro Michael p., 2000, Economics development,
Addison Wesley
Internet links
1.
http://www.bnr.rw/docs/publicnotices/instr13_2007E.pdf
2.
http://www.bnr.rw/docs/publicnotices/LOI%20SUR%20LA%20MICROFINANCE.pdf
3.
http://www.bnr.rw/docs/publicnotices/LawNo472008.pdf
4.
http://www.bnr.rw/docs/publicnotices/LAWN0072008%20.pdf
5.
http://www.bnr.rw/docs/publicnotices/Law%2055-2007.pdf
6.
http://www.bnr.rw/publicnotice.aspx?id=124
Academic course notes
1. BIRASA NYAMURINDA, 2008, Rwandan Economy, UNR
2. KABANDA Richard, 2010, Econometrics I, UNR
3. KABANDA Richard, 2011, Econometrics II, UNR
4. MUTSINZI Cyrille, 2009, Advanced Macroeconomics, UNR
5. MUTSINZI Cyrille, 2010, Scientific Research, UNR
6. RUTAZIBWA Gerard, 2010, Money and Banking, UNR
Dissertations
1. Dushimumukiza, D., 2006, Correlation entre le
Taux de Change et la Balance des Paiements, UNR
APPENDICES
1. ORGINAL DATA OF USED VARIABLE IN TAYLOR
RULE
|
years
|
GDPt
|
EXCHt
|
Mt
|
INFt
|
GDP tar
|
INF tar
|
|
1995
|
337.2
|
297.69
|
62.9
|
48.249
|
324.897
|
38.386
|
|
1996
|
431.4
|
304.16
|
75.6
|
13.434
|
411.751
|
8.736
|
|
1997
|
562.4
|
304.67
|
92.5
|
11.689
|
546.526
|
16.615
|
|
1998
|
632.1
|
330.72
|
97.8
|
6.842
|
605.629
|
-5.958
|
|
1999
|
677
|
349.53
|
104.2
|
-2.423
|
606.991
|
2.057
|
|
2000
|
732.2
|
430.49
|
119.5
|
3.901
|
676.099
|
5.832
|
|
2001
|
799.4
|
443.74
|
130.7
|
3.366
|
741.872
|
-0.219
|
|
2002
|
872.7
|
471.93
|
144.3
|
1.975
|
797.439
|
6.165
|
|
2003
|
993
|
516.07
|
167.5
|
7.445
|
992.597
|
7.677
|
|
2004
|
1,206
|
577.52
|
187.4
|
11.951
|
1,206.23
|
10.236
|
|
2005
|
1,440
|
557.81
|
218.4
|
9.122
|
1,439.83
|
5.608
|
|
2006
|
1,716
|
551.8
|
286
|
8.831
|
1,716.32
|
12.138
|
|
2007
|
2,046
|
547
|
375.1
|
9.081
|
2,049.26
|
6.579
|
|
2008
|
2,577
|
546.8
|
384.1
|
15.436
|
2,565.29
|
22.323
|
|
2009
|
2,990
|
568.27
|
402
|
10.4
|
2,964.07
|
5.737
|
|
2010
|
3,282
|
813
|
516.7
|
6.4
|
3,278.26
|
0.227
|
Source: NBR, NISR, MINECOFIN
AND
http://www.economywatch.com/economic-statistics/Rwanda/General
Government Total Expenditure Percentage GDP/
1. VALUES OF ALL USED VARIABLES IN TAYLOR RULE
|
obs
|
MT
|
M1
|
IG
|
IG1
|
YG
|
YG1
|
DEXCH
|
DEXCH1
|
|
1995
|
62.9
|
NA
|
-9.863
|
NA
|
12.303
|
NA
|
NA
|
NA
|
|
1996
|
75.6
|
62.9
|
-4.698
|
-9.863
|
19.649
|
12.303
|
6.47
|
NA
|
|
1997
|
92.5
|
75.6
|
4.926
|
-4.698
|
15.874
|
19.649
|
0.51
|
6.47
|
|
1998
|
97.8
|
92.5
|
-12.8
|
4.926
|
26.471
|
15.874
|
26.05
|
0.51
|
|
1999
|
104.2
|
97.8
|
4.48
|
-12.8
|
70.009
|
26.471
|
18.81
|
26.05
|
|
2000
|
119.5
|
104.2
|
1.931
|
4.48
|
56.101
|
70.009
|
80.96
|
18.81
|
|
2001
|
130.7
|
119.5
|
-3.585
|
1.931
|
57.528
|
56.101
|
13.25
|
80.96
|
|
2002
|
144.3
|
130.7
|
4.19
|
-3.585
|
75.261
|
57.528
|
28.19
|
13.25
|
|
2003
|
167.5
|
144.3
|
0.232
|
4.19
|
0.403
|
75.261
|
44.14
|
28.19
|
|
2004
|
187.4
|
167.5
|
-1.715
|
0.232
|
-0.23
|
0.403
|
61.45
|
44.14
|
|
2005
|
218.4
|
187.4
|
-3.514
|
-1.715
|
0.17
|
-0.23
|
-19.71
|
61.45
|
|
2006
|
286
|
218.4
|
3.307
|
-3.514
|
-0.32
|
0.17
|
-6.01
|
-19.71
|
|
2007
|
375.1
|
286
|
-2.502
|
3.307
|
-3.26
|
-0.32
|
-4.8
|
-6.01
|
|
2008
|
384.1
|
375.1
|
6.887
|
-2.502
|
11.71
|
-3.26
|
-0.2
|
-4.8
|
|
2009
|
402
|
384.1
|
-4.663
|
6.887
|
25.93
|
11.71
|
21.47
|
-0.2
|
|
2010
|
516.7
|
402
|
-6.173
|
-4.663
|
3.74
|
25.93
|
244.73
|
21.47
|
Source of basic data: NBR, NISR, MINECOFIN and are done in
E-VIEWS 3.1
Where: MT = Current money stock
M1= Previous money stock
IG= Current inflation gap
IG1= Previous inflation gap
YG= Current output gap
YG1= Previous output gap
DEXCH= Current variation of exchange
DEXCH1= Previous variation of exchange
2. AIC AND SIC FOR FINDING USED LAGS
|
|
|
|
AIC
|
|
SIC
|
|
|
CHOOSEN LAG
|
|
|
LAG
|
INT
|
INT AND TRE
|
NONE
|
INT
|
INT AND TRE
|
NONE
|
|
|
MT
|
0
|
9.641715
|
9.688929
|
9.50839
|
9.736122
|
9.830539
|
9.555593
|
LAG IS 0
|
|
|
1
|
9.866872
|
9.887956
|
9.724115
|
10.00381
|
10.07054
|
9.815408
|
|
|
|
|
|
|
|
|
|
|
|
|
|
|
|
|
|
|
|
|
|
|
M1
|
0
|
9.296327
|
9.208122
|
9.206107
|
9.387621
|
9.345063
|
9.251754
|
LAG IS 0
|
|
|
1
|
9.458962
|
9.25416
|
9.374977
|
9.589335
|
9.427991
|
9.461892
|
|
|
|
|
|
|
|
|
|
|
|
|
IG
|
0
|
6.206957
|
6.322018
|
6.14714
|
6.301364
|
6.463628
|
6.194343
|
|
|
|
1
|
6.064265
|
6.142289
|
6.01912
|
6.201206
|
6.324877
|
6.110414
|
LAG IS 1
|
|
|
|
|
|
|
|
|
|
|
|
IG1
|
0
|
6.143109
|
6.098601
|
6.039519
|
6.234403
|
6.235541
|
6.085166
|
|
|
|
1
|
6.097979
|
5.82158
|
5.845228
|
6.097979
|
5.99541
|
5.932143
|
LAG IS 1
|
|
|
|
|
|
|
|
|
|
|
|
YG
|
0
|
9.560466
|
9.683185
|
9.419062
|
9.65176
|
9.820126
|
9.464709
|
LAG IS 1
|
|
|
1
|
9.790076
|
9.907057
|
9.637297
|
9.920449
|
10.08089
|
9.724212
|
|
|
|
|
|
|
|
|
|
|
|
|
YG1
|
0
|
9.612163
|
9.763314
|
9.458669
|
9.699078
|
9.893687
|
9.502127
|
|
|
|
1
|
9.872514
|
10.02692
|
9.706344
|
9.993741
|
10.18856
|
9.787161
|
LAG IS 0
|
|
|
|
|
|
|
|
|
|
|
|
DEXCH
|
0
|
11.61242
|
11.63065
|
11.53175
|
11.69933
|
11.76102
|
11.57521
|
|
|
|
1
|
11.88346
|
11.84749
|
11.78135
|
12.00469
|
12.00912
|
11.86217
|
LAG IS 0
|
|
|
|
|
|
|
|
|
|
|
|
DEXCH1
|
0
|
9.755819
|
9.832075
|
9.856065
|
9.842734
|
9.962448
|
9.899522
|
|
|
|
1
|
9.988968
|
9.93752
|
10.04704
|
10.11019
|
10.09916
|
10.12786
|
LAG IS 0
|
|
|
|
|
|
|
|
|
|
|
|
R
|
0
|
10.02276
|
10.10345
|
9.930729
|
10.09511
|
10.21197
|
9.966901
|
|
|
|
1
|
10.31132
|
10.20734
|
10.22258
|
10.40209
|
10.32838
|
10.2831
|
LAG IS 0
|
|
|
|
|
|
|
|
|
|
|
|
R1
|
0
|
10.1346
|
10.10586
|
9.995851
|
10.19512
|
10.19663
|
10.02611
|
|
|
|
1
|
10.46616
|
9.93182
|
10.32152
|
10.53191
|
10.01948
|
10.36535
|
LAG IS 1
|
Source of basic data: NBR, NISR and MINECOFIN
2(100/n)0.25 = 1.8, this shows that we stop at lag
1.
3. ERROR CORRECTION MODEL
DMT=B0+ B1DM1 +B2DIG +B3DIG1 +B4DYG +B5DYG1 + B6DDEXCH +
B7DDEXCH1 + DR
|
Dependent Variable: MT-MT(-1)
|
|
Method: Least Squares
|
|
Date: 09/19/11 Time: 10:01
|
|
Sample(adjusted): 1998 2010
|
|
Included observations: 13 after adjusting endpoints
|
|
Variable
|
Coefficient
|
Std. Error
|
t-Statistic
|
Prob.
|
|
C
|
28.09017
|
8.530250
|
3.293007
|
0.0110
|
|
IG-IG(-1)
|
0.499831
|
0.999226
|
0.500218
|
0.6304
|
|
YG-YG(-1)
|
-0.317961
|
0.348275
|
-0.912961
|
0.3879
|
|
DEXCH-DEXCH(-1)
|
0.222279
|
0.125268
|
1.774425
|
0.1139
|
|
RESID-RESID(-1)
|
0.515337
|
0.312843
|
1.647271
|
0.1381
|
|
R-squared
|
0.527088
|
Mean dependent var
|
32.63077
|
|
Adjusted R-squared
|
0.290633
|
S.D. dependent var
|
35.03913
|
|
S.E. of regression
|
29.51134
|
Akaike info criterion
|
9.891149
|
|
Sum squared resid
|
6967.352
|
Schwarz criterion
|
10.10844
|
|
Log likelihood
|
-59.29247
|
F-statistic
|
2.229121
|
|
Durbin-Watson stat
|
1.000899
|
Prob(F-statistic)
|
0.155471
|
Source: Done in E-VIEWS 3.1
After estimating the error correction model, it is found that all
probabilities are greater than 5% this verifies that each explanatory variable
has an effect on explained variable (MT).
4. RAMSEY RESET TEST FOR MODEL SPECIFICATION
|
Ramsey RESET Test:
|
|
F-statistic
|
31.08468
|
Probability
|
0.061410
|
|
Log likelihood ratio
|
58.04147
|
Probability
|
0.072100
|
|
|
|
|
|
|
Test Equation:
|
|
Dependent Variable: MT
|
|
Method: Least Squares
|
|
Date: 09/19/11 Time: 09:53
|
|
Sample: 1997 2010
|
|
Included observations: 14
|
|
Variable
|
Coefficient
|
Std. Error
|
t-Statistic
|
Prob.
|
|
C
|
4.001070
|
197.2238
|
0.020287
|
0.9857
|
|
MT(-1)
|
4.339922
|
7.446307
|
0.582829
|
0.6190
|
|
IG
|
-5.797933
|
12.89962
|
-0.449465
|
0.6971
|
|
IG(-1)
|
-8.277322
|
19.41283
|
-0.426384
|
0.7113
|
|
YG
|
-1.842925
|
4.348232
|
-0.423833
|
0.7129
|
|
YG(-1)
|
1.287048
|
2.608869
|
0.493336
|
0.6706
|
|
DEXCH
|
0.255345
|
0.632645
|
0.403615
|
0.7256
|
|
DEXCH(-1)
|
-0.784084
|
1.650993
|
-0.474917
|
0.6817
|
|
FITTED^2
|
-0.046524
|
0.054793
|
-0.849073
|
0.4853
|
|
FITTED^3
|
0.000276
|
0.000205
|
1.347810
|
0.3101
|
|
FITTED^4
|
-6.66E-07
|
3.58E-07
|
-1.858988
|
0.2041
|
|
FITTED^5
|
5.56E-10
|
2.38E-10
|
2.338133
|
0.1443
|
|
R-squared
|
0.999651
|
Mean dependent var
|
230.4429
|
|
Adjusted R-squared
|
0.997732
|
S.D. dependent var
|
137.8947
|
|
S.E. of regression
|
6.567172
|
Akaike info criterion
|
6.370419
|
|
Sum squared resid
|
86.25550
|
Schwarz criterion
|
6.918183
|
|
Log likelihood
|
-32.59293
|
F-statistic
|
520.8801
|
|
Durbin-Watson stat
|
2.655976
|
Prob(F-statistic)
|
0.001918
|
Source: Done in E-VIEWS 3.1
Ramsey RESET Test, as all probabilities are greater than 5%, this
shows that the model is well specified.
5. AUTOCORRELATION TEST OF DARBIN WATSON (DW)
DW TABLE
0
4
2
(1.177) (1.732)
(2.268) (2.823)
dL du
4-du 4-dL
Source: statistical tables
DW =2.461915 =where the DW is placed on table.
DW is in the indecision zone near no autocorrelation zone, so DW
is associated in the zone of no autocorrelation.
6. TEST FOR COINTEGRATION
In econometric literature, it is not clear whether
cointegration should be applied to only series integrated of the same order.
Though Verbeck (2004) noted that the concept of cointegration can be applied to
(nonstationary) integrated time series only and Dickey et al, quoted by
Gujarati (2004), stipulated that Cointegration deals with the relationship
among a group of variables, where (unconditionally) each has a unit root,
however Brooks (2004) stressed that it is also possible to combine levels and
first differenced terms in a VECM. The later therefore illustrates that
cointegration can exist among variables not integrated of the same order.
Heij et al (2004) stated by gujarati (2009) developed the
mathematical proof of this view where they asserted that a cointegration
relationship exists between stationary and nonstationary variables. If their
mathematical proof is put in simple terms, there are three possibilities in VAR
with many variables: If m: the number of variables, r = rank of the matrix of
coefficients and also the number of cointegration relations, therefore:
· If all variables are stationary, r = m and all roots
lie outside the unit cycle
· If all variables are not stationary, r = 0, there are m
unit roots or m stochastic trends.
· If some variables are stationary and others not
stationary, r = 0< r < m, there are m-r unit roots, the polynomial have
m-r common stochastic trends and there are r cointegrating relations.
As all variables are stationary, Johansen cointegration test
has been used to determine whether there exist a long-run relationship between
these variables. This test was preferred to Engle-Granger approach because in
case of six variables we may have more than one cointegrating relationship
(Brooks, 2004).

| 

