3.7. Data Processing and
Analysis
Data processing is broadly, the collection and manipulation of
items of data to produce meaningful information. In this sense it can be
considered a subset of processing, the change of information in any manner
detectable by an observer. It is important to show the various tools at which
the data were obtained from the field.
Data analysis is the process of systematically applying
statistical and or logical techniques to describe and illustrate, condense and
recap, and evaluate data. According to Shamoo and Resnik (2003) various
analytic procedures provide a way of drawing inductive inferences from data and
distinguishing the signal(the phenomenon of interest) from the noise
(statistical fluctuations) present in the data.
3.7.1. Coding
Coding will be used to summarize data by classifying different
responses in categories that are easily understandable.
3.7.2. Editing
Editing refers to a process whereby errors are eliminated
whenever identified in interview schedules and the questionnaires. The
researcher followed this procedure in order to minimize errors and mistakes.
Unnecessary phrases, words and repetitions, and other sorts of such kind will
be minimized to facilitate accuracy, uniformity legibility and consistency of
data to the best of the researcher.
3.7.3. Tabulation
The tabulation process will involve determination of the
frequency of the responses for every variable and fixing data into statistical
tables. Kakinda (1990) says that after data is edited and coding frame
established, and data coded, it is often tabulated and may undergo other
statistical manipulation.
3.8 Methods of data
analysis
The researcher used two types of methodologies, namely:
descriptive statistics (frequency statistics and bivariate analysis) and
multivariate analysis using multinomial logistic regression which was used to
identify the direction of effect for each independent variable adjusting for
the others on the level of dropout existing in schools within whhich this
research was conducted.
3.8.1 Descriptive
statistics
The descriptive statistics of variables is important for
summarizing the characteristics of the sample. Bivariate analysis using
chi-square test was used to identify if there is a relationship between the
dependent variable and each independent variable.
The chi-square formula is 
Where O is the observed frequency in each category of
independent variable
E is the expected frequency in the corresponding category of
independent variable
 : is the chi-square value : is the chi-square value
3.8.2 Multivariable
analysis
Multivariable logistic regression analysis extends the
techniques of multiple regression analysis to research situations in which the
outcome variable is categorical (Dayton 1992). Generally, logistic regression
is well suited for describing and testing hypotheses about relationships
between a categorical outcome variable and more categorical predictor
variables. Multinomial logistic regression was typically used in this study
because the dependent variable has more than two categories (Bender and Grouven
1997)
3.8.3 Multivariable logistic regression
model
The conditional likelihood by a set of parameters ( ) given data (x and ) given data (x and  ) is ) is 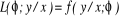 . Intuitively, . Intuitively,  follows a probability distribution that is different for x, but x
itself is never unknown, so there is no need to have a probabilistic model of
it. For each x there is different distribution of follows a probability distribution that is different for x, but x
itself is never unknown, so there is no need to have a probabilistic model of
it. For each x there is different distribution of , but all these distributions share the same parameters ( , but all these distributions share the same parameters ( ). Given data consisting of ( ). Given data consisting of ( ) pairs, the principle of maximum conditional likelihood says to choose
a parameter estimate ) pairs, the principle of maximum conditional likelihood says to choose
a parameter estimate  that maximizes the product that maximizes the product . Note that we do not need to assume that . Note that we do not need to assume that  are independent in order to justify the conditional likelihood being a
product; we just need to assume that are independent in order to justify the conditional likelihood being a
product; we just need to assume that  are dependent when each is conditioned on its own are dependent when each is conditioned on its own . For any specific value of x, . For any specific value of x,  can then be used to predict values for y; we assume that we never want
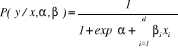
to predict values of x. Suppose that y is a multinomial outcome and that x is a
real-valued vector. We can assume that the distribution of y is a fixed
nonlinear function of a linear function of x. Specifically. We assume the
conditional model: can then be used to predict values for y; we assume that we never want
to predict values of x. Suppose that y is a multinomial outcome and that x is a
real-valued vector. We can assume that the distribution of y is a fixed
nonlinear function of a linear function of x. Specifically. We assume the
conditional model:
Responses ( 's) are categorical variables with more than two categories (coded 1 for
high level, code 2 for middle level, coded 3 for low level of dropout).
Predictor values ( 's) are categorical variables with more than two categories (coded 1 for
high level, code 2 for middle level, coded 3 for low level of dropout).
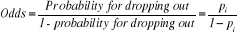
Predictor values ( 's) can be categorical. We are interested in modeling 's) can be categorical. We are interested in modeling  in terms of in terms of : :   is a multinomial random variable, whose proportion parameter is a multinomial random variable, whose proportion parameter depends on predictors' variable depends on predictors' variable . The ratio . The ratio  is called the odds of the event y given and is called the odds of the event y given and  is called the log of odds. Since probabilities ranged between 0 and 1,
odds range between 0 and 1, odds range between 0 and is called the log of odds. Since probabilities ranged between 0 and 1,
odds range between 0 and 1, odds range between 0 and  , log odds range unboundedly between , log odds range unboundedly between  . A linear expression of the form . A linear expression of the form  can also take unbounded values, so it is reasonable to use a linear
expression as a model for log odds, but not as a model for odds for odds or for
probabilities. Essentially, logistic regression is the simplest reasonable
model for a categorical outcome that depends linearly on predictors can also take unbounded values, so it is reasonable to use a linear
expression as a model for log odds, but not as a model for odds for odds or for
probabilities. Essentially, logistic regression is the simplest reasonable
model for a categorical outcome that depends linearly on predictors . For each feature i, . For each feature i,  is a multiplicative scaling factor on the odds is a multiplicative scaling factor on the odds . If the predictor . If the predictor  is real-valued, then is real-valued, then  is the extra odds of having the outcome y=1 when the value of is the extra odds of having the outcome y=1 when the value of  increased by one unit. increased by one unit.
In fact, the ratio is the probability of occurrence of an
event to the probability of its not occurrence. If there is a probability  for the level of dropout, then the odds can be considered the ratio of
the probability for the level of dropout over the probability for no
dropout. for the level of dropout, then the odds can be considered the ratio of
the probability for the level of dropout over the probability for no
dropout.
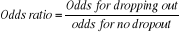
An odds ratio (OR) is a measure of association between an
exposure and an outcome. The OR represents the odds that an outcome will occur
given a particular exposure, compared to the odds of the outcome occurring in
the absence of that exposure.
Multinomial logistic regression models make it possible to
estimate the probability for dropout level on the combination of independent
variables included in the model.
The model in terms of probability of outcome occurring is:
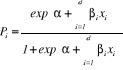
 = Odds ratio for a person having characteristics i versus not having
it = Odds ratio for a person having characteristics i versus not having
it
 =Regression coefficients =Regression coefficients  =constant =constant  = ith variable Where; i=1, 2, ...., k = ith variable Where; i=1, 2, ...., k
 = probability of outcome occurring = probability of outcome occurring
| 

