LISTE DES ANNEXES
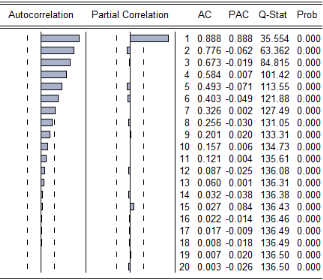
Annexe 1 :
Corrélogramme de la série L_PIBA
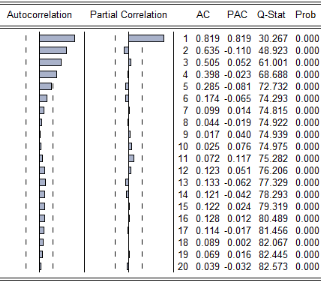
Annexe 2 :
Corrélogramme de la série L_PIBH
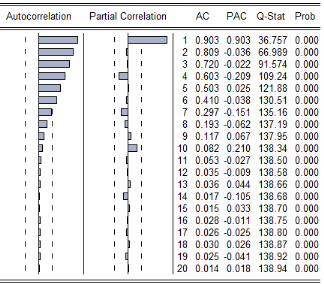
Annexe 3 :
Corrélogramme de la série L_PIBI
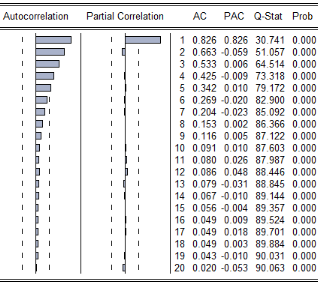
Annexe 4 :
Corrélogramme de la série L_PIBI
Annexe 5 : Test de
stationnarité sur L_PIBA
|
Null Hypothesis: L_PIBA has a unit root
|
|
|
Exogenous: Constant, Linear Trend
|
|
|
Lag Length: 0 (Automatic based on SIC, MAXLAG=9)
|
|
|
|
|
|
|
|
|
|
|
|
|
|
t-Statistic
|
Prob.*
|
|
|
|
|
|
|
|
|
|
|
|
Augmented Dickey-Fuller test statistic
|
-3.162448
|
0.1062
|
|
Test critical values:
|
1% level
|
|
-4.198503
|
|
|
5% level
|
|
-3.523623
|
|
|
10% level
|
|
-3.192902
|
|
|
|
|
|
|
|
|
|
|
|
|
*MacKinnon (1996) one-sided p-values.
|
|
|
Augmented Dickey-Fuller Test Equation
|
|
|
Dependent Variable: D(L_PIBA)
|
|
|
Method: Least Squares
|
|
|
|
Date: 02/20/13 Time: 12:10
|
|
|
|
Sample (adjusted): 1971 2011
|
|
|
|
Included observations: 41 after adjustments
|
|
|
|
|
|
|
|
|
|
|
|
|
Variable
|
Coefficient
|
Std. Error
|
t-Statistic
|
Prob.
|
|
|
|
|
|
|
|
|
|
|
|
L_PIBA (-1)
|
-0.317483
|
0.100391
|
-3.162448
|
0.0031
|
|
C
|
7.985487
|
2.517238
|
3.172321
|
0.0030
|
|
@TREND(1970)
|
0.014248
|
0.004397
|
3.240189
|
0.0025
|
|
|
|
|
|
|
|
|
|
|
|
R-squared
|
0.217180
|
Mean dependent var
|
0.036148
|
|
Adjusted R-squared
|
0.175979
|
S.D. dependent var
|
0.059995
|
|
S.E. of regression
|
0.054461
|
Akaike info criterion
|
-2.912319
|
|
Sum squared resid
|
0.112707
|
Schwarz criterion
|
-2.786936
|
|
Log likelihood
|
62.70254
|
F-statistic
|
5.271236
|
|
Durbin-Watson stat
|
2.042756
|
Prob(F-statistic)
|
0.009541
|
|
|
|
|
|
|
|
|
|
|
Annexe 6 : Test de
stationnarité sur D(L_PIBA)
|
Null Hypothesis: D(L_PIBA) has a unit root
|
|
|
Exogenous: Constant
|
|
|
|
Lag Length: 0 (Automatic based on SIC, MAXLAG=9)
|
|
|
|
|
|
|
|
|
|
|
|
|
|
t-Statistic
|
Prob.*
|
|
|
|
|
|
|
|
|
|
|
|
Augmented Dickey-Fuller test statistic
|
-7.130728
|
0.0000
|
|
Test critical values:
|
1% level
|
|
-3.605593
|
|
|
5% level
|
|
-2.936942
|
|
|
10% level
|
|
-2.606857
|
|
|
|
|
|
|
|
|
|
|
|
|
*MacKinnon (1996) one-sided p-values.
|
|
|
|
|
|
|
|
|
|
|
|
|
Augmented Dickey-Fuller Test Equation
|
|
|
Dependent Variable: D(L_PIBA,2)
|
|
|
Method: Least Squares
|
|
|
|
Date: 02/20/13 Time: 12:13
|
|
|
|
Sample (adjusted): 1972 2011
|
|
|
|
Included observations: 40 after adjustments
|
|
|
|
|
|
|
|
|
|
|
|
|
Variable
|
Coefficient
|
Std. Error
|
t-Statistic
|
Prob.
|
|
|
|
|
|
|
|
|
|
|
|
D(L_PIBA(-1))
|
-1.127788
|
0.158159
|
-7.130728
|
0.0000
|
|
C
|
0.042689
|
0.011113
|
3.841436
|
0.0005
|
|
|
|
|
|
|
|
|
|
|
|
R-squared
|
0.572300
|
Mean dependent var
|
0.001149
|
|
Adjusted R-squared
|
0.561045
|
S.D. dependent var
|
0.090337
|
|
S.E. of regression
|
0.059852
|
Akaike info criterion
|
-2.745189
|
|
Sum squared resid
|
0.136124
|
Schwarz criterion
|
-2.660745
|
|
Log likelihood
|
56.90378
|
F-statistic
|
50.84729
|
|
Durbin-Watson stat
|
2.053975
|
Prob(F-statistic)
|
0.000000
|
|
|
|
|
|
|
|
|
|
|
Annexe 7 : Test de
stationnarité sur L_PIBH
|
Null Hypothesis: L_PIBH has a unit root
|
|
|
Exogenous: Constant, Linear Trend
|
|
|
Lag Length: 0 (Automatic based on SIC, MAXLAG=9)
|
|
|
|
|
|
|
|
|
|
|
|
|
|
t-Statistic
|
Prob.*
|
|
|
|
|
|
|
|
|
|
|
|
Augmented Dickey-Fuller test statistic
|
-2.251733
|
0.4496
|
|
Test critical values:
|
1% level
|
|
-4.198503
|
|
|
5% level
|
|
-3.523623
|
|
|
10% level
|
|
-3.192902
|
|
|
|
|
|
|
|
|
|
|
|
|
*MacKinnon (1996) one-sided p-values.
|
|
|
Augmented Dickey-Fuller Test Equation
|
|
|
Dependent Variable: D(L_PIBH)
|
|
|
Method: Least Squares
|
|
|
|
Date: 02/20/13 Time: 12:20
|
|
|
|
Sample (adjusted): 1971 2011
|
|
|
|
Included observations: 41 after adjustments
|
|
|
|
|
|
|
|
|
|
|
|
|
Variable
|
Coefficient
|
Std. Error
|
t-Statistic
|
Prob.
|
|
|
|
|
|
|
|
|
|
|
|
L_PIBH(-1)
|
-0.225485
|
0.100138
|
-2.251733
|
0.0302
|
|
C
|
1.266563
|
0.562712
|
2.250818
|
0.0303
|
|
@TREND(1970)
|
0.001868
|
0.000779
|
2.399343
|
0.0214
|
|
|
|
|
|
|
|
|
|
|
|
R-squared
|
0.133422
|
Mean dependent var
|
0.006582
|
|
Adjusted R-squared
|
0.087813
|
S.D. dependent var
|
0.029653
|
|
S.E. of regression
|
0.028321
|
Akaike info criterion
|
-4.220052
|
|
Sum squared resid
|
0.030480
|
Schwarz criterion
|
-4.094668
|
|
Log likelihood
|
89.51106
|
F-statistic
|
2.925332
|
|
Durbin-Watson stat
|
1.646501
|
Prob(F-statistic)
|
0.065817
|
|
|
|
|
|
|
|
|
|
|
Annexe 8 : Test de
stationnarité sur D(L_PIBH)
|
Null Hypothesis: D(L_PIBH) has a unit root
|
|
|
Exogenous: None
|
|
|
|
Lag Length: 0 (Automatic based on SIC, MAXLAG=9)
|
|
|
|
|
|
|
|
|
|
|
|
|
|
t-Statistic
|
Prob.*
|
|
|
|
|
|
|
|
|
|
|
|
Augmented Dickey-Fuller test statistic
|
-5.575145
|
0.0000
|
|
Test critical values:
|
1% level
|
|
-2.624057
|
|
|
5% level
|
|
-1.949319
|
|
|
10% level
|
|
-1.611711
|
|
|
|
|
|
|
|
|
|
|
|
|
*MacKinnon (1996) one-sided p-values.
|
|
|
|
|
|
|
|
Augmented Dickey-Fuller Test Equation
|
|
|
Dependent Variable: D (L_PIBH,2)
|
|
|
Method: Least Squares
|
|
|
|
Date: 02/20/13 Time: 12:22
|
|
|
|
Sample (adjusted): 1972 2011
|
|
|
|
Included observations: 40 after adjustments
|
|
|
|
|
|
|
|
|
|
|
|
|
Variable
|
Coefficient
|
Std. Error
|
t-Statistic
|
Prob.
|
|
|
|
|
|
|
|
|
|
|
|
D(L_PIBH(-1))
|
-0.872126
|
0.156431
|
-5.575145
|
0.0000
|
|
|
|
|
|
|
|
|
|
|
|
R-squared
|
0.442968
|
Mean dependent var
|
0.001239
|
|
Adjusted R-squared
|
0.442968
|
S.D. dependent var
|
0.040183
|
|
S.E. of regression
|
0.029990
|
Akaike info criterion
|
-4.151208
|
|
Sum squared resid
|
0.035077
|
Schwarz criterion
|
-4.108986
|
|
Log likelihood
|
84.02416
|
Durbin-Watson stat
|
1.796316
|
|
|
|
|
|
|
|
|
|
|
Annexe 9 : Test de
stationnarité sur L_PIBI
|
Null Hypothesis: L_PIBI has a unit root
|
|
|
Exogenous: Constant
|
|
|
|
Lag Length: 0 (Automatic based on SIC, MAXLAG=9)
|
|
|
|
|
|
|
|
|
|
|
|
|
|
t-Statistic
|
Prob.*
|
|
|
|
|
|
|
|
|
|
|
|
Augmented Dickey-Fuller test statistic
|
-2.184504
|
0.2148
|
|
Test critical values:
|
1% level
|
|
-3.600987
|
|
|
5% level
|
|
-2.935001
|
|
|
10% level
|
|
-2.605836
|
|
|
|
|
|
|
|
|
|
|
|
|
*MacKinnon (1996) one-sided p-values.
|
|
|
|
|
|
|
|
Augmented Dickey-Fuller Test Equation
|
|
|
Dependent Variable: D(L_PIBI)
|
|
|
Method: Least Squares
|
|
|
|
Date: 02/20/13 Time: 12:23
|
|
|
|
Sample (adjusted): 1971 2011
|
|
|
|
Included observations: 41 after adjustments
|
|
|
|
|
|
|
|
|
|
|
|
|
Variable
|
Coefficient
|
Std. Error
|
t-Statistic
|
Prob.
|
|
|
|
|
|
|
|
|
|
|
|
L_PIBI(-1)
|
-0.061884
|
0.028329
|
-2.184504
|
0.0350
|
|
C
|
1.617128
|
0.709830
|
2.278190
|
0.0283
|
|
|
|
|
|
|
|
|
|
|
|
R-squared
|
0.109021
|
Mean dependent var
|
0.067603
|
|
Adjusted R-squared
|
0.086175
|
S.D. dependent var
|
0.179218
|
|
S.E. of regression
|
0.171322
|
Akaike info criterion
|
-0.642991
|
|
Sum squared resid
|
1.144701
|
Schwarz criterion
|
-0.559402
|
|
Log likelihood
|
15.18131
|
F-statistic
|
4.772059
|
|
Durbin-Watson stat
|
1.879444
|
Prob(F-statistic)
|
0.035001
|
|
|
|
|
|
|
|
|
|
|
Annexe 10 : Test de
stationnarité sur D(L_PIBI)
|
Null Hypothesis: D(L_PIBI) has a unit root
|
|
|
Exogenous: None
|
|
|
|
Lag Length: 0 (Automatic based on SIC, MAXLAG=9)
|
|
|
|
|
|
|
|
|
|
|
|
|
|
t-Statistic
|
Prob.*
|
|
|
|
|
|
|
|
|
|
|
|
Augmented Dickey-Fuller test statistic
|
-5.050001
|
0.0000
|
|
Test critical values:
|
1% level
|
|
-2.624057
|
|
|
5% level
|
|
-1.949319
|
|
|
10% level
|
|
-1.611711
|
|
|
|
|
|
|
|
|
|
|
|
|
*MacKinnon (1996) one-sided p-values.
|
|
|
|
|
|
|
|
Augmented Dickey-Fuller Test Equation
|
|
|
Dependent Variable: D (L_PIBI,2)
|
|
|
Method: Least Squares
|
|
|
|
Date: 02/20/13 Time: 12:25
|
|
|
|
Sample (adjusted): 1972 2011
|
|
|
|
Included observations: 40 after adjustments
|
|
|
|
|
|
|
|
|
|
|
|
|
Variable
|
Coefficient
|
Std. Error
|
t-Statistic
|
Prob.
|
|
|
|
|
|
|
|
|
|
|
|
D(L_PIBI(-1))
|
-0.784466
|
0.155340
|
-5.050001
|
0.0000
|
|
|
|
|
|
|
|
|
|
|
|
R-squared
|
0.395307
|
Mean dependent var
|
-0.002482
|
|
Adjusted R-squared
|
0.395307
|
S.D. dependent var
|
0.242227
|
|
S.E. of regression
|
0.188360
|
Akaike info criterion
|
-0.476236
|
|
Sum squared resid
|
1.383707
|
Schwarz criterion
|
-0.434014
|
|
Log likelihood
|
10.52473
|
Durbin-Watson stat
|
2.059069
|
|
|
|
|
|
|
|
|
|
|
Annexe 11 : Test de
stationnarité sur L_PIBS
|
Null Hypothesis: L_PIBS has a unit root
|
|
|
Exogenous: None
|
|
|
|
Lag Length: 0 (Automatic based on SIC, MAXLAG=9)
|
|
|
|
|
|
|
|
|
|
|
|
|
|
t-Statistic
|
Prob.*
|
|
|
|
|
|
|
|
|
|
|
|
Augmented Dickey-Fuller test statistic
|
3.879710
|
0.9999
|
|
Test critical values:
|
1% level
|
|
-2.622585
|
|
|
5% level
|
|
-1.949097
|
|
|
10% level
|
|
-1.611824
|
|
|
|
|
|
|
|
|
|
|
|
|
*MacKinnon (1996) one-sided p-values.
|
|
|
|
|
|
|
|
|
|
|
|
|
Augmented Dickey-Fuller Test Equation
|
|
|
Dependent Variable: D(L_PIBS)
|
|
|
Method: Least Squares
|
|
|
|
Date: 02/20/13 Time: 12:27
|
|
|
|
Sample (adjusted): 1971 2011
|
|
|
|
Included observations: 41 after adjustments
|
|
|
|
|
|
|
|
|
|
|
|
|
Variable
|
Coefficient
|
Std. Error
|
t-Statistic
|
Prob.
|
|
|
|
|
|
|
|
|
|
|
|
L_PIBS (-1)
|
0.001146
|
0.000296
|
3.879710
|
0.0004
|
|
|
|
|
|
|
|
|
|
|
|
R-squared
|
0.000224
|
Mean dependent var
|
0.030134
|
|
Adjusted R-squared
|
0.000224
|
S.D. dependent var
|
0.049754
|
|
S.E. of regression
|
0.049748
|
Akaike info criterion
|
-3.139586
|
|
Sum squared resid
|
0.098996
|
Schwarz criterion
|
-3.097791
|
|
Log likelihood
|
65.36151
|
Durbin-Watson stat
|
1.919032
|
|
|
|
|
|
|
|
|
|
|
Annexe 12 : Test de
stationnarité sur D(L_PIBS)
|
Null Hypothesis: D(L_PIBS) has a unit root
|
|
|
Exogenous: Constant
|
|
|
|
Lag Length: 0 (Automatic based on SIC, MAXLAG=9)
|
|
|
|
|
|
|
|
|
|
|
|
|
|
t-Statistic
|
Prob.*
|
|
|
|
|
|
|
|
|
|
|
|
Augmented Dickey-Fuller test statistic
|
-5.928194
|
0.0000
|
|
Test critical values:
|
1% level
|
|
-3.605593
|
|
|
5% level
|
|
-2.936942
|
|
|
10% level
|
|
-2.606857
|
|
|
|
|
|
|
|
|
|
|
|
|
*MacKinnon (1996) one-sided p-values.
|
|
|
|
|
|
|
|
|
|
|
|
|
Augmented Dickey-Fuller Test Equation
|
|
|
Dependent Variable: D (L_PIBS,2)
|
|
|
Method: Least Squares
|
|
|
|
Date: 02/20/13 Time: 12:35
|
|
|
|
Sample (adjusted): 1972 2011
|
|
|
|
Included observations: 40 after adjustments
|
|
|
|
|
|
|
|
|
|
|
|
|
Variable
|
Coefficient
|
Std. Error
|
t-Statistic
|
Prob.
|
|
|
|
|
|
|
|
|
|
|
|
D(L_PIBS(-1))
|
-0.959630
|
0.161876
|
-5.928194
|
0.0000
|
|
C
|
0.029323
|
0.009423
|
3.111750
|
0.0035
|
|
|
|
|
|
|
|
|
|
|
|
R-squared
|
0.480473
|
Mean dependent var
|
0.000318
|
|
Adjusted R-squared
|
0.466801
|
S.D. dependent var
|
0.069753
|
|
S.E. of regression
|
0.050934
|
Akaike info criterion
|
-3.067855
|
|
Sum squared resid
|
0.098583
|
Schwarz criterion
|
-2.983411
|
|
Log likelihood
|
63.35709
|
F-statistic
|
35.14349
|
|
Durbin-Watson stat
|
1.966510
|
Prob(F-statistic)
|
0.000001
|
|
|
|
|
|
|
|
|
|
|
Annexe 13 :
Test de la valeur propre maximale
|
|
|
|
|
|
|
|
|
|
|
Hypothesized
|
|
Max-Eigen
|
0.05
|
|
|
No. of CE(s)
|
Eigenvalue
|
Statistic
|
Critical Value
|
Prob**
|
|
|
|
|
|
|
|
|
|
|
|
None
|
0.252039
|
11.61618
|
27.58434
|
0.9470
|
|
At most 1
|
0.194771
|
8.665121
|
21.13162
|
0.8585
|
|
At most 2
|
0.171309
|
7.516315
|
14.26460
|
0.4300
|
|
At most 3
|
0.038144
|
1.555614
|
3.841466
|
0.2123
|
|
|
|
|
|
Annexe 14 :
Modèle VAR avec DPIBI et sans constante
|
DL_PIBH
|
DL_PIBA
|
DL_PIBI
|
DL_PIBS
|
|
DL_PIBH(-1)
|
-0.214843
|
-1.416178
|
-0.815325
|
-0.589554
|
|
(0.22903)
|
(0.51143)
|
(1.52541)
|
(0.39238)
|
|
(-0.93807)
|
(-2.76907)
|
(-0.53450)
|
(-1.50252)
|
|
|
|
|
|
|
DL_PIBA(-1)
|
0.182883
|
0.352387
|
0.675885
|
0.480593
|
|
(0.07000)
|
(0.15632)
|
(0.46625)
|
(0.11993)
|
|
(2.61247)
|
(2.25424)
|
(1.44961)
|
(4.00717)
|
|
|
|
|
|
|
DL_PIBI(-1)
|
-0.002745
|
0.088369
|
0.189140
|
-0.003278
|
|
(0.02422)
|
(0.05408)
|
(0.16131)
|
(0.04149)
|
|
(-0.11334)
|
(1.63396)
|
(1.17253)
|
(-0.07899)
|
|
|
|
|
|
|
DL_PIBS(-1)
|
0.162300
|
0.639407
|
0.633147
|
0.508891
|
|
(0.11378)
|
(0.25408)
|
(0.75784)
|
(0.19494)
|
|
(1.42641)
|
(2.51654)
|
(0.83546)
|
(2.61054)
|
|
R-squared
|
0.126203
|
-0.049296
|
-0.010484
|
0.133920
|
|
Adj. R-squared
|
0.053387
|
-0.136738
|
-0.094691
|
0.061747
|
|
Sum sq. resids
|
0.029136
|
0.145289
|
1.292520
|
0.085521
|
|
S.E. equation
|
0.028449
|
0.063528
|
0.189482
|
0.048740
|
|
F-statistic
|
1.733169
|
-0.563765
|
-0.124499
|
1.855531
|
|
Log likelihood
|
87.73541
|
55.60071
|
11.88817
|
66.19994
|
|
Akaike AIC
|
-4.186770
|
-2.580035
|
-0.394408
|
-3.109997
|
|
Schwarz SC
|
-4.017882
|
-2.411147
|
-0.225520
|
-2.941109
|
|
Mean dependent
|
0.007638
|
0.037982
|
0.065746
|
0.030543
|
|
S.D. dependent
|
0.029240
|
0.059585
|
0.181101
|
0.050318
|
|
Determinant Residual Covariance
|
6.81E-11
|
|
|
|
Log Likelihood
|
241.1638
|
|
|
|
Akaike Information Criteria
|
-11.25819
|
|
|
|
Schwarz Criteria
|
-10.58264
|
|
|
Annexe 15:
Modèle VAR avec constante et sans DPIBI
|
DL_PIBH
|
DL_PIBA
|
DL_PIBS
|
|
DL_PIBH(-1)
|
-0.458574
|
-0.119821
|
-0.470931
|
|
(0.30520)
|
(0.65405)
|
(0.53175)
|
|
(-1.50255)
|
(-0.18320)
|
(-0.88563)
|
|
|
|
|
|
DL_PIBA(-1)
|
0.287912
|
-0.177607
|
0.427684
|
|
(0.11345)
|
(0.24311)
|
(0.19766)
|
|
(2.53790)
|
(-0.73055)
|
(2.16378)
|
|
|
|
|
|
DL_PIBS(-1)
|
0.338551
|
-0.219547
|
0.418201
|
|
(0.18869)
|
(0.40437)
|
(0.32875)
|
|
(1.79422)
|
(-0.54294)
|
(1.27208)
|
|
|
|
|
|
C
|
-0.010265
|
0.051926
|
0.005163
|
|
(0.00882)
|
(0.01889)
|
(0.01536)
|
|
(-1.16426)
|
(2.74820)
|
(0.33610)
|
|
R-squared
|
0.157610
|
0.068342
|
0.136479
|
|
Adj. R-squared
|
0.087410
|
-0.009296
|
0.064519
|
|
Sum sq. resids
|
0.028089
|
0.129000
|
0.085268
|
|
S.E. equation
|
0.027933
|
0.059861
|
0.048668
|
|
F-statistic
|
2.245177
|
0.880267
|
1.896600
|
|
Log likelihood
|
88.46749
|
57.97890
|
66.25914
|
|
Akaike AIC
|
-4.223375
|
-2.698945
|
-3.112957
|
|
Schwarz SC
|
-4.054487
|
-2.530057
|
-2.944069
|
|
Mean dependent
|
0.007638
|
0.037982
|
0.030543
|
|
S.D. dependent
|
0.029240
|
0.059585
|
0.050318
|
|
Determinant Residual Covariance
|
1.12E-09
|
|
|
Log Likelihood
|
241.8794
|
|
|
Akaike Information Criteria
|
-11.49397
|
|
|
Schwarz Criteria
|
-10.98730
|
|
Annexe 16 :
Modèle VAR sans DPIBI et sans constante
|
DL_PIBH
|
DL_PIBA
|
DL_PIBS
|
|
DL_PIBH(-1)
|
-0.217181
|
-1.340915
|
-0.592346
|
|
(0.22503)
|
(0.52072)
|
(0.38550)
|
|
(-0.96511)
|
(-2.57514)
|
(-1.53657)
|
|
|
|
|
|
DL_PIBA(-1)
|
0.182835
|
0.353930
|
0.480536
|
|
(0.06906)
|
(0.15981)
|
(0.11831)
|
|
(2.64738)
|
(2.21473)
|
(4.06168)
|
|
|
|
|
|
DL_PIBS(-1)
|
0.161098
|
0.678105
|
0.507456
|
|
(0.11177)
|
(0.25862)
|
(0.19146)
|
|
(1.44139)
|
(2.62200)
|
(2.65040)
|
|
R-squared
|
0.125891
|
-0.127114
|
0.133770
|
|
Adj. R-squared
|
0.078642
|
-0.188039
|
0.086946
|
|
Sum sq. resids
|
0.029147
|
0.156063
|
0.085536
|
|
S.E. equation
|
0.028067
|
0.064946
|
0.048081
|
|
F-statistic
|
2.664417
|
-2.086399
|
2.856908
|
|
Log likelihood
|
87.72827
|
54.16990
|
66.19648
|
|
Akaike AIC
|
-4.236414
|
-2.558495
|
-3.159824
|
|
Schwarz SC
|
-4.109748
|
-2.431829
|
-3.033158
|
|
Mean dependent
|
0.007638
|
0.037982
|
0.030543
|
|
S.D. dependent
|
0.029240
|
0.059585
|
0.050318
|
|
Determinant Residual Covariance
|
2.50E-09
|
|
|
Log Likelihood
|
225.9062
|
|
|
Akaike Information Criteria
|
-10.84531
|
|
|
Schwarz Criteria
|
-10.46531
|
|
| 
