CHAPTER IV: PRESENTATION AND DISCUSSION OF RESULTS
This chapter presents and discusses results of the research
based on the primary and secondary data collected. The results presented in
this chapter have been arranged in sections which include finding on trend in
rainfall and river discharge of the study area, determinants of vulnerability
and Flood Vulnerability index and mapping of vulnerable areas results.
4.1. Empirical Finding on Trend and Variability Analysis
4.1.1. Precipitation Time Series Analysis
Statistical properties of the annual and monthly rainfall series
were tested and presented in "Annexe 1". The result shows that April, May, June
and October represent the smallest Coefficient of Variation (CV): 0.486, 0.388,
0.353, and 0.439, respectively which means that they were the homogenous months
in terms of rainfall variations during the period of record. On the other hand,
December, January and February show the largest CV with 2.122, 1.586 and 1.06,
respectively. The rest of the months present similar rainfall pattern
representing similar variation during the study period. The annual maximum
rainfall occurred in the year 1999 with the total precipitation of around
1341.5 mm approximately and the minimum rainfall occurred in the year 1977 with
the total of around 674 mm.
On running the Mann-Kendall test on precipitation data, the
Sen's slope shows an evidence of a positive trend in annual series. The rate of
annual rainfall change is about 3.434 mm/year. The result indicates that the
null hypothesis was accepted for the annual rainfall trend (p-value= 0.159).
Thus, statistically significant positive trend is not found for annual rainfall
over the time period.
On plotting the linear trend line for the 40 years rainfall
data, the following results in "Figure 7" were obtained.
Annual rainfall-plot
y = 3.434x + 943.6
R² = 0.053
Rainfall (mm)
Linear fit
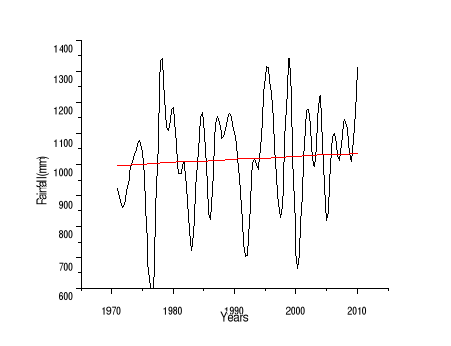
Figure 6: Linear trend line
corresponding to rainfall data (1971-2010:Tabligbo station)
The "figure 7" represents the graph for the twelve (12) months
average rainfall for the time period (1971-2010). It shows two peaks in the
year one in June (159.647mm) and another one in October (130.06 mm) which
reveals the bimodal pattern of rainfall in the study area.
Monthly Average Rainfall
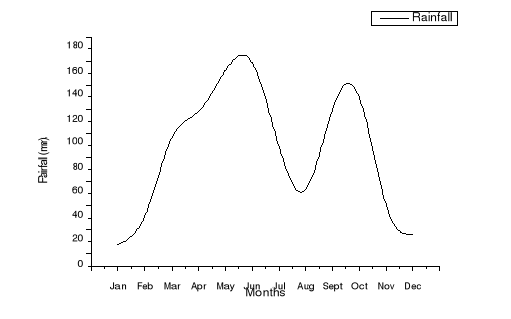
Figure 7: Monthly Average
Rainfall (1971-2010)
In the Mann-Kendall test, the Sen's slope estimator reveals the
trend of the series for 40 years for individual 12 months from January to
December which are -0.073, -0.560, -0.069, 0.353, 0.285, 1.134, 0.980, 0.153,
-0.480, 1.307, 0.699, and -0.191, respectively. For April, May, June, July,
August, October and November, there is an evidence of a rising trend while the
result is displaying negative trend in January, February, March, September and
December. Thus Sen's slope estimator shows a positive trend for eight months
and for other four months it shows a negative one representing almost
non-significant condition. The Null hypothesis was accepted for all the twelve
(12) months "annexe 2". Therefore, statistically significant trends are not
found for precipitation on monthly basis, at 95 % confidence level, even though
there are negative and positive trends for the record of period (1971-2010)
considered.
Annual Rainfall Cumulative Deviation
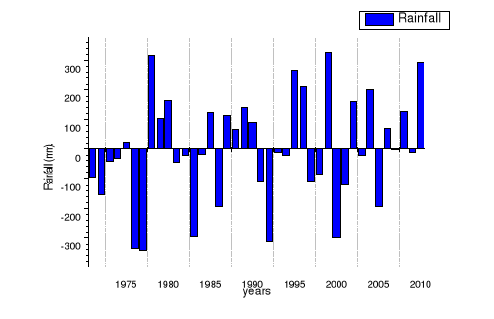
Figure 8: Annual rainfall cumulative deviation
(1971-2010) (Tabligbo station)
To be able to determine normal, wet and dry years, cumulative
deviation from mean of rainfall pattern were computed for the periods of
record. "The figure 8" reveals that a cyclic pattern of variations with
alternating drier and wetter years is suggested. Two main phases of different
lengths were detected (1971-1977 and 1978-2010). The first phase covering eight
(8) years shows six negatives anomalies that let to conclude a dry phase. It is
followed by a long period from 1978-2010 characterized by variations with
alternating drier and wetter years. This result explains rainfall variability
over the study area during the period under examination.
| 

