Study on mobile learning contribution on college students assignment with faculty support( Télécharger le fichier original )par François UWIZEYIMANA Prist University - M.Phil- Education 2016 |

3.1. INTRODUCTIONDoing a research is a basis of our life we want to succeed life. No research no country development as well as no life, otherwise we will live miserably. God has given us the power of exploring everything he had created and that thing should help us to well survive on this world. This technique of living scientifically has the rules and regulations so as to be so called. In this chapter we are going to make a look of our research techniques, methods and tools used especially in our field of education «The research in field of education is classified under three different categories viz, historical research, normative research and experimental research. Research involves formal, systematic and intensive process of carrying out a problem through scientific method of analysis» (Best and Kakn) . It requires careful analysis and adaptation of various techniques of thinking, employing relevant tools and instruments and systematic procedures. Therefore, in the present study, utmost care has been taken to provide a clear lay out for implementing the problem selected for investigation. In this chapter, the methodological procedure employed for studying the problem explained in introduction of this research project. The following are important research strategies of this study: 1. Selecting the topic and conceptualizing the variables of the study (conceptualization framing of hypotheses) 2. Reviewing the related literature to deep understand the topic and to identify the research gap of the study (problem clarity) 3. designing of the appropriate methodology for the study 4. Fixing the sample. In any good research, before talking about the sample you have to think about population of the study. After knowing your population you decide scientifically the vivid sample of that project. The development of tools necessary for the research must be clarified here descriptively and differentially. 5. The classified and tabulated data are analyzed using appropriate statistical techniques 6. The analyzed data are presented in terms of findings. 3.2 STATEMENT OF THE PROBLEM A recent rapid advancement in the capabilities of mobile devices along with a decrease in price has enabled the mobile phone to become ubiquitous. In fact, day to day globally there are a good number of people using mobile devices in different purposes. `'Although estimates are lower for rural areas, it is predicted that 80 percent of people living in rural communities have access to a mobile network. In fact, in places where infrastructure barriers have prevented developing countries from accessing the Internet, the majority of people access the Internet from their mobile devices'' (International Telecommunication Union, 2010). This is a real sign to conform without doubt that world people lifestyle has been being changed due to advanced mobile devices. According to Pamela Pollara(2011) Said that We can instantly access email from mobile devices, read articles, pay bills, send checks, buy clothing, play games, interact with others through social networking and SMS, and even check into a flight at the airport with a mobile boarding pass. Mobile devices are allowing users to perform a variety of tasks that once took multiple avenues to accomplish with the ease of a few clicks and touches, anytime, anywhere. As you see today technology is leading the world in deferent sectors of life. This has pushed me to look into educational sector, how the technological influence impact in that domain. The recent trends in education are now observed by any one. But how are mobile devices changing the way we learn? Although the use of mobile devices is, for many, necessary for survival in mainstream society, in field of education the use of mobile phones are still prohibited in many institutes of higher education. Pamela Pollara(2011), in her doctoral project introduced the dichotomy which continues to exist between society and education, however, how will education ultimately fare? The challenge for education is continuing to grow as students born in the digital and mobile age are approaching learning from a very different perspective than their predecessors. Learners are increasingly using digital tools and constructing and sharing knowledge in new ways (Looney & Sheehan, 2001; Kimber et al., 2002). These students, which Prensky (2001) labels «digital natives,» are conflicting with faculty who are often viewed as «digital immigrants.» Because «digital natives» and «digital immigrants» often have different expectations of what learning is and how it should be done, effectively teaching new generations of students with traditional methods will become increasingly more difficult. Students are beginning to demand more flexibility, alternative modes of delivery of instruction, and more multimedia-enriched and interactive course materials (Lam & McNaught, 2006). As technological world educators, to sit, to research as well as to find out current pedagogical strategies, should increase the new understanding and how define spaces dedicated to learning. Ultimately, shifting paradigms will benefit both students by increasing achievement and learning outcomes and universities by helping them remain competitive with alternative educational outlets (Collis & Wende, 2002; Prensky, 2004). Incorporating mobile learning is just one potential way to meet the needs of both students and universities in the digital age. While the rapid advancement in the capabilities of mobile technology has enabled users to perform a wide variety of tasks on one device, the decrease in cost has had both positive and negative effects, especially with relationship to education. The change has happened so fast that researchers have not had an ample amount of time to understand how these devices can best be used for learning. While educators wait for the research to catch up, the research that does exist becomes less relevant each day as technology continues to evolve and ownership continues to increase. Current research has yet to fully explore the potential of integrating mobile devices beyond a single classroom activity, nor has it explored the potential of letting students use personal mobile devices as educational tools inside and outside the classroom. This gap in the research, combined with the fear of educators that mobile devices can only distract students from learning and provide a vehicle for cheating, has led to the banning of mobile devices in classrooms and so, educators must respond to this need and recognize that mobiles are increasingly relied upon outside the classroom not just as social and entertainment devices, but as learning tools also. Mobile devices are becoming increasingly prevalent in a variety of fields. Doctors, for example, are increasingly using their smart phones to access medical information like looking up information about drugs, investigating drug interactions, and even prescribing from their mobiles. In fact, a recent survey regarding physician's views with emerging technology found that 95 percent of physicians that owned smart phones reported downloading applications to access medical information (Dolan, 2010). New technological developments have also led to the FDA approval of a mobile application that allows doctors to diagnose a stroke by viewing 3D images of brain scans on the doctor's smart phone, which may help patients in rural areas who may not have access to neurologists (Belcher, 2011). A study in the Journal of Medical Internet Research that compared the accuracy of neuroradiologists who used this app to a traditional workstation, found that the app results were 94 to 100 percent accurate. The use of smart phones is prevalent in other fields as well. Journalists are using the various functions of smart phones to write, record audio and video, take photos, and keep abreast of breaking news (Vaataja, Mannisto, Vainio, & Jokela, 2009). Above examples are few of many showing the importance of using mobile devices in our daily activities including education. Pollara(2011) continued to say that among the various 21st century skills that researchers believe are becoming increasingly essential for success in life and work. For example, researchers and government are calling for students to be able to apply technology effectively through ICT (Information, Communications, and Technology) literacy. This includes using technology as a tool to research, organize, evaluate and communicate information and using digital technologies (including mobile technology) to access, manage, integrate, evaluate and create information to successfully function in a knowledge economy (Partnership for 21st Century Skills, 2011). And so, if these skills are necessary for success, there is a responsibility on the part of educators to prepare students to navigate mobile devices as educational tools and engage them in meaningful practice for their future careers. For all these said above on the technological advancement in different lifestyle sectors, have been pushing me to make a deep look for the real contribution of mobile learning on college students' assignments while supported by their particular faculties. 3.3 VARIABLES SELECTED FOR THE STUDY 3.3.1. Institutional variables One private university has been selected for the study located in Thanjavur Distict whose name is Prist University. From the university the following variables were considered: 1. Gender Gender is an independent variable in this study where the teachers and students combined are considered to have their unique understanding according to their gender. Gender refers to the socially constructed roles, behaviour, activities and attributes that a particular society considers appropriate for men and women (WHO,2011). In order to do valid and reliable researcher has tried to the role of gender factor in using mobile learning to contribute in college students assignments as well as all educational tasks. According to such sex you are, either female or male, there is a certain influence in using mobile device. 2. Affiliation and duty The term affiliation in this study show that the respondents are in different cluster and groups. Some are students others are teachers. 3. Major of students The different majors of students have been used such as B.B.A.; B.C.A.; B.Sc.; B.Ed.; B.Tech or B.E.; M.B.A.; M.C.A.; M.Ed.; M.Tech. According to the major the student is belonging to, he/she should be influence by his/her major to be more motivated in using mobile device because of lower or higher level of information technology. 4. Teaching experience The experience is an important factor in different domain of life. In field of education in the same case, an experienced teacher influence more the students in gaining new knowledge, recently new teaching hardware are abundant, experienced and non experienced should not handle the use of new material like mobile devices in the same manner. In this study the investigator has tried to make an inferential study scientifically. 5. Educational qualification Educational qualification has been included as an independent variable in sense that lower level of education should ban the recent and current trends in field of delivering and receiving knowledge. Then a comparative study has been done to make sure the influence level of qualification in mobile learning contribution to support college students' assignments. 6. Students' level of performance This is an independent variable taken here to make a comparative study in lower level performer and high level performer if there is no significance influence of mobile devices use. As a new school material, mobile device should be used anywhere and anytime to help student in his learning. This has pushed the investigator to make inferential study. 3.3.2. Research variables The research variables used in this study are: 1. Mobile learning as independent variable 2. College students' assignment is dependent variable 3.4. HYPOTHESIS OF THE STUDY 1. There is no significant difference between teachers and students that mobile technologies in learning practices are high and continue to increase among students in respect of working assignment. 2. There is significant difference between students and instructors (teachers) to need logistical, technical and pedagogical support to integrate mobile devices and applications in formal and informal learning. 3. There is no significant difference between female and male that the continuous support and targeted training resources should produce positive change in students' mobile learning in respect of students' assignments. 4. There is significant difference between students of B.Tech(B.E), B.Sc, M.Tech., B.C.A.,M.C.A and students of B.B.A, B.Ed, M.B.A.,M.Ed.,that effective use of mobile technologies is less about tools and students' digital literacy skills including ability to access, manage and evaluate digital resources in respect of mobile learning as well as students' assignments. 5. There is significant difference between students of undergraduate studies and students of postgraduate studies that effective use of mobile technologies is less about tools and students' digital literacy skills including ability to access, manage and evaluate digital resources in respect of mobile learning as well as students' assignments. 6. There is significant difference among experienced teachers with 0-1 year, 1-3years, 3-6 years, 6-9years and those of 10 or above years of experience that Wide-scale implementation of mobile learning devices (technologies) depends upon clear university policy, device availability, and accessible technical and pedagogical support in respect of students' assignments. 7. There is no significant difference between teachers and students that investigation on mobile learning practice and their impact on students' academic life is not done accordingly. 8. There is significant difference between experienced teachers with 6 years and those less than 6 years of experience that seeking out pedagogical insights of mobile learning as well as technologies will help teachers better to improve students in respect of working assignment. 9. There is no significant difference between female students and male students that use mobile devices with 24/7 wireless internet access empower students to take responsibility for their learning particularly in working assignments. 10. There is no significant difference between students with 0-49 marks, 50-59 marks, 60-69 marks, 70-79 marks, 80-89 marks, 90-100 marks that students feel more successful and demonstrate high level of performance by using mobile learning devices in respect of working assignments. 11. There is no significant difference between teachers with B.Ed and/or M.Ed and those without B.Ed and/or M.Ed that mobile teaching and learning applications have power to change the way teachers think about their teaching. 12. There is no significant difference between teachers and students that the students use mobile devices to connect communicate and collaborate with other students as they create personalized mobile learning experiences. 3.5. RESEARCH DESEIGN Figure 3.5.3
VARIABLE Mobile learning and college students' assignment TOOLS Descriptive and inferential tools SAMPLE 200 individuals composed by 50 teachers and 150 students
College students' assignment Mobile learning CORRELATION ANALYSIS (Relationship) INFERENTIAL ANALYSIS (t-test, F-test, Chi-square DESCRIPTIVE ANALYSIS (mean, SD) INDEPENDENT VARIABLE DEPENDENT VARIAABLE 3.6. METHOD OF THE STUDY The researcher in order to fulfil and realize the predetermined objectives, the survey method has been used in the current project. Normative survey study describes what exists at present. They are concerned with existing conditions or relations, prevailing practices, beliefs and attitudes. Gokila, G. (2014). In other sense we call this study the descriptive survey. Gokila continues to say that the term «Normative» implies the determinations of typical conditions or practices. He emphasis that the term «survey» suggests the gathering of evidences related to prevailing conditions or practices. 3.7. SAMPLE AND SAMPLING TECHNIQUES In the present study, sample was selected from Prist university faculties and their students in all departments. The data was collected from 50 faculties and 150 students total is 200 individuals. They have been selected randomly and conveniently. Sampling is the process of selecting a sufficient number of elements from the population, so that the study of the sample and an understanding of its properties or characteristics would make it possible for us to generalize such properties or characteristics to the population elements. Gokila, G. (2014). Sampling design is to define clearly that set of objects, technically called universe to be studied. Gokila, G. (2014). The sampling design used in this study is probability sampling. The sampling techniques used are stratified random sampling. A sample plan is a definite plan for obtaining a sample from a given population, it refers to the technique or the procedure the researcher would adopt in selecting items for the sample. After deciding the research approach the next stage is to deseign a sampling plan. The selected respondents from the total population constitute what is technically called a sample and the selection process is called sampling technique. Gokila, G. (2014). Table: 3.7.2 The following table explains the sample and size of the sample in institutional variables
Source: Primary data 2016 3.8. TOOLS FOR THE STUDY In this study on mobile learning contribution to college students' assignment, the research has used his own developed tool for collecting data. He has used questionnaire as tool. 3.9. DESCRIPTION OF THE TOOL The variable selected by the researcher is mobile learning as independent and college students' assignment as dependent research variable with 200 individuals of sample. 89 questions have been composed where 51 were for students and 38 were for faculty. 3.10. RELIABILITY, VALIDITY AND SCORING PROCEDURE Mobile learning Reliability Reliability of mobile learning scale was established by the investigator using split-half method, which found to be 0.74 reliable results. Validity The research also ensured the validity of the tool by using concurrent validity. Scoring procedure There are 32 items in the mobile learning for a score of 2 and 1 with yes or no response. The maximum score for this scale is 64 and 32 is the minimum score. There is no time limit to complete the research tool but most of respondents complete within 25 minutes. College students' assignment Reliability The reliability of the college students' assignment inventory was established by the researcher by using split-half method, which was found to be 0.71 Validity The investigator also ensured the validity of the tool by using face validity. Scoring procedure College students' assignment inventory consists of 56 statements. Each statement has to respond with one of five responses as following: Strongly disagree, Disagree, Neutral, Agree, and Strongly Agree. The maximum score for this scale is 280 and 56 is the minimum score. There was no time limit to complete the investigation tool but most of respondents complete within 35 minutes 3.11. STATISTICAL TECHNIQUES USED The following statistical techniques have been used in this project Mean: Mean Where A= Assumed mean f =Frequency d =Deviation from the assumed mean C.I =Class interval Standard deviation Standard deviation Where f = Frequency d = deviation from assumed mean C.I = class interval N = total frequency T-TEST: t Where M1, M2 = means of groups N1, N2 = Total number of sample in each group F-TEST: F
3.12. DATA COLLECTION The researcher himself went to University campuses and met all needed faculty and students in Prist university. The investigator, before meeting individuals so as to fill questionnaire, he met his guider and v/chancellor in charge. After getting permission the researcher met the faculty and did a little introduction then filling research tool coming few minutes later. The case was the same for meeting the students, I did little introduction to the students which were available in the campus, more than 150 students tried to fill the questionnaire including both sex such girls and boys. 3.13. CONCLUSION The mobile learning contribution and college students' assignment were administered to the same sample of 200 individuals including 150 students and 50 faculties. Obtained data were statistically treated and interpreted; they have been being presented in the following chapter.
CHAPTER-IV 4. ANALYSIS AND INTERPRETATION 4.1 INTRODUCTION This chapter deals with analysis and interpretation of the data. Analysis of the data means studying the tabulated material in order to determine the inherent facts or meanings. G.Gokila, (2014). This author continued to say that it is a process which involves breaking down existing complex factors into simpler parts and putting the parts together in new arrangements for the purpose of the study and present the results in an organized and meaningful form. From analysis and interpretation we find what the researcher has intended from the beginning of his project. All things that other investigators didn't say it is a time of current researcher to put it out. The purpose of the interpretation is essentially stating what the result show what they mean, what their significance is and what the answer to the original problem is. G.Gokila, (2014). There is no doubt that from this part of research we should make a comparison study of previous research and current one and also the comparison of the results with the predetermined hypothesis. 4.2. DESCIPTIVE STATISTICS Descriptive statistics is the discipline of quantitatively describing the main features of a collection of data. Descriptive statistics are distinguished from inferential statistics or inductive statistics, in that descriptive statistics aim to summarize a data set, rather than use the data to learn about the population that the data are thought to represent. (G.Gokila, 2014). This generally means that descriptive statistics, unlike inferential statistics, are not developed on the basis of probability theory. Even when a data analysis draws its main conclusions using inferential statistics, are generally also presented. 4.3. DIFFERENTIAL STATISTICS We use differential statistics to make judgements of the probability that the an observed difference between groups is a dependable one or one that might have happened by chance in the study. G.Gokila, (2014). Thus, we use inferential statistics to make inferences from our data to more general conditions; we use descriptive statistics simply to describe what is going on in our data. Most of the major inferential statistics come from a general family of statistical models known as the general linear model. G.Gokila, (2014). GENDER 1. GENDER FOR STUDENTS Table: 4.3.3 Frequencies of sample used in female and male students in using 24/7 wireless internet on mobile device for empowering their learning
Source: primary data 2016 In this above table, it shows number of female and male according to their gender. The number of female is seventy four (74) having 49.3%, where the number of male is seventy six (76) having 50.7%. The total number of the sample used in this project is two hundred (150) related to students individuals. Figure: 4.3.4 Frequencies of sample used in female and male students in using 24/7 wireless internet on mobile device for empowering their learning
In this above figure, it shows number of female and male according to their gender. The number of female is seventy four (74) having 49.3%, where the number of male is seventy six (76) having 50.7%. The total number of the sample used in this project is two hundred (150) related to students individuals.
Table: 4.3.4 2. GENDER FOR TEACHERS
Source: primary data 2016 As it has been highlighted above on the histogram, the number of teachers totally was fifty (50), where 26 having 52% are female and male are twenty four (24) which is equal to 48%. Figure: 4.3.5 Frequencies of sample used to study if continuous support and training for mobile learning based on gender teachers
As it has been highlighted above on the histogram, the number of teachers totally was fifty (50), where 26 having 52% are female and male are twenty four (24) which is equal to 48%. STUDENTS' LEVEL OF PERFORMANCE Table: 4.3.5 Frequencies sample used among students of different level of performance on mobile learning in respect of working assignments
Source: primary data 2016 In this table highlighted above, it is showing the frequency of student performance sample used during research project. 34 students which have 22.7% are in interval marks of 0 to 49. Next is 11 students having 7.3% in interval marks of 50 to 59. The following is 14 students which have 9.3% belonging in interval marks of 60 to 69. Other group of 45 students which have 30% in interval marks of 70 to 79. The student whose number is 44, their percentage is 29.3% and has interval marks of 80 to 89. The next group of students whose number is 2 they have 1.3% of all students, their interval marks is 90 to 100. The total number of students was one hundred and fifty (150). Figure: 4.3.6 Frequencies sample used among students of different level of performance on mobile learning in respect of working assignments
In this figure showcased above, it is showing the frequency of student performance sample used during research project. 34 students which have 22.7% are in interval marks of 0 to 49. Next is 11 students having 7.3% in interval marks of 50 to 59. The following is 14 students which have 9.3% belonging in interval marks of 60 to 69. Table: 4.3.6 AFFILIATION AND DUTY
Source: primary data 2016 As you are observing on above figure, the number of teachers in this hypothesis was fifty(50) having 25% of total sample where the number of students was one hundred fifty(150) which is equal to 75% 0f total sample; total number of sample was two hundred(200). Figure: 4.3.7 The following figure shows the frequencies of students and teachers in use of mobile technologies in learning practices among students in respect of working assignment.
As you are observing on above figure, the number of teachers in this hypothesis was fifty(50) having 25% of total sample where the number of students was one hundred fifty(150) which is equal to 75% 0f total sample; total number of sample was two hundred(200). MAJOR OF STUDENTS Table: 4.3.7 Frequencies of sample used to study mobile literacy, skills as well as effective use in respect of mobile working assignment.
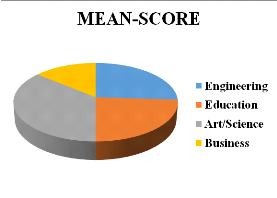
Source: primary data 2016 It is highlighted in above table that the number of engineering students are thirty nine (39) which is equal to 26%, the number of student in school of education are 36 having 24%, the number of students in school of arts and science are 54 which is equal to 36%, finally the number of students in school of business is 21 having 14% of total number. Total number of students sample is 150. Figure: 4.3.8 Frequencies of sample used to study mobile literacy, skills as well as effective use in respect of mobile working assignment.
It is highlighted in above figure that the number of engineering students are thirty nine (39) which is equal to 26%, the number of student in school of education are 36 having 24%, the number of students in school of arts and science are 54 which is equal to 36%, finally the number of students in school of business is 21 having 14% of total number. Total number of students sample is 150. TEACHING EXPERIENCE Table: 4.3.8 Teachers sample used based on their experience in implementation of mobile learning technologies
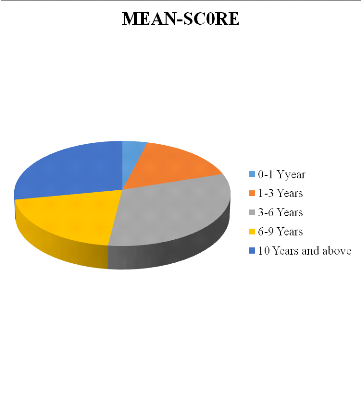
Source: primary data 2016 By making a look in this above table, based on their experience, the teachers are as following: With at least one year experience are 2 teachers having 4% of total number, the number of teachers with one to three years of experience are 8 in this study which is equal to 16%, the researcher used 16 teachers with three to six years of experience having 32% of total number, only 10 teachers have been used and they have between six to nine years of experience which have 20%. Finally the interval of 10 years and above its number is 14 which is equal to 28% as the interpretation highlights it. The total number of teachers is 50. Figure: 4.3.9 Teachers sample used based on their experience
By making a look in this above figure, based on their experience, the teachers are as following: With at least one year experience are 2 teachers having 4% of total number, the number of teachers with one to three years of experience are 8 in this study which is equal to 16%, the researcher used 16 teachers with three to six years of experience having 32% of total number, only 10 teachers have been used and they have between six to nine years of experience which have 20%. Finally the interval of 10 years and above its number is 14 which is equal to 28% as the interpretation highlights it. The total number of teachers is 50. STUDENTS EDUCATION LEVEL Table: 4.3.9 Frequencies of sample used to study mobile literacy, skills as well as effective use in respect of mobile working assignment in undergraduate and postgraduate students.
Source: primary data 2016 In this above table, it shows number of students according to their educational level. The students from undergraduate studies are one hundred and twenty (120) which is equal to 80%, where the students from post graduate level are thirty (30) which is equal to 20% of total sample in this hypothesis. The total number of the student sample is one hundred and fifty (150). Figure: 4.3.10 Frequencies of sample used to study mobile literacy, skills as well as effective use in respect of mobile working assignment in undergraduate and postgraduate students.
In this above figure, it shows number of students according to their educational level. The students from undergraduate studies are one hundred and twenty (120) which is equal to 80%, where the students from post graduate level are thirty (30) which is equal to 20% of total sample in this hypothesis. The total number of the student sample is one hundred and fifty (150). EDUCATIONAL QUALIFICATION Table: 4.3.10 Frequencies sample showing teachers with B. Ed and/or M. Ed and those without B. Ed and/or M. Ed that mobile teaching and learning application
Source: primary data 2016 As it is explained in above table, the frequency of teachers used according to their level of education is fifty as total number. All individual degrees were combined in one except education degree ( both B.Ed. and M.Ed. ). In this study a teacher must hold educational course to be qualified as skilled teacher. 24 teachers which have 48% in this study they have neither M.Ed. nor B.Ed. Wherein 26 teachers of total number which is equal to 52% have said that they hold either M.Ed. or B.Ed. Figure: 4. 3.11 Frequencies sample showing teachers with B. Ed and/or M. Ed and those without B. Ed and/or M. Ed that mobile teaching and learning application
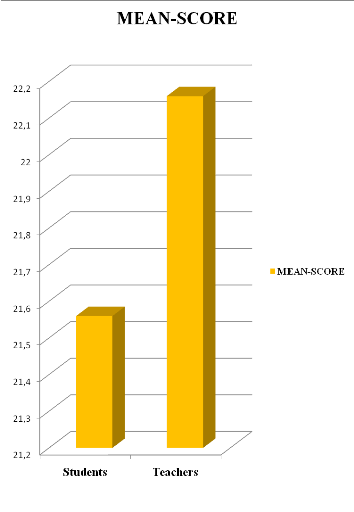
As it is explained in above figure, the frequency of teachers used according to their level of education is fifty as total number. All individual degrees were combined in one except education degree ( both B.Ed. and M.Ed. ). In this study a teacher must hold educational course to be qualified as skilled teacher. 24 teachers which have 48% in this study they have neither M.Ed. nor B.Ed. Wherein 26 teachers of total number which is equal to 52% have said that they hold either M.Ed. or B.Ed. 4.4. TESTING HYPOTHESES NULL HYPOTHESIS: I 1. There is no significant difference between teachers and students that mobile technologies in learning practices are high and continue to increase among students in respect of working assignment. Table: 4.4.11 Difference mean between teachers and students to use mobile technologies, for learning practices in respect of working assignment
Source: primary data 2016 Inference From above table, it is clear that the calculated value of 4.684 is greater than the table value 1.96 at 0.05 significant level. Hence it is found that, there is significant difference between teachers and students that mobile technologies in learning practices are high and continue to increase among students in respect of working assignment. Therefore the null hypothesis is rejected. Figure: 4.4.12. Difference mean between teachers and students to use mobile technologies, for learning practices in respect of working assignment
Source: primary data 2016 NULL HYPOTHESIS: II There is significant difference between students and instructors (teachers) to need, technical and pedagogical support to integrate mobile devices and applications in formal and informal learning. Table: 4.4.12 Difference between teachers and students in need of technical and pedagogical support to integrate mobile learning
Source: primary data 2016 Inference From above table, it is clear that the calculated value of 3.960 is greater than the table value 1.96 at 0.05 significant level Hence it is found that there is no significant difference between teachers and students to need technical and pedagogical support to integrate mobile learning. Therefore the null hypothesis is rejected. Figure: 4.4.13. Difference between teachers and students in need of technical and pedagogical support to integrate mobile learning
Source: primary data 2016 NULL HYPOTHESIS: III There is no significant difference between female and male that the continuous support and targeted training resources should produce positive change in students' mobile learning in respect of students' assignments. Table: 4.4.13 Difference between female teachers and male teachers on continuous support and training for mobile learning
Source: primary data 2016 Inference From above table, it is clear that the calculated value of 0.700 is less than the table value 2.000 at 0.05 significant levels Hence it is found that there is no significant difference between female and male teachers that the continuous support and targeted training resources should produce positive change in students' mobile learning in respect of students' assignments. Therefore the null hypothesis is accepted. Figure: 4.4.14 Difference between female teachers and male teachers on continuous support and training for mobile learning
Source: primary data 2016 NULL HYPOTHESIS: IV There is significant difference between students of ENGINEERING, EDUCATION DEPARTMENT students, students of BUSINESS DEPARTMENT and ART/SCIENCE students ,that effective use of mobile technologies is less about tools and students' digital literacy skills including ability to access, manage and evaluate digital resources in respect of mobile learning as well as students' assignments. Table: 4.4.14 Difference among Engineering, Education, Arts/Science as well as Business department students in mobile learning skills, literacy as well as effective use in different departments
Source: primary data 2016 Inference From above table, it is clear that the calculated value of F (4,146) which is 3.415 is less than the table value 2.60 at 0.05 significant level Hence it is found that the difference between students of ENGINEERING, EDUCATION DEPARTMENT students, students of BUSINESS DEPARTMENT and ART/SCIENCE students ,that effective use of mobile technologies is less about tools and students' digital literacy skills including ability to access, manage and evaluate digital resources in respect of mobile learning as well as students' assignments is not significant. Therefore the null hypothesis is rejected Figure: 4.4.15 Difference among Engineering, Education, Arts/Science as well as Business department students in mobile learning skills, literacy as well as effective use in different departments
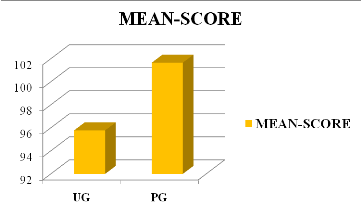
Source: primary data 2016 NULL HYPOTHESIS: V There is significant difference between students of undergraduate studies and students of postgraduate studies that effective use of mobile technologies is less about tools and students' digital literacy skills including ability to access, manage and evaluate digital resources in respect of mobile learning as well as students' assignments. Table: 4.4.15 Difference between students of undergraduate studies and students of postgraduate studies in mobile learning skills, literacy as well as effective use in different departments
Source: primary data 2016 Inference From above table, it is clear that the calculated t- value which is 1.247 is less than the table value 1.960 at 0.05 significant levels Hence it is found that the difference between students of undergraduate studies and students of postgraduate studies ,that effective use of mobile technologies is less about tools and students' digital literacy skills including ability to access, manage and evaluate digital resources in respect of mobile learning as well as students' assignments is significant. Therefore the null hypothesis is accepted. Figure: 4.4.16. Difference between students of undergraduate studies and students of postgraduate studies in mobile learning skills, literacy as well as effective use in different departments
Source: primary data 2016 NULL HYPOTHESIS: VI There is significant difference among experienced teachers with 0-1 year, 1-3years, 3-6 years, 6-9years and those of 10 or above years of experience that Wide-scale implementation of mobile learning devices (technologies) depends upon clear university policy, device availability, and accessible technical and pedagogical support in respect of students' assignments. Table: 4.4.16 Deference among teachers based on their teaching experience in implementation of mobile learning technologies ANOVA
Source: primary data 2016 Inference From above table, it is clear that the calculated F- value (4, 45) which is 1.738 is less than the table value 2.610 at 0.05 significant levels Hence it is found that the difference among experienced teachers with 0-1 year, 1-3years, 3-6 years, 6-9years and those of 10 or above years of experience that Wide-scale implementation of mobile learning devices (technologies) depends upon clear university policy, device availability, and accessible technical and pedagogical support in respect of students' assignments is significant. Therefore the null hypothesis is accepted. Figure: 4.4.17 Deference among teachers based on their teaching experience in implementation of mobile learning technologies
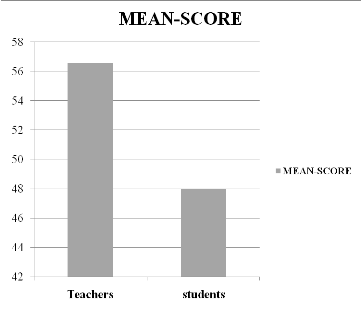
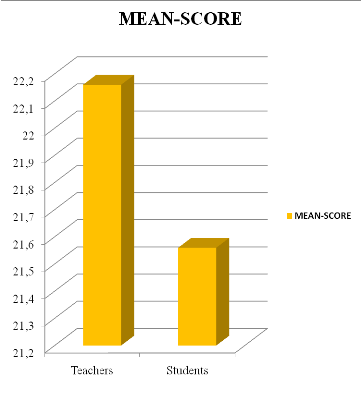
Source: primary data 2016 NULL HYPOTHESIS: VII There is no significant difference between teachers and students that investigation on mobile learning practice and their impact on students' academic life are not done accordingly. Table: 4.4.17 Difference between teachers and students on Investigation of mobile learning in respect of working assignment
Source: primary data 2016 Inference From above table, it is clear that the calculated t- value which is 3.837 is greater than the table value 1.96 at 0.05 significant levels Hence it is found that the difference between teachers and students that investigation on mobile learning practice and their impact on students' academic life is not done accordingly, is significant. Therefore the null hypothesis is rejected. Figure: 4.4.18 Difference between teachers and students on Investigation of mobile learning in respect of working assignment
Source: primary data 2016 NULL HYPOTHESIS: VIII There is no significant difference between female students and male students that use mobile devices with 24/7 wireless internet access empower students to take responsibility for their learning particularly in working assignments. Table: 4.4.18 Difference between female and male students in using 24/7 wireless internet on mobile device for empowering their learning
Source: primary data 2016 Inference From above table, it is clear that the calculated t- value which is 2.472 is greater than the table value 1.96 at 0.05 significant levels Hence it is found that the difference between female students and male students that use mobile devices with 24/7 wireless internet access empower students to take responsibility for their learning particularly in working assignments, is significant. Therefore the null hypothesis is rejected. Figure: 4.4.19 Difference between female and male students in using 24/7 wireless internet on mobile device for empowering their learning
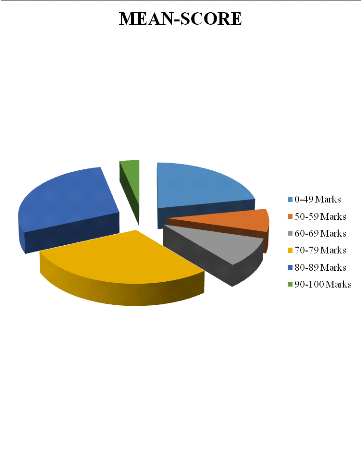
Source: primary data 2016 NULL HYPOTHESIS: IX There is no significant difference between students with 0-49 marks, 50-59 marks, 60-69 marks, 70-79 marks, and 80-89 marks, 90-100 marks that students feel more successful and demonstrate high level of performance by using mobile learning devices in respect of working assignments. Table: 4.4.19 Difference among students of different level of performance on mobile learning in respect of working assignments
Source: primary data 2016 Inference From above table, it is clear that the calculated F- value (5,144) which is 7.469 is greater than the table value 2.21 at 0.05 significant levels Hence it is found that the difference among students with 0-49 marks, 50-59 marks, 60-69 marks, 70-79 marks, and 80-89 marks, 90-100 marks that students feel more successful and demonstrate high level of performance by using mobile learning devices in respect of working assignments, is significant. Therefore the null hypothesis is rejected. Figure: 4.4.20 Difference among students of different level of performance on mobile learning in respect of working assignments
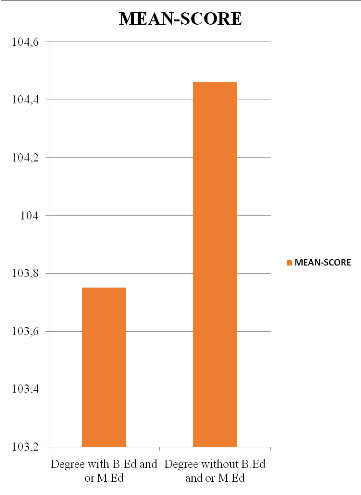
Source: primary data 2016 NULL HYPOTHESIS: X There is no significant difference between teachers with B. Ed and/or M. Ed and those without B. Ed and/or M. Ed that mobile teaching and learning applications have power to change the way teachers think about their teaching Table: 4.4.20 Difference between teachers with B. Ed and/or M. Ed and those without B. Ed and/or M. Ed that mobile teaching and learning application
Source: primary data 2016 Inference From above table, it is clear that the calculated t- value which is 0.188 is less than the table value 1.684 at 0.05 significant levels Hence it is found that the difference between teachers with B. Ed and/or M. Ed and those without B. Ed and/or M. Ed that mobile teaching and learning applications have power to change the way teachers think about their teaching, is not significant. Therefore the null hypothesis is accepted Figure: 4.4.21. Difference between teachers with B. Ed and/or M. Ed and those without B. Ed and/or M. Ed that mobile teaching and learning application
Source: primary data 2016 NULL HYPOTHESIS: XI There is no significant difference between teachers and students that the students use mobile devices to connect communicate and collaborate with other students as they create personalized mobile learning experiences Table: 4.4.21 Difference between teachers and students in using mobile device as social material perspective than learning tool
Source: primary data 2016 Inference From above table, it is clear that the calculated t- value which is 1.39 is less than the table value 1.96 at 0.05 significant levels Hence it is found that the difference between teachers and students that the students use mobile devices to connect, communicate and collaborate with other students as they create personalized mobile learning experiences is not significant. Therefore the null hypothesis is accepted. Figure: 4.4.22. Difference between teachers and students in using mobile device as social material perspective than learning tool
Source: primary data 2016 4.5. CONCLUSION The data collected related to the study were analysed and interpreted. It gives the various mathematical analyzes which have been done so as to test hypotheses. The percentage analysis used to find the frequencies on mobile learning contribution on college students assignments with faculty support. Besides, both t-test and F-test have been used as testing hypotheses tools in order to find out the significant relationship among groups. The findings and conclusions thus obtained from the analyzes of this chapter have been summarized and presented along with brief report of research study and implications of the study in the following chapter. CHAPTER-V 5. SUMMARY OF FINDINGS, SUGGESTIONS AND CONCLUSION 5.1. INTRODUCTION In order to study the use of mobile learning as a recent trend in field of education in especially at high education level, the researcher has decided to conduct the present research project among teachers and students of college level studies. Main goal was to find out the implication and contribution of mobile devices in field of education. The project title is «MOBILE LEARNING CONTRIBUTION ON COLLEGE STUDENTS ASSIGNMENTS WITH FACULTY SUPPORT.» This chapter is clearly explains the findings, recommendations, suggestions and conclusions of the present study. 5.2 NEED FOR THE STUDY We are living the based technological based society nowadays. In order to achieve so many different life goals we need completely the integration of technology. Teaching laboratory has not been put apart, it is itself concerned and involved. In field of education we do say technology or simply educational technology in sense that a teacher well trained, tries his/she best to analyze, design, develop, implement and evaluate process and tools to enhance learning so that the output should be good. Educational technology is defined by the Association for Educational Communications and Technology (AECT) as "the study and ethical practice of facilitating learning and improving performance by creating, using, and managing appropriate technological processes and resources." Educational technology refers to the use of both physical hardware and educational theoretic. It encompasses several domains, including learning theory, computer-based training, online learning, and, where mobile technologies are used, m-learning. Accordingly, there are several discrete aspects to describing the intellectual and technical development of educational technology: We do understand the meaning of educational technology in four important keys as the Wikipedia website continues to explain a) educational technology as the theory and practice of educational approaches to learning b) educational technology as technological tools and media that assist in the communication of knowledge, and its development and exchange c) educational technology for learning management systems (LMS), such as tools for student and curriculum management, and education management information systems (EMIS) d) Educational technology itself as an educational subject; such courses may be called "Computer Studies" or " Information and communications technology (ICT)". There is no doubt that mobile learning technologies are coming from the broad field of educational technology. The m-learning is an involved element of this field said above. In this study, the researcher has been interested in finding out the impact of using mobile device technologies in field of education as a new trend. 5.3. PROBLEM STATEMENT A recent rapid advancement in the capabilities of mobile devices along with a decrease in price has enabled the mobile phone to become ubiquitous. In fact, day to day globally there are a good number of people using mobile devices in different purposes. `'Although estimates are lower for rural areas, it is predicted that 80 percent of people living in rural communities have access to a mobile network. In fact, in places where infrastructure barriers have prevented developing countries from accessing the Internet, the majority of people access the Internet from their mobile devices'' (International Telecommunication Union, 2010). According to Pamela Pollara(2011) Said that We can instantly access email from mobile devices, read articles, pay bills, send checks, buy clothing, play games, interact with others through social networking and SMS, and even check into a flight at the airport with a mobile boarding pass. Mobile devices are allowing users to perform a variety of tasks that once took multiple avenues to accomplish with the ease of a few clicks and touches, anytime, anywhere. As technological world educators, to sit, to research as well as to find out current pedagogical strategies, should increase the new understanding and how define spaces dedicated to learning. Ultimately, shifting paradigms will benefit both students by increasing achievement and learning outcomes and universities by helping them remain competitive with alternative educational outlets Collis & Wende, 2002; Prensky, (2004). From this view and theories the researcher currently has decided to conduct the research on the topic entitled «MOBILE LEARNING CONTRIBUTION ON COLLEGE STUDENTS ASSIGNMENTS WITH FACULTY SUPPORT.»
5.4. HYPOTHESES OF THE STUDY Ø There is no significant difference between teachers and students that mobile technologies in learning practices are high and continue to increase among students in respect of working assignment. Ø There is significant difference between students and instructors (teachers) to need logistical, technical and pedagogical support to integrate mobile devices and applications in formal and informal learning. Ø There is no significant difference between female and male that the continuous support and targeted training resources should produce positive change in students' mobile learning in respect of students' assignments. Ø There is significant difference between students of ENGINEERING, EDUCATION DEPARTMENT students, students of BUSINESS DEPARTMENT and ART/SCIENCE students ,that effective use of mobile technologies is less about tools and students' digital literacy skills including ability to access, manage and evaluate digital resources in respect of mobile learning as well as students' assignments. Ø There is significant difference between students of undergraduate studies and students of postgraduate studies that effective use of mobile technologies is less about tools and students' digital literacy skills including ability to access, manage and evaluate digital resources in respect of mobile learning as well as students' assignments. Ø There is significant difference among experienced teachers with 0-1 year, 1-3years, 3-6 years, 6-9years and those of 10 or above years of experience that Wide-scale implementation of mobile learning devices (technologies) depends upon clear university policy, device availability, and accessible technical and pedagogical support in respect of students' assignments. Ø There is no significant difference between teachers and students that investigation on mobile learning practice and their impact on students' academic life is not done accordingly. Ø There is no significant difference between female students and male students that use mobile devices with 24/7 wireless internet access empower students to take responsibility for their learning particularly in working assignments. Ø There is no significant difference between students with 0-49 marks, 50-59 marks, 60-69 marks, 70-79 marks, 80-89 marks, 90-100 marks that students feel more successful and demonstrate high level of performance by using mobile learning devices in respect of working assignments. Ø There is no significant difference between teachers with B.Ed and/or M.Ed and those without B.Ed and/or M.Ed that mobile teaching and learning applications have power to change the way teachers think about their teaching. Ø There is no significant difference between teachers and students that the students use mobile devices to connect communicate and collaborate with other students as they create personalized mobile learning experiences. 5.5. OBJECTIVES OF THE STUDY The research will attempt to achieve the following objectives: v To describe how there is no significance between teachers and students that mobile technologies in learning practices are high and continue to increase among students v To find out that Students and instructors (teachers) need technical and pedagogical support to integrate mobile devices and applications in formal and informal learning environments. v To describe that the continuous support and targeted training resources among female male teachers should produce positive change in students' mobile learning in respect of students' assignments. v To show that here is significant difference between students of ENGINEERING, EDUCATION DEPARTMENT students, students of BUSINESS DEPARTMENT and ART/SCIENCE students ,that effective use of mobile technologies is less about tools and students' digital literacy skills including ability to access, manage and evaluate digital resources in respect of mobile learning as well as students' assignments. v To describe that there is significant difference between students of undergraduate studies and students of postgraduate studies that effective use of mobile technologies is less about tools and students' digital literacy skills including ability to access, manage and evaluate digital resources in respect of mobile learning as well as students' assignments. v To find out that there is significant difference among experienced teachers with 0-1 year, 1-3years, 3-6 years, 6-9years and those of 10 or above years of experience that Wide-scale implementation of mobile learning devices (technologies) depends upon clear university policy, device availability, and accessible technical and pedagogical support in respect of students' assignments. v To seek out that there is no significant difference between teachers and students that investigation on mobile learning practice and their impact on students' academic life are not done accordingly. v To find out that mobile devices and 24/7 wireless internet access empower students to take responsibility for their learning particularly in working assignments. v To show that students feel more successful and demonstrate high level of performance by using mobile learning devices in respect of working assignments. v To show that mobile teaching learning applications have power to change the way teachers think about their teaching. v To find out that students use mobile devices to connect, communicate and collaborate with other students as they create personalized mobile learning experiences. 5.6. FINDINGS OF THE STUDY ü It has been found that, there is significant difference between teachers and students that mobile technologies in learning practices are high and continue to increase among students in respect of working assignment. ü It has been found that, there is no significant difference between teachers and students to need technical and pedagogical support to integrate mobile learning. ü It has been found that, there is no significant difference between female and male teachers that the continuous support and targeted training resources should produce positive change in students' mobile learning in respect of students' assignments. ü It has been found that the difference between students of ENGINEERING, EDUCATION DEPARTMENT students, students of BUSINESS DEPARTMENT and ART/SCIENCE students ,that effective use of mobile technologies is less about tools and students' digital literacy skills including ability to access, manage and evaluate digital resources in respect of mobile learning as well as students' assignments is not significant. ü It has been found that the difference between students of undergraduate studies and students of postgraduate studies ,that effective use of mobile technologies is less about tools and students' digital literacy skills including ability to access, manage and evaluate digital resources in respect of mobile learning as well as students' assignments is significant. ü It has been found that the difference among experienced teachers with 0-1 year, 1-3years, 3-6 years, 6-9years and those of 10 or above years of experience that Wide-scale implementation of mobile learning devices (technologies) depends upon clear university policy, device availability, and accessible technical and pedagogical support in respect of students' assignments is significant. ü It has been found that the difference between teachers and students that investigation on mobile learning practice and their impact on students' academic life is not done accordingly, is significant. ü It has been found that the difference between female students and male students that use mobile devices with 24/7 wireless internet access empower students to take responsibility for their learning particularly in working assignments, is significant. ü It has been found that the difference among students with 0-49 marks, 50-59 marks, 60-69 marks, 70-79 marks, and 80-89 marks, 90-100 marks that students feel more successful and demonstrate high level of performance by using mobile learning devices in respect of working assignments, is significant. ü It has been found that the difference between teachers with B. Ed and/or M. Ed and those without B. Ed and/or M. Ed that mobile teaching and learning applications have power to change the way teachers think about their teaching, is not significant. ü It has been found that the difference between teachers and students that the students use mobile devices to connect, communicate and collaborate with other students as they create personalized mobile learning experiences is not significant. 5.7. RECOMMENDATIONS FOR PRACTICE Based on the results of this study, the following suggestions are offered to support the effective use of mobile technology in learning: 1. Increased faculty training regarding the capabilities of mobile technology and the potential use in the classroom including applications that are available via smartphone stores and textbook companies. 2. Updates to the university website and learning management system that allow them to be viewed in a mobile format. 3. Resource page on the university website with recommendations for mobile applications that may be applicable to students and faculty. 4. Increased dialogue among students and faculty, faculty and faculty, and faculty and administrators about the learning opportunities available through mobile devices. 5. Formation of a partnership with a mobile network that reduces the cost of a device and/or data plan for students and faculty. 5. Collaboration between the university and either the computer science department or an outside resource that could develop course-specific mobile applications that could be used for general education courses. 5.8. SUGGESTION FOR FURHER RESEARCHES This study helped to identify the current issues and contribution of mobile learning in university faculty and students to determine if students and faculty would incorporate the use of mobile devices in the classroom in order to increase quality of education through recent trends in this field. The study was limiting insomuch as it only investigated students and faculty at one university. Future research may want to include multiple institutions and examine differences based on region, available resources, and faculty technology training. However future research with undergraduates may also be problematic due to the number of students who change majors from freshman to senior year. Using an upper-class sample may be able to indicate a more accurate relationship between perception and school affiliation. Future researchers may also want to further investigate factors that affect student and faculty attitudes and perceptions. 5.9. CONCLUSIONS The study on mobile learning contribution on college student's assignment with faculty support has been conducted with a sample of two hundred individuals. They have been composed by teachers and students of on institution; according to the findings the use of mobile devices in field of education continuously is being implemented. However, the technical and pedagogical support is needed for both teachers and students so as to get important output. Besides, based on gender, students' majors, students' performance, teachers' qualification... The implementation of mobile device as explained in educational technology, has an observable contribution because that material could be used at anytime and anyplace to handle educational task. BIBLIOGRAPHY · Ally 2009, Mohamed.: Mobile Learning. Transforming the Delivery of Education and Training. Published by AU Press, Athabasca University. ISBN 978-1-897425-43-5. (2009). · Anuj Kumar et al. 2010. Unsupervised Mobile Learning in Rural India, Utter Pradesh. · Bednorz and Schuster 2002, "User Acceptance of Information Technology: Toward a Unified View." MIS Quarterly 27, no. 3 (2003): 425-478 · Best 1977, Toward a Hierarchical Model of Intrinsic and Extrinsic Motivation." InAdvances in Experimental Social Psychology Edited by M.P. Zanna, 271-360. New York: Academic Press. · Ben Feigin, 2001. Mobile application development: «The search for common ground in a divided Market» · Bill Peirce, 2004, A Strategy for Getting Students to Do Their Homework, Hand book of Critical Thinking Resources, 301 Largo Road Largo, Maryland 20774 · Borg and Gall. 1965, Educational research: An introduction, Longman, New York. A study of organizational commitment of teachers working in higher in Sirkali taluk · Chauhan, S. S. 2001 «Advanced Educational Psychology» Vikas publicity House Pvt.Ltd. · Gokila, G. (2014). Professional commitment of teachers in secondary schools in relation to their job satisfaction, dissertation, Prist University, India · Hill 2002, Telecommunications and Economic Growth,» Washington, D.C.: World Bank, unpublished paper · Jennifer L. Romack, 2010. Enhancing Students'Readiness to Learn, Magna Publications, Inc. 2718 Dryden Drive Madison, Wisconsin 53704 USA. · Katz, J., and M. Aakhus, eds. 2002. Perpetual contact: Mobile communications, private talk, public performance. Cambridge, UK: Cambridge University Press. · Kerres 2006, Re-assessing Practice: visual art, visually impaired people and the Web. London: Tate Modern Art Gallery · Lewin-Benham 2008. The use of Mobile Learning by Homeless Learners in the UK. Proceedings of IADIS International Conference Mobile Learning. Lisbon:IADIS · Mangal S. K. 2000, «An Introduction to Psychology. Prakash Brothers, Ludhiana · Maryellen Weimer 2010, Getting Students to Read, Magna Publications, Inc. 2718 Dryden Drive Madison, Wisconsin 53704 USA. · Mathur, S. S. 1996, Educational Psychology. Vinod Pustak Mandir, Agra. · Maryellen Weimer, 2010, Still More on Developing Reading Skills, Magna Publications, Inc. 2718 Dryden Drive Madison, Wisconsin 53704 USA. · Megan K. Foti, Jomayra Mendez, 2014, In their study on Mobile Learning: How Students Use Mobile Devices to Support Learning, Journal of Literacy and Technology Volume 15, Number 3: December 2014 ISSN: 1535-0975, USA. · Merriam 1988, A Theoretical Extension of the Technology Acceptance Model: Four Longitudinal Field Studies." Management Science 46, no. 2 (February 1988): 188. · Mohamed Ally, 2009. Mobile Learning Transforming the Delivery of Education and Training, AU Press, Athabasca University 1200, 10011 - 109 Street Edmonton, AB T5J 3S8, Canada · Oladele, J. O. 1998, Fundamentals of Educational Psychology. Yaba: Johns-Lad Publishers Ltd. · Onyehalu, A.S 1988, Psychological Foundations of Education. Awka: Meks-Unique (Nig.) Publishers. · Paul W. and Williams 2009, Assessing Mobile Learning Effectiveness and Acceptance, dissertation, George Washington University, USA. · Sanjay Rajpal, et al. 2008. E-Learning Revolution: Status of Educational Programs in India · Siemens and Tittenberger 2009, Mobile technologies and learning - A technology update and m-learning summary. London: Technology Enhanced Learning Research Centre, Learning and Skills Development Agency · Saeed Zare 2010, Intelligent Mobile Learning Interaction System (IMLIS) A Personalized Learning System for People with Mental Disabilities, Bremen university, · Traxler and Kukulska-Hulme 2005. Mobile learning: A handbook for educators and trainers. London: Routledge · Tracey E. Ryan, 2010, What Textbook Reading Teaches Students, Magna Publications, Inc. 2718 Dryden Drive Madison, Wisconsin 53704 USA. · Tiffany F. Culver and Linda W. Morse, 2010, Helping Students Use Their Textbooks More Effectively, Magna Publications, Inc. 2718 Dryden Drive Madison, Wisconsin 53704 USA. · Yousuf M Islam, Md. Shafiqul Alam, 2008, Virtual Interactive Classroom (VIC) using Mobile Technology at the Bangladesh Open University, Bangladesh. Website retrieved for literature review Ø http://cmer.cis.uoguelph.ca retrieved on 25/04/2016 Ø https://en.wikipedia.org/wiki/Future_Shock retrieved on 29/4/2016 Ø https://en.wikipedia.org/wiki/Educational_technology retrieved on 29/4/2016 Ø http://www.TeachersMind.com retrieved on 29/4/2016 Ø www.yahoo.com. retrieved on 29/4/2016 Ø Best and Kakn. 1975, University Business. "Education as Equalizer." http://www.universitybusiness.com/ViewArticle.aspx?articleid=217 (accessed April, 2016). Ø http://www.mlearn.org/mlearn2002/ European workshop
on Ø http://www.mlearn.org/mlearn2003/indexa2ce.html?section=1 Ø http://www.ics.ltsn.ac.uk/events). Pedagogy V Technology - Striking the right balance in Computer Science Education, Thursday 15th June at the University of Wolverhampton. Ø Kandel 2007. Reflective learning for the net generation student. The Higher Education Academy: Medicine, Dentistry and Veterinary Medicine. Available: http://www.ireflect.leeds.ac.uk/Portals/10/sandars_proof.pdf Ø Fintan Costello et al. 2009, Mobile Learning: A Practical Guide, ( http://www.nettskolen.com/forskning/ m_Learning_2000_2005.pdf) Ø Frescha et al. 2004. mLearning: Doing the Unthinkable and Reaching the Unreachable http://learning.ericsson.net/mlearning2/files/conference/keynote.pdf 2005 Ø Marley 1970, U.S. And World Population Clocks - Popclocks." http://www.census.gov/main/www/popclock.html (accessed April, 2016). YOU TUBE VIDEO TUTORIAL LINKS ON MOBILE LEARNING 1. https://www.youtube.com/watch?v=sSPA641oc5Q Mobile Learning at ACU: Full Presentation 2. https://www.youtube.com/watch?v=AQgCXEoTap4 |
| ||||||||||||||||||||||||||||||||||||||||||||||||||||||||||||||||||||||||||||||||||||||||||||||||||||||||||||||||||||||||||||||||||||||||||||||||||||||||||||||||||||||||||||||||||||||||||||||||||||||||||||||||||||||||||||||||||||||||||||||||||||||||||||||||||||||||||||||||||||||||||||||||||||||||||||||||||||||||||||||||||||||||||||||||||||||||||||||||||||||||||||||||||||||||||||||||||||||||||||||||||||||||||||||||||||||||||||||||||||||||||||||||||||||||||||||||||||||||||||||||||||||||||||||||||||||||||||||||||||||||||||||||||||||||||||||||||||||||||||||||||||||||||||||


 Standard deviations of each group