|
qwertyuio pas dfghj klzxcvbnmqwertyui

opazxcvbnmqwertyuiopasdfghj
klzxwertyuiopasdfghjklzxcvbn
mqwpasFdfghjklzxcvbnmqwert
yuiopasd fghj kl zxcvbn m qwertyui opasdf
|
ghjk
bnm
|
Stock Market Success For Beginners
bnmqwertyuiopasdfgzxcv
wer
g
Maksim Pecherskiy
|
|
tyui
|
ocbpasd
Stéphan Laouadi
|
|
fghjk
|
wertyu
Bachelor Thesis
Spring semester 2008
Atlantis Program
|
zxcv
|
Linköping University: Business Administration
bnm pasdfghjklqwer
ISRN: LIU-IEI-FIL-G--08/00246--SE
Tutor: Dr. Emeric
Solymossy
tyuiopasdfghjklzxcvbnmqwerty uiopasd
fghj klzxcvbnmqwertyuiopasdfghj klzxcv
bnmqwertyuiopasdfghjklzxcvbnmqwer
tyuiopasdfghj klzxcvbnmrtyuiopasdfghj
klzxcvbnmqwertyuiopasdfghj klzxcvbn
mqwertyuiopasdfghjklzxcvbnmqwerty
Abstract
Bachelor thesis in Business Administration, Linköping
University
Spring sem ester 2008
Authors: Maksim Pecherskiy and Stéphan Laouadi Tutor: Dr.
Emeric Solymossy
|
Title
|
Stock Market Success For Beginners
|
|
Key words
|
Investing; Stocks; Stock Exchanges; Funda mental analysis.
|
|
Background and Problem discussion
|
The finance world is complicated and can be very intimidating
to someone who knows nothing about it. This paper provides knowledge in a
simple way for anyone who wants to enter this world by purchasing shares of
stock. It provides general market knowledge and after looking at successful
strategies of the greatest investors it proposes a strategy for investing in
the stock market.
|
|
Purpose
|
The purpose of this paper is to see what worked for the best,
and what worked historically, combine the data and come up with a strategy that
may not work 100% of the time, but overall provides a positive return.
|
|
Methodology
|
This paper is based on internal and external secondary
sources. We have used the inductive approach and most our data is
qualitative.
|
|
Theories
|
Our theories are based on security analysis and mostly on
Fundamental analysis.
|
|
Empirical Data
|
Our empirical data consists of strategies used by successful
investors: Benjamin Graham, Philip Fisher and Warren Buffett. As well as
internal reports from S&P and Reuters.
|
|
Conclusion
|
Our proposed strategy advocates investing in undervalued growth
stocks with strong fundamentals for the long run.
|
Acknowledgements
We would like to thank Dr. Emeric Solymossy for his great
ideas and helping us structure our ideas, Stefan's mom for the French wine and
cheese to help us relax during our work, Charlotte Parkinson for providing us
with some ideas using her knowledge of economics, Cecile Lauroa for letting us
borrow the Methodology Book, Benji Greenberg for looking over our paper and
providing his input based on his knowledge, and to Max's DePaul Professor Eric
Greenberg for getting him interested in the topic and teaching him
accounting.
Table of content
Abstract ii
A cknowledgements iii
Table of content a
Introduction 1
Background 1
Purpose 1
Problem Statement 2
Research Methodology 3
Nature of the Problem 3
Exploratory Research 3
Frame Of Reference 4
Data Collection 4
Analysis of Data 4
About the market 5
What is a stock? 5
Why, How and Where does A Company Sell Stock? 8
Investing 13
Market Philosophies 15
Evaluating Potential Investments 18
Growth Vs Value 18
Fundamental Vs Technical Analysis 21
Finding Information 55
Companies Themselves 55
Financial Publications 56
Internet 59
Other Medias 62
Personal experience 63
Successful strategies 64
Benjamin Graham 64
Philip Fisher 67
Warren Buffett 71
Proposed strategy 80
Introduction 80
Finding Stocks 82
Evaluating companies behind stocks 84
Other advices 91
Example 93
Bibliography 100
Appendix 104
S&P reports on Hansen Natural 104
Reuters report on Hansen Natural 110
Introduction
Background
Tony is currently a student at De Paul University. He is a
third year student who is working toward his major in Information Assurance and
Security Engineering, an information technology bachelor degree. He has been
saving up his money for the past several years from working for several
security companies because he has a lot of security knowledge and it's in
demand. He has about $10,000 saved up and feels that he can do better things
with it than keeping it in his Etrade account and getting only 5.05% annual
return. He was thinking about investing in bonds, but he realized that he would
barely be beating inflation using that approach. So he was wondering how to get
started investing in stocks. He does not really have any knowledge of the stock
market other than what he watches on the news about the S&P 500 and the
Dow. He knows that S&P 500 tracks the 500 companies that represent the
stock market, while the Dow tracks the top companies in the market. When he
tried researching about how to invest, he was bombarded with a myriad of
information that was dispersed all over the place and that he could not
understand. This paper is for him.
Purpose
This paper is written with the beginning investor in mind. The
current economic downturn has numerous banks and financial institutions in
trouble and they are unable to provide decent rates of return on money that
people put in the savings accounts of these institutions. The Fed has decreased
the rate of return on Federal Savings Bonds and they barely beat the rate of
inflation. But does the person that has no knowledge of finance or the stock
market really stand no chance of profiting and getting returns that are better
than the average 3% annually offered in an average savings account? Is the only
way to profit in the stock market through sheer luck like gambling in a Las
Vegas casino? Or is there a way to make informed buying and selling decisions
that can provide a great return for the risk the investor chooses to take? Is
it possible to take publicly available information and analyze it to make
informed and confident stock valuations and purchases? And is it possible to
follow in the strategies of investing of the great gurus like Buffet and make a
profit? If so, is the only way to do it by reading hundreds of boring 1000 page
books that an accountant would not understand, much less Tony, the average
no-knowledge investor?
This paper provides a way for Tony to understand the stock
market but only to the point of getting him off on the right track in
investing. We try to suggest what works and what doesn't and try to take the
best from some of the greatest investing gurus. We try to set him on a path to
a strategy that will keep him out of trouble in the stock market while
providing a decent return. Of course, we can't guarantee that, because the only
thing sure about the market is that it will fluctuate. However, we can see what
worked for the best, and what worked historically, combine the data and come up
with a strategy that may not work 100% of the time, but overall provides a
positive return. That is the purpose of this paper.
Problem Statement
By writing this paper we try to answer the two main questions
that have driven us to pick this topic. We know that there is more than one way
to make money in stocks and in the market in general. However, what we focus on
in this thesis is how to make money by finding, buying, and holding stocks of
good, solid companies, and how to obtain the most return for the risk taken.
Therefore, or main problems are:
· How does the beginning investor make money through
capital appreciation of stocks of companies on major stock exchanges?
· How does the beginning investor obtain the most return
for the risk that he or she undertakes while investing?
Research Methodology
Nature of the Pro blem
Originally, we were interested in doing something with the
stock market and the finance sector in general. Since we had a level of
knowledge in economics and finance, and because of the general economic
condition of the United States, we first decided to look at the relationship
between stock market fluctuations and the economy. However, we quickly found
that issue to be outside our scope of knowledge, and decided to look into the
causes of market fluctuation. This led us to contemplate the reasons behind the
fluctuation of stocks in general, posing a question of what makes price go up
or down every single day. Naturally, we became interested on how people make
money in the stock market. We began to research, and got bombarded with an
overwhelming supply of information, very few of it providing us with a clear
picture of the world of investing. We needed to narrow down our audience to see
at what level we would be writing this paper. Eventually, we decided to write
this paper to Tony, mentioned in the background, who is a beginning investor
and knows nothing about the market or stocks. We decided to keep one question
in mind above everything else. How does one make money in stocks? We started
looking at some of the world's greatest investors such as Buffett and Graham.
Eventually, after further refinement and research, we came up with our problem
statement. Based on the insights from some of the most successful investors,
how does one understand the market, and find and research successful stocks
which provide a decent rate of return compared to the amount of risk the
investor can afford?
Exploratory Research
After contemplating our problem, we came to understanding
that the nature of it is unstructured. The reason we came to this conclusion is
because the problem seemed to be not well understood. It's obvious that the
stock market and all the stocks on it fluctuate on a daily, even a minute
basis. However, what causes them to fluctuate, and more specifically what
causes some investments to double or triple in value while others fail
miserably, seemed to be a mystery. Furthermore, we wanted to look at how people
that have successfully beaten the market over the years were able to know which
stocks would succeed and which would fail. Knowing that the solution would not
be simple, and the answers could be numerous, we knew we had to look at several
sources and several ways of investing to come to our conclusions. We also knew
that the direction of our research could change based on our findings.
Therefore, we chose to utilize the Exploratory Research methodology. By
examining and analyzing strategies of successful investors as well
understanding how to find a great company that stands behind the stock symbol
by using ratios and fundamental valuations, we hope to arrive at our proposed
strategy.
Frame Of Reference
We know nothing of stock valuation or market fluctuations. We
do understand however that the people who have successfully beaten the market
over a long period of time have had a system for doing so that worked. We hope
to provide a theoretical strategy based on our observations and the
recommendations of the world's greatest investors as well as valuation books
that will try to beat the market. We do understand and assert that this
strategy would be theoretical and only a conclusion of our research and
deductions. In addition, we do understand that the market can be irrational and
unpredictable and that this strategy will not guarantee a positive return
percentage all the time. However, we do believe that by picking companies with
solid fundamentals and holding them for long periods of time will provide a
great way to earn a good amount of return in the stock market.
Data Collection
Since we are using the exploratory model, most of our data
comes from secondary sources. We have used several internal and external
sources. External sources used for this paper include books and articles, while
internal sources consist of stock research reports from the Standard and Poor
Corporation as well as Reuters Research Reports.
At first we were building from our existing knowledge of
finance, however that turned out to be insufficient. In order to find more
information, we turned to libraries, such as the LIU library and the DePaul
University library. We have been able to obtain several books that described
the investing style of some great investors as well as several books on
analysis of different securities. We used these to build our knowledge of
valuation formulas, as well as to provide information about the strategies of
the great investors. We have also turned to the internet for sources. There are
several investing websites which were especially helpful for explaining
different ratios and what they mean and how they should be looked at.
For explaining core earnings, we looked at primary sources
from Standard and Poor's in a document describing the reason for creating these
measurements. In order to collect our primary data, we have also used S&P
reports to collect different ratios and key fundamentals. We have used the
inductive way of collecting data. We have first observed and researched,
looking at some major ways of investing that exist, then took general
conclusions from our research and created our theory.
Analysis of Data
In analyzing data, we have tried to concentrate on what are
the similarities between the investing styles of the great investors that we
have researched. We have also looked at internal documents from the S&P for
an explanation of core earnings in order to understand their importance and
implementation. For evaluation by formulas, we have tried to pick the most
important formulas and to try to organize them first by the financial
statement, and then, in our strategy by importance so that the investor who has
less time on their hands will be able to skip the highly detailed and in depth
valuations that our strategy proposes. From the information we have gathered,
we have taken the main points and provided them in this paper. We have tried to
limit the formulas that we use to only the most important ones and ones
essential for analyzing companies' performance. For the investors, we took out
their main philosophy and investing strategy and summarized them here. We have
departed from data, and using the qualitative information we have gathered and
analyzed, we have created a theory.
About the market
What is a stock?
A company's operations are financed in one of two ways. The
first way is by loans from major lending institutions such as banks and credit
agencies or though sales of bonds. The other way for a company to raise money
to fund its operations is through sales shares of stock or equity. Shareholders
are essentially owners of small pieces of the company, because that's what a
share of stock is. Therefore, the management of the company is responsible to
the shareholders, because they are essentially owners of the company that they
are managing.
Why Invest in Stocks?
So why invest in stocks? They are volatile, risky, and the
investor could lose if the market crashes. The answer is actually quite simple.
Stocks allow the investor to own successful companies, and stocks tend to be
the best investments over time. And, if the investor is not a speculator and
does his or her due diligence and research, stocks can really pay off.
Table 1 below shows the average total return of stocks measured
by the S&P 500 Index and AAA Corporate Bonds shown by Moody's Seasoned AAA
Corporate Bond Yield Index over five decades.
Table 1- Percentage Return
PERCENTAGE RETURNS
|
|
STOCKS
|
BONDS
|
|
Per Year*
|
Total
|
The 1950s
|
486.5%
|
19.4%
|
11.3%
|
The 1960s
|
112.1%
|
7.8%
|
19.2%
|
The 1970s
|
76.8%
|
5.9%
|
81.7%
|
The 1980s
|
398.1%
|
17.4%
|
238.3%
|
The 1990s
|
432.3%
|
18.2%
|
131.9%
|
* Compounded
|
|
Compiled Using Data from FRED and Yahoo Finance
It's easy to see that every 10 year period, stocks have
outperformed bonds, and by quite a lot. Even during the 1980s when one of the
great recessions happened and the 1990s when the dot com bubble burst, stocks
on average seemed to provide a way better return than bonds.
Types of Shares
However, not all shares of stock are created equal. There are
two types of stock offered by the company in order to finance its operations.
Even though most beginners will deal with common stock, it is necessary to
understand both types:
Preferred Stock
The first type of stock is preferred stock. If the company
goes bankrupt and after all the creditors get paid off, the holders of
preferred shares get first claim on whatever is left over, followed by the
holders of common stock. Preferred stockholders usually get paid dividends, and
if there's still money left over after paying dividends to the preferred
stockholders, the corporation will issue a dividend to pay the common
stockholders. Furthermore, preferred stock shares usually do not have voting
rights.
The exact definition and rights of preferred stock vary from
company to company, but the best way to think of this of preferred stock is a
financial instrument that is similar to a bond (fixed dividends) and equity
(stock price appreciation).
Common Stock
The stock that is most often traded on the markets is common
stock. Corporations usually issue a lot more shares of common stock than they
do preferred. Holders of these shares maintain control of the company through a
board of directors, and have voting rights on corporate policy. However, they
are on the bottom of the list if the company goes bankrupt and gets liquidated,
right after the creditors, bondholders and preferred stockholders. However,
common shares most often outperform preferred shares in the long run.
Making money in stocks
So how can stocks return gains on the money Tony invests in
them? There are several ways:
Capital Appreciation
The first is capital appreciation, or when the price of the
stock goes up. Therefore, the capital that Tony has invested into the security
has increased in value, because the value of his shares has increased. The
capital appreciations part of the investment includes all of the market value
exceeding the original investment or cost basis.
Dividend
The other way to make money is by holding stocks that pay
dividends. Dividends are a distribution of a portion of a company's earnings to
a class of its shareholders. The distribution of dividends and how much is
decided by the company's board of directors. It's most often quoted in the
terms of the dollar amount per share such as $.50 per share. For example, if
Tony is the owner of 10 shares of Disney, and they decide to issue a dividend
of $.50 a share, he will receive a total dividend of $5 for the shares that he
is holding. Not all companies pay dividends, but generally the well
established, slow growth companies. High growth companies usually reinvest
their dividends in order to maintain high levels of growth and don't pay out
their investors.
Declaration Date
This is the date on which the next dividend payment is announced
by the board of directors. This announcement will include the dividend size,
ex-dividend date and payment date. Once this announcement has been made, the
dividend becomes a declared dividend and it is now the company's legal
liability to pay it. Ex-Dividend Date
This is the date on which the security becomes traded without
a previously declared dividend. After this date, the seller, and not the buyer
of the stock will be entitled to the announced dividend. It is usually two
business days before the record date.
Record Date
This is the date on which the shareholder must be holding the
security in order to receive the declared dividend. On this date, the company
records who the holders on record are and makes sure that they receive the
dividend. Even if the shareholder sells the stock after this date, he or she
will still receive the dividend. Payment Date
This is the date on which the dividend payment is finally
made. Only the shareholder who bought the stock before the ex-dividend date and
were still holding it during the record date will receive the dividend
distribution.
Extra dividends
These are a non-recurring distribution of the assets of a
company, determined by the board of directors to shareholders. These are
unusually large in size and are not on the usual payout date. These dividends
are often declared following strong earnings results as a way for a company to
distribute the really good profits of the fiscal cycle to the shareholders.
Stock Splits
A stock split is a corporate action where existing shares are
divided into two or more shares. Even though the number of shares increases,
the value of each share decreases proportionally. This is in order to keep the
company's market capitalization (explained further) the same, since no real
value has been added because of the split. For example if Google is currently
trading at $580 a share, and has 33.74 Million shares outstanding. The company
decides to do a 2:1 split. The stock price becomes $290 a share and they now
have 67.48 Million shares outstanding. In each case, 290 * 67.48Million and
580*33.74 million provides the same number for market capitalization. In
addition, if an investor is the owner of 100 shares before the stock split, he
or she is the owner of 200 shares after. Companies may do this in order to
decrease their per share price so that different kinds of investors would
invest in it. For example, since Tony only has $10000 to invest, he can only
buy 16 shares of Google, and if the stock goes up by $100, he will only make
$1600. However, if he buys after a 2:1 split for Google, he can buy 32 shares,
and if those shares increase by $100 a share, he or she will make $3200.
Therefore, in order to attract smaller investors, companies may want to perform
a stock split.
Stock splits also go the other way. A company can also reduce
the number of shares trading on the market by doing a reverse stock split. This
can be done to increase the company's Earnings per share, even though nothing
has really changed. It's usually a bad sign if the company has to reverse stock
split as they may do so to make their shares look more valuable or even to
avoid being delisted.
Why, How and Where does A Company Sell Stock?
Selling stock to rais e money
In order to raise money to fund its operations, a company has
two main choices. The first choice is debt. This involves going to a bank or
lending institution and borrowing money at a certain percentage and pay it back
over a certain period of time. Another choice is to go into debt by issuing
bonds where the company pays the bondholders back at a certain percentage for a
certain amount of time. The other option is to finance its operations by
selling shares to investors. A share is essentially a part of the company, and
therefore entitles the shareholders to a certain percentage of the company's
profits.
In order to go public, a company has to go through an
investment bank and make an IPO or an initial public offering to the primary
stock market. Afterwards, these shares go to a secondary market such as NYSE or
Nasdaq. This allows the company to sell shares to millions of investors
therefore using their capital to fund its operations.
Primary market
The primary market is where new issues of stock are first
offered. Companies, governments, and other entities obtain money by either debt
or equity securities. The primary markets are facilitated by underwriting
groups which usually consist of investment banks. They will set a beginning
price range for a given security and then oversee the sale directly to
investors. The issuing company receives cash proceeds from the sale which are
used to fund operations and fuel growth. Once the initial sale is complete the
security begins to trade on the secondary market.
Secondary market
The market that is on the news every day is the secondary
market where shares are traded between different investors and institutions.
Before, the secondary market used to be a large trading floor with different
investors yelling out orders to buy and sell. However today, thanks to
computers, all the trades are done almost real time by computerized systems and
the floor now only exists in virtual reality. The main markets that show up on
the news every day are NYSE which the New York Stock Exchange, AMEX and NASDAQ.
One of the largest difference between primary and secondary markets is that in
the primary market, the prices are set beforehand, while in the secondary
market, the prices are only determined by market forces such as supply and
demand.
All those symbols streaming during CNN Financial news are
called ticker symbols, and each corporation's stock has one. It's an
arrangement of characters which are usually letters to represent a security
that's being publicly traded on an exchange. When a company becomes publicly
traded, it gets to pick a ticker symbol for its stock. It's useful to know that
stocks trading on the NYSE usually have three symbols, and Nasdaq stocks have
four letter symbols.
Types of secondary markets
Centralized markets
A centralized market consists of a market structure where all
orders are routed to a central exchange such as a trading floor. The quoted
prices of different securities trading on the market show the only price that's
available for the security available to investors. NYSE is considered to be a
centralized market.
Over the counter markets
An over the counter market or OTC market is a network of
brokers and dealers with no centralized exchange. Usually stocks will trade on
such an exchange because they do not meet the listing requirements of other
exchanges. Even though Nasdaq operates as a network of dealers communicating by
computer systems, it is a very large stock exchange with listing requirements
and is therefore not referred to as an OTC Market.
Exchanges
Exchanges are marketplaces where securities and other
financial instruments are traded. The main function of an exchange is to
coordinate fair and orderly trading as well as to provide information about the
price of those securities to investors in an efficient manner. An exchange can
be considered a platform where investors trade securities with one another and
where economic concepts such as supply and demand are clearly exemplified.
Exchanges do not have to be a public trading floor, but could exist in a
virtual world where all the trading is coordinated by computers. Many famous
exchanges are located around the globe such as NYSE in New York, Tokyo Stock
Exchange in Tokyo, and NASDAQ which is an exchange fully run on computer
systems.
In order to be listed on a specific exchange, a company must
meet certain requirements such as regular financial reports and a certain
amount of market capitalization.
NYSE
The New York Stock Exchange or the «Big Board» is
considered to be the largest exchange of equities in the world judging by the
total market capitalization of the securities that are listed on it. Even
though it used to be a private organization, it became a public entity in 2005.
Its parent company is called NYSE Euronext after it acquired the European
Exchange in 2007.
At first, NYSE relied only on the floor trading system,
having all the trades yelled by investors and then executed. Today however,
more than half of all the transactions that happen on this exchange are
conducted by electronic means, and floor trading is used for only high volume
institutional trading.
The beginnings of the NYSE go back to 1792. Because of its
long history and high reputation, some of the most prominent and well known
companies of the world are listed on it. Foreign corporations can list on it as
well as long as they adhere to specific SEC rules known as listing
standards.
NYSE opens for trading Monday through Friday 9:30 AM to 4:00 PM
Eastern Time. It also shuts down for nine holidays out of the
year.1
1
Investopedia.com
Nasdaq
NASDAQ or National Association of Securities Dealers
Automated Quotation is a computerized exchange that provides the ability to
trade for more than 5000 actively traded over the counter stocks. This exchange
is only a few decades old, dating back to 1971 when it became the world's fist
electronic stock market. While stocks listed on the NYSE are comprised of three
letters generally, the stocks on NASDAQ tend to be listed in four or five
letter symbols. However, if the stock is a transfer from the NYSE, then it
could have a three letter symbol while trading on NASDAQ.2 Usually,
stocks on Nasdaq tend to be high tech and carry a little bit more risk than
those on NYSE. It's home to tech giants such as Microsoft, Intel, and Cisco.
AMEX
AMEX is the third largest exchange in the United States and
has now merged with Nasdaq. It is located in New York City and now handles
roughly 10% of all securities traded in the US3. Before Nasdaq, it
used to be a strong competitor to NYSE, but now it carries a lot of small cap
stocks, and ETFs.
2
Investopedia.com
3 IBID
The Market
What is commonly referred to as the market is where shares
are traded and is more specifically the equity market. It is one of the most
vital areas of the market economy since it provides companies with access to
capital to finance their operations and it lets investors own a piece of the
companies and therefore realize potential gains based on the company's future
performance.
Indexes
An index is best understood as a statistical measure of
change in economy or a securities market. In the case of the financial markets,
an index acts like a portfolio with securities that represent a particular
portion of the market. The index is usually expressed as a change from a base
value in percentages.
Since investors cannot directly invest in a whole index, and
the only way to do that is by individually selecting stocks in the index and
adjusting them accordingly, index mutual funds and index-based ETFs (See Below)
allow investors to buy securities that represent the broad market segments. It
is important to remember that the index does not reflect the individual stocks,
but rather acts as a barometer for market sentiment. Stocks change in price due
to many different factors, and stocks will not necessarily stop going up in a
bear market.
Main Indexes
Dow Jones
The Dow Jones Industrial Average, also known as the DOW, is a
price-weighted selection and average of 30 significant stocks traded on Nasdaq
and NYSE that are thought to represent the market as a whole. Also known as the
DJIA, this is what is used to gauge whether the market has gone up or down and
where it is headed. It is the oldest and most watched index in the world. A
concept that is important to understand is the Dow Theory that states that
prices tend to move with positive correlation to each other. This is a very
detailed theory and is well out of scope of this paper; however, it is worth
summarizing. Under this theory, if the Dow Jones Industrial Average moves in a
certain direction, it's not an indication of a trend. However, if the DJIA and
the Dow Jones Transportation Average move in the same direction, it could
indicate an emerging trend. It is what technicians use to gauge market
sentiment and movement.
Nasdaq 100
The Nasdaq 100 is composed of 100 largest and most actively
traded companies on Nasdaq. While it includes many different industries, it
generally does not include financial institutions since those usually trade on
NYSE.
S&P 500
The Standard and Poor's 500 index is comprised of 500 stocks
chosen for their market size, liquidity and industry grouping as well as
several other factors. It is designed to be an indicator of US equities. It is
one of the most commonly used benchmarks to gauge the US market. Since it
contains so many companies and in so many broad ranges, many people consider it
to be the definition of the market.
Exchange Traded Funds
ETFs or Exchange Traded Funds are securities traded on the
stock exchange with a specific symbol just like any other company. However,
ETFs track an index or a commodity, or several assets like an index fund. By
owning an ETF, an investor can use the diversification of an index fund, as
well as the ability to sell short, or leverage a specific index fund. For
example, one of the best known ETFs is SPDR (Spider) which tracks the S&P
500 and trades under the sym bol SPY.
Market Sentiment
It's in the news all the time. «This bear market
this» or «This bull market that.» These metaphors came from the
different way the animals use to attack their opponents. The bull swipes his
horns up when attacking, while the bear swipes his paws down. They describe
current market sentiment and how investors feel about putting money in the
market in general. The two main descriptions are «Bear Market» and
«Bull Market.»
Bear Market
A bear market is a market condition in which the prices of
the securities on average are falling or are expected to fall. Usually, a
downturn of 15 - 20% in different indexes is considered the beginning of a bear
market. Usually, investors are pessimistic or scared, and are pulling their
money out of the market causing stock prices to fall.
Bull Market
It's the exact opposite of the bear market. Whereas in the
bear market the prices of securities are falling, the prices of securities in a
bull market are on the rise. Also generally defined as a climb of 15-20% in
different indexes is the beginning of a bull market.4 Usually
investors in such a market are optimistic, investor confidence is up, and so
are stock prices.
4
Investopedia.com
Investing
In order to invest in the market, an individual needs to go
through a broker who will charge a fee or commission for execution of trades
ordered by its clients. Whereas before, only the wealthy could afford a broker
and therefore access the stock market, the birth of the internet allowed for
the subsequent birth of discount brokers on the internet. These brokers allow
investors to trade at a lower cost, but they don't provide investors with
personalized advice. Many brokers will charge under $10 per trade and some will
go even lower. Thanks to discount brokers, almost anyone can trade in the stock
market.
Brokers
Brokers come in two different flavors. The first kind is the
full service brokerage firm. These are the largest and most known brokers in
the country and they spend millions of dollars a year on advertising to make
sure of that. The problem with these brokerages is that they are expensive and
they are biased. Such large firms usually have an investment banking division
that helps companies make IPOs. It's not hard to see that it may pose a
conflict of interest when the other part of the company is dedicated to
advising people on what to invest in. Therefore, they may guide the investor to
buy shares of a company that they put to market just to keep a good banking
relationship with that company. Furthermore, they are very expensive with fees
upwards of a $100 per trade. A trade may cost a lot of money and their advice
is usually misleading.
The second kind of brokerage firm, and the most appealing one
to use, is the discount brokerage firm. They do not have investment banking
divisions, but even if they did it would not matter anyways because they don't
give their investors any advice. They provide a trading platform to stay
competitive and may help the investor by giving them reports from third
parties, but the only reason they really exist (in the mind of the investor) is
to execute his or her orders to buy or sell. Here, a trade may cost around $7
to $10, so it's more affordable. In addition, they make commission the same no
matter what stock gets traded, so they are not interested in giving the
investor any recommendations.
Types of orders
In order to invest intelligently and successfully, the
investor needs to put all the tools available to him or her to use. Different
orders that the brokerage performs are some of those tools and are instrumental
in executing trades under specific conditions.
Market Orders
When a market order is placed, it is an order to purchase
shares of stock immediately at the next available current price. It guarantees
execution, and also carries with it a lower commission, because all the broker
has to do is buy or sell. However, placing a market order with a stock that has
low average daily volume can be dangerous. In such a situation, the ask price
can be a lot higher than the bid, causing a larger spread, and therefore making
the shares cost a lot more than originally quoted.
Above the market Orders
An order to buy or sell at a price that's higher than price
the security is currently trading. An example of such an order can be a limit
order to sell, a stop order to buy, or a stop-limit-order to buy. Momentum
traders will often place such traders above the resistance level in the hopes
that once a price breaks through the resistance level, it will continue in an
upward trend.
Below the market Orders
An order to buy or sell the security at a price that's lower
than the current price. An example would be a limit order to buy, a stop order
to sell, or a stop-limit order to sell. This can be used to limit losses by
some investors who will want to sell a security after it has hit a certain low
price point.
Trade execution
Limit Order
An order that instructs the broker to buy or sell a number of
shares at specific price or better. The investor can also limit the length of
time the order can be outstanding before it's no good. These can often cost
more than market orders, but are sometimes worth the higher price if used to
limit losses, or purchase shares at a low price the stock hits for only a few
minutes.
Example: Tony has decided he wants to buy 100 shares of
Coca-Cola but he is willing to pay no more than $30 per share. He sets a Buy
Limit order at $30 for 100 shares. If the price of the stock drops to $30 or
below, the order will become a market order and execute but only a price of $30
or below. If the price never reaches that point, the order will not execute.
Stop Order
An order to buy or sell a security when its price passes a
certain point. This gives the investor a larger probability of hitting an entry
or exit price that he or she wants. Once the price passes that point, the order
becomes a market order. Investors usually use this when they know they will be
unable to monitor their portfolio for a certain period. However, they are not a
guaranteed the transaction will happen at the price the trader wants. If the
stock drops down really quickly or jumps, the investor's stock will be sold or
bought at a very different price than what the investor expected.
Example: Tony has bought a stock for $20 that is now trading
for $70. He wants to sell it at $60, therefore locking in a 200% gain. He
places a stop order to sell at $60. The order will execute at the best price it
can after the price hits $60 or lower.
Stop Limit Order
This order combines the features of a stop order with those
of a limit order. This order will be executed at a specified price or better
after a given stop price has been reached. In other words, once the stop price
has been reached, the order becomes a limit order instead of a market order,
therefore giving greater assurance that the order will be filled at the price
desired by the investor.
However, the downside is that the trade may not be executed
if the stock reaches the stop but does not hit the limit.
Example: Going back to Tony and his stock that he wants to
lock in a 200% gain on. If he places a stop limit order to sell at $60, and the
price hits $60, the order will only execute at a price that is $60 or higher,
unlike the stop order which will execute at any price after the price point has
been hit.
Market Philosophies
Before talking about investing and different strategies that
exist, it is necessary to undertake a certain philosophy about how the market
functions, therefore bringing about some basic assumptions.
The Efficient Market Hypothesis
The efficient market theory was published in the 1970s by
Eugene Fama. It is a theory that states that all share prices at any given time
are the result of all available information. It makes the assumption that
people analyze information in the same way, that they are rational, that all
information is available to everyone at the same time, they react to it
instantaneously, and that there is an infinite number of investors who want to
sell or buy a given stock at any given time.
There are three levels of this academic theory. The first
version is called «Weak Form Efficiency» and asserts that all
information from the past is already included in the current price. This goes
against the tenets of technical analysis, because this says that future price
movements cannot be predicted based on past price fluctuation patterns.
The second version is called «Semi-Strong Form
Efficiency,» and it states information that can only be obtained from
insider trading can benefit investors with an edge in the market.
Finally, the third version is called «Strong Form
Efficiency» and states that all information about a stock is already
reflected in its price, and its impossible to gain an edge through fundamental
or technical analysis. Therefore, it is impossible to «beat» or
outperform the market over the long term.5
This paper's philosophy of the market
This paper will be written on the assumed rejection of this
hypothesis because due to the information that we have read, we do not believe
it to be true. Investors like Warren Buffett and Benjamin Graham have
consistently beaten the market over the long term as well as many others. This
brings to assume that the market is inefficient which leads us to three main
investment methodologies.
· Behavioral Finance
· Investing Based on Technical Analysis
· Investing Based on Fundamental Analysis
Details of Behavioral Finance are out of the scope of this
paper because it deals with psychological aspects and we have no background
with psychology. We do accept that numerous studies have been made that explain
market anomalies based on the lack of investor rationality, and we will use
that fact further in our paper.
5
Investopedia.com
We also believe that investing based on technical factors
carries greater risk than what an average beginning investor may want to
undertake, therefore the details of investing based on technical analysis will
be excluded from the scope of this paper. In addition, the average investor
will not likely have an extensive knowledge of the mathematics and charting
needed to perform technical analysis with a certain range of confidence.
However, we do recognize that certain technical phenomena and combinations of
technical and fundamental factors may help to make rational decisions for
investors and we will discuss those in some details in our valuation and
strategy sections.
We will propose a strategy for investing based on fundamental
factors of companies behind the stock. From our research we have concluded that
people that have managed to successfully beat the market have been able to do
so in this manner. From our research, we firmly believe that by picking
companies with strong fundamentals, it is possible to outperform the market.
This leads us to a further breakdown of the Fundamental Analysis I nvestment
Methodology as follows.
· Income Investing
· Speculation
· Value Investing
· Growth Investing
Income Investing is based on finding companies with good
fundamentals that will pay a good amount of dividends. However, the most an
investor can obtain from dividends on average is about 5-6%, and dividends are
not guaranteed, so if a company is not doing well, they may cancel several
dividend payments. A missed dividend in one quarter can decrease the gains to
around 4%. In addition, the price of the company's stock could fluctuate which
would also affect the income of the investor. Therefore, we believe that the
risk of being invested in the stock market is too great for the small amount of
gains that the investor would receive compared to a savings bond. We recognize
that some investors would prefer this method because of its decreased
volatility compared to other investing methodologies, but we would like to
point out that income investing is out of the scope of this paper.
Speculation is a much more risky strategy than income
investing, as well as any of the other strategies mentioned above. "An
investment operation is one which, upon thorough analysis, promises safety of
principal and a satisfactory return. Operations not meeting these requirements
are speculative."6 We believe that speculation carries more risk
than a beginning investor would like to take on in addition to not having
enough experience to speculate. Therefore, speculation is out of scope of this
paper.
6 Benjamin Graham, Security Analysis(18)
Value investing, described further in this paper involves
finding undervalued companies with good fundamentals and holding onto them for
a long time. Benjamin Graham, considered to be the father of value investing
was successful in the market over the long term as well as several others who
followed this methodology. We will further focus on this methodology in order
to develop our strategy.
Growth Investing, also described further in this paper
focuses on finding companies with reasonable potential for growth in the long
term. Investors such as Philip Fisher used this methodology to become
successful in the market over the long term. We will apply this methodology as
well to the development of our strategy.
To summarize, our strategies and our theories will assume
that:
· The market is inefficient
· All information is not available to everyone at the same
time
· That investors do not react to information
instantaneously,
· That a large percentage of investors are irrational and
emotional because a large percentage of them are human7
· Investors Make Mistakes
· It is possible to outperform the market over the long
term.
· Stocks of companies with strong fundamental factors will
perform well in the long run
7 A certain percentage of investments are performed by computers
who process market information and react to it instantaneously based on pre-set
guidelines.
Evaluating Potential Investments
Evaluating a potential investment can be a daunting task for
a beginning investor. There are different styles of investing such as growth
and value investing. Furthermore, analyzing investments themselves can be done
through technical or fundamental analysis. In addition, there are many ratios
that can be looked at and compared in order to make educated decisions about
whether the company the investor is buying will go up in price and is a
profitable investment over time. This chapter will provide a sort of
«investor's toolkit» for evaluating investments.
Growth Vs Value
In order to fully explain stock classification to the
beginning investor, it is necessary to clarify the main strategies that traders
use to succeed in the market. These strategies are not set in stone, but are
rather guidelines and philosophies used by different investors. Even though
this section will not go into full detail on stock picking strategies, it is
necessary to introduce them in order for the reader to understand different
valuation principles.
Value Investing
Value investing is perhaps one of the most widely known
methods to pick stocks. When a person who is new to investing thinks about
trading stocks, value investing undoubtedly comes to mind. The strategy was
formalized by Benjamin Graham in the 1930s in his books Security
Analysis and The Intelligent Investor. Some of the better known
value investors include Warren Buffet and Benjamin Graham.
The main premise of value investing is the rejection of the
Efficient Market Hypothesis. 8 After all, if the market always
assigns the correct value to stocks, it is impossible to ever buy stocks that
are undervalued. Rather, value investors follow the mindset of Benjamin Graham
who believes that the market is irrational and will not always price a
company's stock correctly, but will often undervalue it or overvalue it. In
fact, one of his most popular followers, Warren Buffet said, «In the short
run the market is a popularity contest. In the long run, it is a weighing
machine.»9
Based on this philosophy, value investors look for good,
solid companies, that for one reason or another are selling really cheap
compared to their intrinsic value and not historical prices. Value investing is
a strategy of buying stocks whose intrinsic value is higher than the price that
the market has assigned to it. It's important to note that this does not refer
to the actual stock price. Some may confuse value investing with just buying
stocks because they are cheap ($5 a share rather than $300). This is not the
case. Value investing is based on the understanding of the fact that when you
purchase a stock, you are purchasing a part of a living, breathing and
operating company. The value investor sees stock ownership as a means to owning
a part of a company, rather than just gambling on a stock hoping it will go up.
The performance of the stock, and the price of the stock in the market will
undoubtedly eventually be based on the performance of the company. One of
Buffet's most known phrases is that «time helps great companies and
destroys mediocre ones.»10 Therefore, it is necessary for the
value investor to assess how good of a company it is that he or she is buying.
When
8
Investopedia.com
9 Robert Hagstrom, The Warren Buffet Way( 103)
10 Robert Hagstrom, The Warren Buffet Way( 147)
buying a computer, the customer has to look at its processor,
how much memory it has, how big it's hard drives are and many other factors in
order to assess its future performance. In comparison, the value investor must
look at numerous key measurements of the company's performance in the past in
order to assess whether this is a good company to own a part of. These
measurements will often be found on the Balance Sheet, Income Statement and
Statement of Cash Flows which every publicly traded company must provide
quarterly, as well as many other places such as the Shareholder's Report,
company website, or the company's Investor Relations department as well as the
internet. This paper goes into detail on how to locate them in a further
section. These values include everything from how the management runs the
company, to how much debt the company has, to how much money it earns annually,
and many other different factors. A value investor's job is to look at all
these values, known as fundamental measurements, and make a decision as to how
much the company is worth, or its intrinsic value. It's worth noting, however,
that different investors will judge intrinsic value differently. If two
investors were given the same information, they may come up with two completely
different estimates of intrinsic value. Once the intrinsic value is known, the
investor will compare it to the current market price, and if the stock is
trading lower than what the investor believes its worth, he or she will
purchase shares. Therefore, he or she is usually not interested in the day to
day price fluctuations of the stock because he or she knows that he or she has
picked a solid company that is posed to perform well.
For example, Tony is thinking about which companies are good
to add to his portfolio. He decides to look at SBUX, a Starbucks stock that has
been trading for around $40 a share until recently when it fell to $15. He is
wondering if SBUX's price fell because the market has undervalued it, or
because there is something wrong with the company. He spends a few days
researching the company, looking at P/E ratios, statements of Cash Flows, and
many other different quantitative factors. He also looks at the recent news
about the company, recent changes in management and other qualitative
factors.
He then makes a decision that to him, Starbucks is worth $45
a share, because it's a good solid company and has a bright future and bright
expansion plans. He sees now, that he can get a bargain because the price fell
to $15 a share, so he buys. He doesn't really care to look at day to day market
fluctuations and he is not biting his or her nails off because he is afraid he
will lose his or her investment. He knows he has bought a solid company. In two
weeks, he checks to see that the stock has risen back up to $40 dollars.
He then decides to take a look at some of the other stocks in
his portfolio and sees that a company with a stock symbol of WINS, which he
bought for $7 a share has fallen to $4 a share. He is wondering if he should
buy more. He re-evaluates his or her stocks, taking his time to do research,
only to find out that the management changed in the company for the worse. He
decides to sell his stock so that he won't lose any more money. The company
eventually bankrupts. In this case, the price fell, but it was the market's
reaction to a change in management for the worse. The market has evaluated the
price of the stock correctly.
Growth Investing
Growth Investing, on the other hand is a little bit different
cup of tea. The best way to explain growth investing is to put it into direct
contrast with value investing. Value investors are focused on the current price
of the company and its current intrinsic value, always shopping for a bargain.
Growth investors, on the other hand are interested in the future potential of
the company they are looking at, while not really putting much emphasis on the
current price. They don't mind paying more for a company than its intrinsic
value, because they believe that the company will grow way beyond their
valuations anyway.
For example, growth investing could be compared to a team
manager trying to recruit Michael Jordan. The manager would have to pay Jordan
a lot of money, but as long as he or she keeps winning games and putting people
in the seats, it's worth it. In addition, if he or she trains more, he or she
can get better. However, value investing on the other hand looks for players
that are good but don't have Jordan's hype. Therefore they would have to pay
them less, and get a great player at a bargain price. However, there is always
the possibility that they get what they paid for and the player really is
bad.
Growth investors are interested in growth stocks and those
tend to be companies that grow a lot faster than others. It makes sense then
for growth investors to be primarily concerned with younger companies that have
a lot of potential for growth. They base their philosophies on the theory that
growth in earnings and revenues will make the stock price go up. Growth
investors realize all of their profits through the increase of the stock price
rather than dividends paid out to them, because the companies they invest in
usually do not pay dividends.
For example, Tony's wife, Tanya is a growth investor. He or
she decides to look at shares of Google. They are currently trading for around
$530 a share, up from about $430 last quarter before the company's earnings
report came out. She wants to buy several shares of the stocks because after
evaluating the company, she strongly believes that the company can go up in
price even more, or perhaps the stock will split. She ignores Tony's advice to
wait until the share price drops a little bit, and makes the purchase. Google
continues to go up in price and Tanya makes money, making sure to tell Tony
that she was right.
Other types
There are two other major types of investing that are worth
mentioning but merit no further discussion in this paper due to its scope. The
first is income investing where the investor picks companies based on their
dividend yield and the income from the shares comes not from capital gains, but
only from dividends. The other type is called speculation and is where
investors look at chart patterns and have very little interest in the company
they are buying. This is a very risky way to trade and requires looking at
stock price changes on minute to minute levels.
Fundamental Vs Technical Analysis
There are two generally accepted ways to look at stocks and
determine whether they are worth purchasing or not. This chapter will
concentrate mostly on Fundamental analysis, as this is the main underlying
factor behind most of the successful strategies that were researched. However,
technical analysis is also very useful to know and should not be neglected.
Both ways of analyzing stocks should be included in a successful investor's
strategy because both provide information about the stock and its price
movements that should not be missed.
Fundamental Analysis is a term for a technique for looking at
a security such as a stock or a bond and analyzing its value by looking at
certain underlying factors behind that specific security. As discussed before,
a purchase of a stock is a purchase of a certain part of a living breathing
corporation. Successful investors have always performed fundamental analysis in
order to determine how much a security that they are looking at is worth.
Investopedia calls it the cornerstone of investing. It does however merit to
say that a growth investor and a value investor will look at different aspects
of the company's fundamentals differently, each will undoubtedly perform
fundamental analysis in order to know what he or she is putting his money into.
By looking at certain fundamentals of a company, industry or a whole economy,
the investor can make educated guesses as to the well-being of the company he
or she is looking at. Some questions answered by fundamental analysis
include
· Is the revenue growing?
· Is it making a profit?
· How does the company stack up against competition?
· How is the industry the company is in is doing?
· How deep is the company in debt?
· How free is the cash flow through the company?
· Is there evidence of «creative accounting»?
· And many more.
However, all these questions really boil down to one specific
question. Should I put money into this stock and is this a good investment
which will make my money work for me?
The real purpose of doing any kind of fundamental analysis
for any security is essentially finding out the security's intrinsic value.
Essentially, this is based on the rejection of the Efficient Market Hypothesis
because after all, if the market were always correct in its pricing, there
would be no reason to look for undervalued stocks. This essentially brings
another assumption: In the long run, the market will reflect the fundamentals
of the company and price the stock accordingly. According to Warren Buffet,
«In the short term the market is a popularity contest; in the long term it
is a weighing machine."11 The trouble is however, that the long run
may be just a few weeks or a few years and knowing the exact time frame is
impossible. The other problem is that one doesn't know if his valuation of the
intrinsic value is correct. As previously mentioned, there is no correct way to
determine intrinsic value, and different investors will come up with different
valuations.
Technical analysis, on the other hand is at a completely
different range of the spectrum. While fundamental analysis is concerned mainly
with the value of the company behind the stock, technical analysis looks more
at the price and volatility patterns of the stock rather than the company
behind it. Technical
11 Robert Hagstrom, The Warren Buffet Way( 103)
analysts are generally interested in the price movements of
the stock on the market. Essentially it studies supply and demand and by the
direction of the charts, technical analysis attempts to determine where the
stock will head. Technical analysis assumes that the price of the stock will
always reflect all the information about the company and the market that the
price moves in trends, and that price movements repeat.
Another main way that technical analysis differs from
fundamental analysis is the time horizon. Technical analysts will look at data
in months, weeks, days, hours and minutes in order predict future price
movements. They are often called swing traders because they do not hold on to a
stock for a very long time. Fundamental analysis however focuses on a time
frame of years, looking at num bers from financial statements of the past five
years in order to determine the value of the company. In addition, things like
management, brand recognition, and other qualitative factors that fundamental
investors look at can only be analyzed by looking at historical data from years
ago. The fundamental investor will hold on to a stock for a number of years,
because he or she believes that in the long run, the market will reflect the
intrinsic value of the stock.
Fundamental Analysis
Here, this paper will focus on fundamental analysis, or
analyzing the company behind the stock. When performing fundamental analysis,
there are two types of factors that comprise the fundamentals of any given
company. The first and the most obvious type that one might expect to look at
are the quantitative factors. These are capable of being measured and expressed
in numerical terms. Examples of these can be Assets, Liabilities, Revenues,
Expenses and many other factors found on the financial statements of a company
as well as on the internet. Qualitative factors, on the other hand, include
everything else. Things that cannot be measured such as the efficiency of
management, brand value, future outlook, patents, proprietary technology,
competition, and everything else about a company that cannot have a specific
number assigned to it. Qualitative factors are the largest reason why when two
different investors are given the same figures, they can come up with two
drastically different valuations of the company. These factors cannot be
measured, but comprise a large portion of the intrinsic value of the
company.
Qualitative Fundamental Factors
10k and 10q
Before discussing qualitative fundamental factors, it is
important to mention these annual reports of a company's performance that have
to be submitted either yearly (10k) or quarterly (10q) by publicly traded
companies to the SEC. The 10k usually contains company history, organizational
structure, and much other information not contained on the annual earnings
report. The 10q discusses the company's financial position and performance.
These can both be pulled up from the EDGAR database at
secinfo.org along with the annual
report and other SEC filings by companies12.
Company Level
Business Model
When Warren Buffet invests in a stock, he makes sure to treat
the investment as though he were buying the whole company.13 And
anyone buying a whole company would like to know its business model, and
understand it. The business model gives the answer to the most important
question - how does the company make money. It's possible to get a good
overview of the business model by looking at the company's website or checking
out the company's 10k filing (described below). In addition to looking over the
business model, it's necessary to understand it. Buffet talks about a circle of
competence, by which he means knowledge of a particular sector. He does not
invest in tech stocks not because he is afraid that they are too volatile, but
rather because they are out of his circle of competence - he does not
understand them. If an investor cannot understand a company's business plan, he
does not know what the drivers are for future growth, and investing in it could
be extremely risky.
12 Can be found at
secinfo.com
13 Robert Hagstrom, The Warren Buffet Way
Competitive Advantages
The competitive advantage of a company is also extremely
important. If the company does not differentiate itself from its competitors,
what is there to keep it in business? It can't get more market share, and
therefore is stifled in growth. Michael Porter, a Harvard Business School
Professor says that very few companies can compete successfully if they are
only doing the same things as their competitors. He argues that sustainable
competitive advantages can be obtained in several ways:
· Unique position in the market place
· Clear tradeoffs and choices vs. competitors
· Activities that are tailored to the company's strategy
A high level of integration across activities (The activity
system)
· A high degree of operational
effectiveness14
Signals of these factors can be seen in news reports, and also
the investor can get clues to these by looking at the financial statements
(discussed below).
Management
What good is a great business plan when the management is a
bunch of crooks, or they are stupid enough not to implement it correctly? Every
investor needs to know a lot about the management of the company. While
individual investors can't really get a face to face meeting with managers like
analysts that work for multi-million dollar funds can, it is possible for the
average investor to get a good feel for management in several different
ways.
Conference calls are hosted quarterly by the CEO and CFO of
the company. The first portion of the call is dedicated to reading off
financial results, but the really juicy part is the question and answer part.
This is where the line is open and different analysts can ask questions from
management. The answers here can be revealing, because analysts know what to
ask. But the more important part is how the management answers. Are they
answering like politicians or are they straightforward about their answers.
In addition, the Management and Discussion portion of the
annual report is where the management gets to be honest about the company's
outlook and is fully at management's discretion. A good thing is to look at
some annual reports from several years ago and compare them and see if the
management has followed up on what they have said and if the changes they
wanted to make have been implemented.
If the people who run the company have a material interest in
its success, they are more likely to work harder to make it succeed. The
investor should look for a large stake in the company to be owned by insiders.
It is especially crucial for small cap companies as management is crucial in
the success of the company, and the investor should look for management to be
invested in the company. In addition, it is worth noting that while insider
buys are worth looking, insider sells are worthless information, unless several
key executives are selling at the same time. The reason for this is that people
sell stock all the time to finance their child's education, make a down payment
on a house, or many other different reasons.
14 Michael E. Porter, Cynthia A. Montgomery, Strategy:
Seeking and Securing Competitive Advantage. (182)
Industry Level
Assessing the company in relation to its industry can help the
investor to obtain an understanding of different external factors affecting the
company and how in control the company is of those factors. Customers
Some companies only cater to a few customers, while others
serve millions. A big red flag comes up when a business relies on only a few
customers for a large portion of its sales simply because of the question, what
if they go away? For example, if a company has the government as its sole
customer, what will happen to the company when there is a policy change and the
government no longer requires the company's product?
Market Share
The market share of the company can tell the investor a lot
about the company itself. If the company possesses most of the market share,
the investor can judge the stability of the company in the industry. In
addition, companies that hold a large amount of market share have an economic
safety guard against competitors and because of economies of scale they are
capable of absorbing costs a lot better and still maintaining the lead.
Industry Growth
If the industry where the company operates has a bleak outlook,
how can the company grow? This factor needs to be carefully considered before
investing in any company.
Competition
Some companies have one or two competitors while others can have
hundreds. Companies with hundreds of competitors can have a harder playing
field compared to those with only one or two.
Regulation
Is the company's product regulated? For example in the
pharmaceutical industry, the FDA has to approve any drug before it reaches the
market. This can take years and billions of dollars. This needs to be
considered in the attractiveness of the investment.
Several Guidelines for Performing Fundamental Analysis / Looking
At Ratios
When performing fundamental analysis, it's important to keep
several things in mind regarding ratios and other numbers. The first and one of
the more important things is that ratios are best looked at as a long term
trend. Even though it's useful to compare a ratio to a universally accepted
standard, or the industry, a ratio compared over five or ten years can tell a
lot more about a company. In addition, as previously mentioned the validity of
some numbers found on the financial statements often needs to be questioned and
adjusted in order to get a clearer picture. It is the investor's job as a
detective to provide him or herself with a clear picture of the company he or
she is buying. Furthermore, it is important to look at a number of different
factors and ratios that reveal important facts about the company's risk and its
potential because there is no indicator that will tell everything. Fundamental
analysis becomes a valuable tool when the investor begins to review trends,
each developed from tests of different ratios. It is also important to
understand that goals need to be set by the investor for him or herself in
terms of ratios. For example with the P/E ratios the investor may want to make
a goal to sell when the ratio hits a certain point because at that point the
company is not worth holding or could go down.
Quantitative Fundamental Factors
In order to understand quantitative fundamental factors, it
is necessary to understand where they can be found. Most of these factors can
be found in a company's financial statements. However, at the first look, these
can be extremely intimidating due to the extremely large amount of different
numbers and definitions on each. The three most important financial statements
of a company are the income statement, balance sheet, and statement of cash
flows. These can be found in either the investors packet along with the annual
report and can be obtained by calling investors relations, or by simply looking
up the company in a financial website such as Google Finance and looking at
these electronically. Following is a brief description of each statement and
some of its most important sections.
Balance Sheet
The balance sheet is a representation of assets, liabilities
and equity of a company at any given point in time. All balance sheets, at the
beginning say «As Of DATE.» This is important to understand because a
balance sheet is a snapshot of the company's financial situation at that given
point in time. It does not track changes over periods of time, but is rather a
clear picture of one point in time in the day of the company's life. The
premise of the balance sheet is that well, it balances. The businesses
financial structure balances in the following manner:
Assets = Liabilities + Stockholders Equity
Figure 1 - Balance Sheet
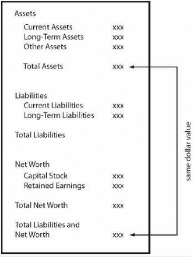
Source: Stock Market Investor's Pocket Calculator (113)
Assets
The resources that business owns or controls at the time
specified on the balance sheet. These can range anywhere from the stapler on
the secretary's desks, to the trucks that transport machinery, to the computers
that the IT department manages, and the building where it's based to the liquid
cash that's available in a company's bank account. They are further broken down
into categories called current assets, long term assets, and other assets.
Current assets
They are either cash, or can be easily converted to cash
within the nearest 12 months. This section of the balance sheet contains three
very important items crucial to company analysis. These include cash,
inventories, and accounts receivable.
Cash
Generally, investors are attracted to companies with a large
amount of cash on their balance sheets, believing that cash offers protection
from hard times and the ability for a company to quickly take advantage of
emerging business opportunities. And a growing cash account over several
business cycles indicates that cash accumulates so quickly that management
doesn't know where to put it. However, if a balance sheet's cash account seems
to hold an abnormally large amount of cash over several business cycles, a
question should pop up in every investor's mind as to why the money is not
being put to good use. Is the management too short sighted to do anything with
it? Has it run out of investment opportunities? These are questions that need
to be asked by every critical investor.
Inventories
Products that the company is keeping in warehouse and is ready
to sell. It is good to know if the company has too much money tied up in
inventory that it cannot move or is hard to move. If the company is not selling
what it has in stock at the warehouse, they cannot make the cash to pay bills
and make a profit. Receivables
Anything that is owed to the company. Finding out the speed
at which a company collects debts owed to it can tell a lot about how efficient
the company is financially. The collection period should not be growing longer
because that would mean that the company could be letting its customers stretch
their credit in order to increase its sales, but is not actually generating
cash. If when it's time to pay back, the customers don't have the cash to pay
because of a bad economy for example, the company could wind up in trouble.
Long term assets or non-current assets
They are capital assets minus accumulated depreciation. These
could be fixed assets such as buildings, machinery, and property. Unless the
company starts liquidating, these are not very important.
Other Assets
That includes any tangible or intangible assets such as
goodwill, prepaid assets such as insurance and
others.
Liabilities
Liabilities and Shareholders' Equity comprise the other side
of the balance sheet equation. They represent the total value of the financing
that the company has used to acquire those assets. If liabilities were used,
then the money to acquire assets came from loans and the company owes money to
banks or other lending agencies. These are also further subdivided into current
liabilities, and non-current liabilities.
Current Liabilities
Current liabilities are debts that the firm must pay off within
the nearest twelve months. These can include payments owed to suppliers and
other immediately payable expenses.
Non-Current Liabilities
Non-Current Liabilities are debts that need to be paid off in
over one year. These are usually debts to banks and bondholders.
Investors should look for a small amount of debt that is
preferably decreasing over the reporting cycles. The company should have more
assets than liabilities in order to be able to pay them all back and not go
bankrupt.
Shareholder's Equity
If the acquisition of assets financed by liabilities means
borrowing money from banks and other lending institutions, the acquisition of
assets financed by shareholder's equity means using the money gained from stock
sales to acquire them. It can be determined by the following formula,
Equity = Total Assets - Total Liabilities
Paid-In Capital
This is the amount that the shares were worth when they were
first sold. As discussed previously, the markets that the average investor
purchases from are secondary, and the prices of the stocks of those markets do
not affect a company's bottom line. Paid-In Capital discloses how much money
was made from the stock sales by the company.
Retained Earnings
They are the amount of money that the company has gained from
selling its stock that the company has used to reinvest in itself instead of
paying it back to shareholders in the form of dividends. An investor should
look how well the company puts this money to use and how it generates return on
this money.
Income Statement
The income statement is where all the juicy numbers are
located that always show up in the news. Figures like revenues, expenses,
profits and earnings per share and expressed on this statement. The main reason
for analyzing the income statement is for an investor to figure out if the
company is making money. Unlike the balance sheet, the Income Statement begins
with «For The Period Ending... Date.» This is to specify that the
income statement is a record of a certain amount of time in the company's life.
If the balance sheet is a picture, then the income statement is a short film.
The main formula that governs the income statement is:
Profits = Revenue - Expenses
Figure 2 - Operating
Statement
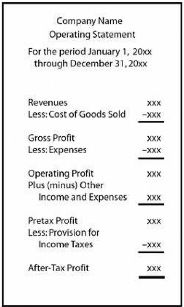
Source: Stock Market Investor's Pocket Calculator (136)
Revenue
Revenue or its synonym, sales, is how much money a company
has made over a certain period of time covered by the income statement. This
number is the main driver for the profitability of a company. However, since
profit, or earnings equal revenues minus expenses, it is good for the expenses
to be going doing while the revenues are going up.
COGS - Cost Of Goods Sold
This can be the sum of several different accounts. These can
include merchandise purchased for sale or manufacture, the cost of shipping,
salaries and wages that are paid out to employees that are in positions
directly related to revenues, and changes in inventory levels from the
beginning to the end of the reporting period. It is important to understand the
difference between costs and expenses. Costs should follow revenues very
closely, as they are essentially the cost of generating those revenues. So when
revenues go up, the costs will most often go up as well.
Gross Profit
This is the number obtained when subtracting costs from
revenues. This number should also vary along with sales. A gross profit that
fluctuates wildly from one period to the next could mean a merger or
acquisition, a new product, a sale of an operating unit, or a change in an
inventory valuation method. Further research should follow such a
phenomenon.
Expenses
Unlike costs, expenses do not vary alongside revenues. This
category includes all the money leaving the company that is not in direct
relation to revenue production. It is very important to note the difference
between costs and expenses. The relationship between costs, expenses, profit
margin and revenues is demonstrated Figure 3.
Figure 3 - Operating Statement with Controlled Expenses
Source: Stock Market Investor's Pocket Calculator (138)
As can be seen from the graph above, as revenue varies, the
costs vary alongside them, while expenses stay relatively unchanged. This
assumes that expenses are controlled. When revenues increase, so does profit
margin, making more money for the company that the expenses are not eating up.
However, consider the following graph with uncontrolled expenses.
Figure 4 - Operating Statement with Uncontrolled Expenses
Source: Stock Market Investor's Pocket Calculator (139)
This chart represents a company who is unable to successfully
manage its expenses, one of the usual reasons for this phenomenon being lack of
good internal controls.15 The level of expense rises over time
15 Michael C. Thomsett, Stock Market Investors Pocket
Calculator
eventually turning profit margin into loss. The profit margin
is shrinking when revenues are on the rise and when they are falling, which is
not a good thing for any company. A company with a relationship like this
between profit, revenues and expenses should be avoided at all costs by any
investor.
Expenses can also be further broken down into two categories
called selling expenses and administrative costs or overhead. Selling expenses
are related to the generation of sales but not directly, like costs. Overhead
can include rent for the office, wages of employees not directly related to
revenue generation, office supplies and electricity. These usually recur each
year.
Operating Profit.
This section discloses the profit made from operations which
will be the same or close to core earnings as defined by S&P (Discussed
Later). This number may often not be reliable, because even with GAAP it is
possible for companies to distort this number by creative accounting.
Other Income and Expenses
This is a series of additional adjustments from the non-core
section. For the income part, these can be profits from sale of capital assets,
currency exchange adjustments, or interest income. For the expense part this
could be losses from sale of capital assets, currency exchange losses and
interest expenses.
Pretax Profit
After subtracting expenses and adding income from the other
income and expenses section to operating profit, this is the number that is
determined. This is the value used to report net earnings.
Provision For Income Taxes
This is the amount set aside by companies to pay income taxes.
This value can change based on what country or state the company operates in,
its tax liability changes and other such variables.
After Tax Profit
This is the final net profit or loss, and the value used to
calculate Earnings per Share (Discussed Later). The problem with this measure,
however is that since this bottom line is subject to many nonrecurring and
non-core adjustments and other factors, the investors cannot compare two
different companies on the same level using EPS.
The income statement can provide some valuable knowledge
inside a company. Increasing sales shows a sign of good fundamentals, rising
margins can indicate increasing efficiency and expense control. It's also good
to compare the company with its industry peers and competitors to see how other
companies fare against the one you are researching.
Statement Of Cash Flows
This statement shows how much cash moves in and out of the
company over the quarter or year. This is also calculated for a specific period
like the income statement, but there is a big difference. Accrual accounting
requires companies to record revenues and expenses when the transactions occur,
not when cash is exchanged, and this type of accounting is used on the income
statement. For example, when the company shows a net income of $20 Million on
the income statement, that does not mean that he cash account on the balance
sheet will increase by $20 Million. The cash flow statement is more
straightforward, and when it shows $20 million cash inflow, the cash account on
the balance sheet is exactly what changes. It shows the
company's true cash profit. It shows the investor how the
company is able to pay for its future growth and expansion.
As a matter of fact, every investor should look for a company
that can produce cash. Just because profit shows up on the income statement
does not mean that the company won't get in trouble later because it does not
have enough cash flow.
Figure 5 - Statement Of Cash Flows
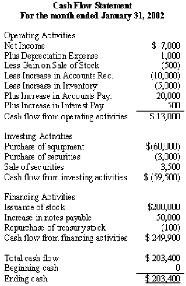
Source: http://financial-education.com/
The cash flow statement is subdivided into three different
sections. The following paragraphs will discuss them in more detail.
Cash flow from Operating Activities
This section provides the investor with information on how
much cash moves in and out of the company from the sales of goods and services
and from the amount needed to make and sell those goods and
services. Net positive cash flow is
always preferred, but high growth companies, such as technology companies will
show negative cash flow in this section during their first several years. Also,
changes in this section offer a forecast of changes in net future income.
Cash Flow from Investing Activities
This section shows how much cash the company spent acquiring
capital and any other equipment necessary in order to keep the business
running. It also includes mergers and acquisitions, and monetary investments.
It's good to see a company reinvest in itself by at least the rate of
depreciation expenses yearly. If that doesn't happen, the next year it could
show artificially inflated cash flows which would be fake.
Cash Flow from Financing Activities
This section describes the moving of cash associated with
outside financing. These can be the sales of stock or bonds or bank borrowings.
Also, paying back debt to a bank or dividend payments and stock repurchases are
all reflected here.
Reliability credibility core earnings
Before further discussing how to analyze the financial
statements presented above, it is necessary to make a distinction between what
is reported on the financial statements and what the real numbers may be. When
financial statements are prepared, they must follow GAAP, or generally accepted
accounting principles which were standardized by the SEC in order to avoid
accounting scams by companies. In addition, the Sarbanes- Oxley Act passed
after the Enron scandal prevents the same accounting firm that does the
auditing of financial statements to do consulting for the company. Discussing
this further is outside the scope of this thesis, but it will suffice to say
that the numbers on the financial statements may not always tell the whole
story, and the investor, in his or her analysis must dig deep and find the true
numbers often by him or herself.
Standard and Poor's Corporation developed the concept of
«core earnings,» or earnings from a primary product or service and
excluding nonrecurring items16, and at the time it was estimated
that the corporations under the S&P 500 index had their earnings overstated
by 30% the first year the adjustment was calculated.17 Therefore, it
stands to reason that using the core net profit and core net worth as a
reliable means for calculating the formulas and ratios that will be described
below will provide a clearer picture of a company's financial situation. Things
that can be excluded from financial statements that are GAAP approved are stock
options granted to executives or employees which can be huge if cashed in.
Contingent liabilities such as lawsuits that have not been lost yet but will
most likely be also escape the financial statements. Core earnings adjustments
account for these and therefore make sure that the financial statements tell
the actual position of the company excluding any one time revenues and
including hidden expenses. This allows the investor to look at the financial
statements and compare trends of how the company is doing and how it may grow
in the
16 S&P Core Earnings FAQ
17 «2002 S&P Core Earnings,» Business Week Online,
October 2002; through June 2002, reported profits for the 500 corporations
totaled $26.74 per share versus a core net profit of only $18.48, a reduction
of 30%.
future. These data can be found in the S&P's stock reports
service, (APPENDIX) which most brokers will provide.
It also stands to reason that a big difference between core
earnings and reported earnings may serve as a big red flag, because companies
with such a large difference could be using shady accounting practices. Well
managed companies tend to have a low core earnings adjustment in most years.
However, in some cases, when a unit has been sold off or an acquisition made,
sometimes the adjustment may be large. Also, companies with low core earnings
adjustments tend to report lower than average volatility in stock price.
Looking At Ratios
A ratio or a percentage tells the investor nothing. It's just
a number. They become much more powerful in comparison with those from previous
years or compared against industry and competitors to judge a company's
strength and growth. The real key to determining value of a company is whether
the key ratios that judge its performance have been growing and if it's
outperforming the industry on average. Furthermore, because of the sheer number
of comparisons that can be made between different factors influencing the
company, it is up to the investor to judge what ratios can be used and when.
Tracking all of these ratios can be impractical and time consuming, and for the
investor who has other things to do is just plain stupid. For example, in
retail intensive industries, it's worth looking at inventory indicators while
the number rarely matters in the financial sector or the software industry.
Think of the following section as a toolkit rather than an analysis sheet for
evaluating companies, and then when planning and researching investments, use
the tools that will provide the best picture.
Return On Equity
ROE answers the question of how well did the company but its
capital to work in order to make money. Since corporations are responsible to
their shareholders, who want to gain a better return on the money they invested
in that specific company rather than investors who invested in its competitor.
Return on equity measures how well the company put the money that investors
gave it to work. The basic formula for return on equity is as follows:
P/E = R P = Profit For A One Year Period
E = Shareholders' Equity
R = ROE or Return On Equity
|
|
However, there are some flaws with the formula that come from
its assumption. It assumes that the dollar value of capital did not change
during the year. However, the value of capital stock may change due to new
issues, retirement of stock or mergers and acquisitions.
This ratio is very useful when comparing the company to the
rest of the industry. Also ROE growth over several years can be of great
importance in showing how well the company has managed the money invested in
it.
Where It Can Be Found: This number can also be found on a number
of stock screeners and financial sites such as Yahoo! Finance and Google
Finance as well as the Scottrade stock screener.
Balance Sheet Analysis
Working Capital Tests
These next several ratios help to identify growth potential
or upcoming problems on the balance sheet. It is important to understand that
with all ratio analysis, it is the trend that counts and not only the latest
ratio itself.
Current Ratio
The Current Ratio is a comparison between balances of current
assets and current liabilities.
A/L = R
A = Current Assets
L = Current Liabilities
R = Current Ratio
|
|
The answer is a single digit and a popular standard for the
current ratio is 2 or better. However, in many well-capitalized companies with
good management, a ratio of 1 or above is acceptable as long as earnings are
consistent. For example, Altria and Merck are great examples of companies that
do well with current ratio lower than 2. It should stay consistent when looked
at over the years, and should be better or the same as the industry.
Consistency is very important in this ratio because controlled fundamental
volatility is a great sign,18 and comparing it to the industry will
give the investor a picture of how well the company is doing compared to the
competition.
Where It Can Be Found: This number can also be found on a number
of stock screeners and financial sites such as Yahoo! Finance and Google
Finance as well as the Scottrade stock screener.
Quick Assets Ratio
The same as the current ratio, but it excludes current inventory
values.
(A - I) / L = R
A = Current Assets
I = Inventory
L = Current Liabilities
R = Quick Assets Ratio
|
|
In companies with widely fluctuating inventory levels such as
retail stores whose inventory levels change due to sales cycles, comparison of
the current ratio may be unreliable. The quick assets ratio provides a better
tracking history in this case. An acceptable ratio is 1 and consistency is
key19. Also, comparing it to the industry and seeing the trend over
the years will provide the investor with a picture of how the company manages
cash which does not include inventory.
Where It Can Be Found: This number can also be found on a number
of stock screeners and financial sites such as Yahoo! Finance and Google
Finance as well as the Scottrade stock screener.
18 Michael C. Thomsett, Stock Market Investors Pocket
Calculator
19 IBID
Cash Ratio
This is the most conservative test of working capital, and tests
the highly liquid assets to current obligations.
C + M / L = R
C = Cash
M = Marketable Securities
L = Current Liabilities
R = Cash Ratio
|
|
Since cash and marketable securities are available
immediately as liquid assets for paying off debt, this ratio demonstrates the
highest level of liquidity. If a declining trend is evident or the ratio
approaches the 1 level, working capital becomes a concern. 20 A
company should be able to pay off its debts easily from its liquid assets.
Also, comparison to the industry and competition will provide a picture of how
the company is doing against those that are competing against it.
Where It Can Be Found: This number can also be found on a number
of stock screeners and financial sites such as Yahoo! Finance and Google
Finance as well as the Scottrade stock screener.
Working Capital Turnover
This is the average number of times a year working capital is
replaced.
R / A - L = T
R = One Year's Revenue
A = Current Assets
L = Current Liabilities
T = Working Capital Turnover
|
|
The result is expressed as a number of turns. This shows how
many times the working capital has generated its value in revenues. As part of
a bigger long term trend, it shows how effectively management controls its
funds.
Where It Can Be Found: While most financial websites will not
have it, brokerages a lot of times provide a research report for a stock
compiled by Reuters which will provide this number. If not, it can be
calculated.
20 Michael C. Thomsett, Stock Market Investors Pocket
Calculator
Accounts Receivable Tests
The accounts receivable account is a current asset account
representing the balance of the money owed to the company by its customers.
Since not all customers pay their debts, there is a reserve account for bad
debts. Since in accounting, every credit must be offset by a debit, credits to
the reserve account are offset by a debit to the expense account. In other
words, increasing reserve for bad debts results in a larger expense for bad
debts. When certain accounts receivable are identified as bad debts, they are
removed from the asset and from the reserve. The net asset includes the bad
debt reserve and the asset account.
The company bases how much it wants to place into the reserve by
recent history of bad debts. The reserve is only an estimate.
Bad Debts to Accounts Receivable
This formula tests the corporate policy regarding reserve
requirements and is expressed as a percentage. This should remain fairly level
even when receivable levels grow.
B / A = R
B = Bad Debts Reserve
A = Accounts Receivable
R = Bad Debts to Accounts Receivable Ratio
Where It Can Be Found: Most stock screeners and financial
websites will not include this number and the investor will have to calculate
it himself.
Accounts Receivable Turnover
This is a way to compare receivable levels to credit-based
sales. The relationship between the two accounts should be consistent, and if
accounts receivable is increasing at a greater rate than credit sales, working
capital could be in danger.
S / A = T
S = Credit Sales
A = Accounts Receivable
T = Accounts Receivable Turnover
Where It Can Be Found: While most financial websites will not
have it, brokerages a lot of times provide a research report for a stock
compiled by Reuters which will provide this number. If not, it can be
calculated.
Average Collection Period
This is a very important test of how the company is managing
the money that is owed to it. According to many studies, the longer that the
money is owed to a company, the more chance it has of not getting paid back. In
addition, during times when revenues are expanding, companies sometimes relax
collection efforts and internal controls. If historically, the period for
collection has been 30 days and all of a sudden spikes up to 45, there is a
problem in collection procedures, and even if the company is doing good does
not mean it should relax and stop collecting the money owed to it.
R / (S / 365) = D
R = Accounts Receivable
S = Annual Credit Sales
D = Average Collection Period
Where It Can Be Found: This must be calculated
Inventory Tests
Inventory is a current asset and is the value of the goods
the company holds for sale. When looking at retail organizations or other
organizations with significant inventory levels, inventory turnover is
important to determine how fast the company is selling its products and
effective management is at controlling inventory levels so that storage and
maintenance costs are not running up.
Average Inventory
In order to determine this, average inventory needs to be
calculated. The reason for this is because companies like retail stores or
manufacturing companies may maintain different levels at different times
throughout the year due to customer demand or sales cycles. To calculate
average inventory this is the formula.
Ia + Ib + In / N = A
I = Inventory value
a, b = periods used in calculation
N = total num ber of periods
A = Average Inventory
|
|
Where It Can Be Found: This must be calculated
Inventory Turnover
The number obtained from the previous formula is obtained to
obtain inventory turnover which estimates how often the entire inventory is
sold and replaced. This reflects the management's efficiency at keeping
inventory levels and the best level so that it does not tie up cash and storage
costs, or if it's too low it becomes hard to fill orders and revenue is
lost.
C / A = T
C = Cost Of Goods Sold
A = Average Inventory
T = Turnover
For most companies, 4 to 4.5 turnovers is an average
year.21 However, if the turnover begins to decline over the years,
it may be a sign that too much inventory is being kept on hand.
Where It Can Be Found: While most financial websites will not
have it, brokerages a lot of times provide a research report for a stock
compiled by Reuters which will provide this number. If not, it can be
calculated.
Capitalization
Capitalization is a description of how a company funds its
operations. This is a combination of two sources: equity and debt. The makeup
of capitalization is very important to a company and its investors. It varies
widely among companies in a single sector or industry and even between two
stocks that may otherwise look the same. A higher debt ratio may demand a
higher level of interest payments. In addition, the trend over the years of the
capitalization is very important and a negative trend should provide a serious
red flag.
Debt to Total Capitalization Ratio
Any investor must ask the question of what amount of
capitalization comes from equity and how much comes from debt. If debt rises
over time, the company will have to repay it in the future plus the ever
growing annual interest that debt carries with it. For shareholders this
threatens dividend growth and hampers a company's ability to grow. In addition,
a company with little or no debt can't go bankrupt and get liquidated.
D / C = R
R = Debt Ratio
D = Long - Term Debt
C = Total Capitalization
|
|
The answer the formula provides is the percentage of
capitalization that debt is. Obviously, the smaller this number, the better the
company is. This formula should be used in conjunction with the current ratio
to judge a company's management of money. If both remain level over several
reporting cycles, then the company is managing money well. However, if they
fluctuate it may mean that the company is using long term debt to keep the
current ratio level, which would mean a level of dishonesty to share holders
and is a way of creating long term problems to avoid short term ones.
21 Michael C. Thomsett, Stock Market Investors Pocket
Calculator
It's also very important to look at off-balance sheet debt,
such as pension liabilities. GAAP does not require companies to report certain
kinds of debt on the balance sheet, and an investor who is carefully
researching the stock will most likely find them.
Where It Can Be Found: This number can also be found on a number
of stock screeners and financial sites such as Yahoo! Finance and Google
Finance as well as the Scottrade stock screener.
Dividend Payout ratio
A related indicator of a company's capitalization is a
dividend payout ratio. This compares dividends paid to earnings per share. As
earnings grow, so should dividends along with them, and therefore this ratio
should remain pretty level. If it's slipping over the years, this is generally
a negative sign because earnings are not doing well.
D / E = R
R = Dividend Payout Ratio
D = Annual Dividend Per Share
E = Earnings Per Share
This ratio provides a snapshot of the company's
capitalization, cash flow and growth over time. If the company has rising debt
levels, the dividend ratio will have to slip because the company will not be
able to pay dividends. Similar scenario would occur with a declining cash flow.
However, if earnings per share are increasing and the dividends are increasing
in line with them, then growth prospects are good. It is also revealing to make
comparisons within a market sector of this ratio.
Where It Can Be Found: This number can also be found on a number
of stock screeners and financial sites such as Yahoo! Finance and Google
Finance as well as the Scottrade stock screener.
Market Capitalization
This formula determines the overall value of the stock on the
market.
S * P = C
S = Shares issued and outstanding P = Price Per Share
C = Market Capitalization
|
|
The distinctions regarding capitalization are important
because they are an indicator of risk levels, price volatility and investment
desirability. The largest corporations are usually capitalized at over $200
billion, large are $10 to $200 billion, medium size are $2 to $10 Billion and
small cap are under $2 Billion. The larger the market capitalization the
smaller the price volatility of the stock generally is.22
Where It Can Be Found: This number can also be found on a number
of stock screeners and financial sites such as Yahoo! Finance and Google
Finance as well as the Scottrade stock screener.
22
Investopedia.com
Income Statement Analysis
Tracking Revenue
Just about every investor will not touch a company with a
long history of declining revenues. That makes sense of course, since a company
with declining revenues isn't making money, and stocks of companies that are
not making money generally don't go up. However, since each sector involves
several competing companies, it's not realistic for a company to have revenues
go up each and every year even if it is well managed. It's also good to keep in
mind that a lot of times analysts and other investors may have unrealistic
expectations for revenue growth. For example if a company shows a growth of 5%
one year, 10% the next year the expectations is for it to have a growth of 15%
next year. However, that may often be impossible, and the company will not be
able to make it causing the stock price to drop. If it's a well managed company
and all the other financial fundamentals look good it can be a bargain to
purchase it when the stock price drops because the company did not make growth
expectations.
C- P / P = R
C = Current Year Revenue
P = Past Year Revenue
R = Rate of Growth in Revenue
This is the most popular way of tracking revenue as a change
from year to year in percentage terms. If a company's annual growth remains the
same or consistent, it's a very positive thing since the company is well
managed is not just riding a current trend.
Where It Can Be Found: This number can also be found on a number
of stock screeners and financial sites such as Yahoo! Finance and Google
Finance as well as the Scottrade stock screener.
Sales per Share.
Sales are the main driver of revenue for most companies.
Therefore, it is necessary to calculate sales per share for the company as well
as look at the trend of this ratio. Here is how to obtain it
SPS = R / S
SPS = Sales Per Share
R = Past Year Revenue
S = Average Shares Outstanding.
|
|
For growth companies, it is good to look for increasing sales
over the past five years. 23 On the contrary, value companies whose
shares have gone down in price but are still showing a positive SPS trend are
wonderful bargains.
Where It Can Be Found: This number can also be found on a number
of stock screeners and financial sites such as Yahoo! Finance and Google
Finance as well as the Scottrade stock screener.
23 John D., CFA Stowe, Thomas R., CFA Robinson, Jerald E., CFA
Pinto, and Dennis W., CFA McLeavey, Equity Asset Valuation
Tracking Earnings
In order to fully analyze growth trends, it is necessary to
look not only at revenue growth, but also at earnings growth. If the company
reports increases in revenue, but is at the same year losing earnings, it's not
a company an investor wants to be interested in. Traditionally, earnings growth
is measured with this formula
C- P / P = E
C = Current Year Net Earnings
P = Past Year Net Earnings
E = Rate of Growth in Net Earnings
|
|
Where It Can Be Found: This number can also be found on a number
of stock screeners and financial sites such as Yahoo! Finance and Google
Finance as well as the Scottrade stock screener.
However, as previously mentioned before, the net earnings
from a company's income statement can be manipulated and is not always the most
accurate one. To get a clearer picture, it is better to utilize core earnings
found on the S&P stock report.
CC- PC / PC = E CC = Current Year Core Earnings
PC = Past Year Core Earnings
E = Rate of Growth in Core Earnings
|
|
It is also necessary to compare the difference between net
earnings growth and core earnings growth, as previously stated in order to
gauge how honest the company is and how honest the management of the company is
and if there is any creative accounting going on.
Earnings per Share
Earnings per Share is considered to be a key ratio is deemed
instrumental in judging the value of a stock. It is calculated by this formula
traditionally
N / S = E
N = Net Earnings (Year) S = Shares Outstanding E = Earnings
Per Share or EPS
|
|
To further clarify this, since the shares outstanding fluctuate
throughout the year, the shares outstanding number should be calculated as an
average. 24
Where It Can Be Found: This number can also be found on a
number of stock screeners and financial sites such as Yahoo! Finance and Google
Finance as well as the Scottrade stock screener. Some data sources may use the
number of shares outstanding at the end of the year to simplify their
calculation, so be careful to get the correct number.
24 Investopeda
However, as previously mentioned, in order to get a clear
picture, in calculating earnings per share it is necessary to use core net
earnings.
CN / S = E
CN = Core Net Earnings (Year)
S = Shares Outstanding
E = Core Earnings Per Share or EPS
|
|
The EPS is a representation of a company's profit divided by
a share of common stock and is often tracked by analysts as the most important
indicator of the price of a share, but can be easily manipulated, so in this
paper it will be considered a bit further down the line. Companies have EPS
estimates that they try to reach every quarter and price may fall if they are
not reached.
Comparing Revenue to Direct Cost and expenses
In order to understand why the revenue has increased or
decreased as well as why the earnings have gone up or down, the investor should
look at the relationship between the revenue and gross profit.
R - DC = GP
R = Revenue
DC = Direct Costs
GP = Gross Profit
Direct costs include anything that relates to the generation
of revenue. They should remain constant from year to year unless a specific
event such an acquisition, change in mix of business or valuation methods for
inventory will change. Therefore, the trend for revenue and growth profit
should correlate from year to year.
The percentage of growth profit to revenue is called growth
margin. This number should stay about level from year to year unless one of the
aforementioned events happens in the company.
G / R = M
G = Gross Profit
R = Revenue
M = Gross Margin
|
|
Where It Can Be Found: This number can also be found on a number
of stock screeners and financial sites such as Yahoo! Finance and Google
Finance as well as the Scottrade stock screener.
Expenses to Revenue
The picture becomes even clearer when expenses are compared
to revenue. Even though expenses do not directly influence revenue, because
they can include factors such as interest expense, electricity bills and
salaries of employees that are not directly related to generating revenue, the
movement of expenses should correlate on some level with the fluctuations in
revenues. The rate of growth in expenses can be calculated as
C- P / P =E
C = Current Year Expenses
PC = Past Year Expenses
E = Rate of Growth in Expenses
|
|
Once this has been calculated, the investor can compare the
ratio of expenses to revenues using this
formula
E / R = P
E = Expenses
R = Revenue
P = Ratio (Percentage)
|
|
The consistency in this over the years can mean several
different things. It means a good internal control system and efficiency, and
that management is keeping expense level well and overhead costs down in order
to generate revenue.
Where It Can Be Found: These numbers must be calculated
Operating Profit Analysis
The operating profit is the profit from all core activities,
or continuing operations. This is the number that should be watched in order to
quantify growth potential. The first formula to look at in this case is the
rate of growth in operating profit. It's very similar to the rate of growth in
net earnings, but it excludes all other income and expenses and focuses only
earnings from operations.
C - P / P = R C = Current Year Operating Profit
P = Past Year Operating Profit
R = Rate Of Growth In Operating Profit
|
|
Where It Can Be Found: While most financial websites will not
have it, brokerages a lot of times provide a research report for a stock
compiled by Reuters which will provide this number. If not, it can be
calculated.
Cash Flow Statement Analysis
Free Cash Flow
On a statement of cash flow, the investor should look for
companies that produce a lot of free cash flow. This can be calculated by the
following formula:
NI + (A or D) - C- E= FCF
NI= Net income A= Amortization D= Depreciation C= Changes in
working capital
E= Capital expenditure
FCF= Free Cash Flow
|
|
This is the money that allows the company to pay debt,
dividends, repurchase stock and increase business growth. It is the excess cash
produced by the company and can be either returned to share holders in terms of
dividends or invested in new growth opportunities.
It's good if a company can pay for the investing figure out
of operations cash flow without having to rely on outside financing. This
signals very strong fundamentals.
Where It Can Be Found: While most financial websites will not
have it, brokerages a lot of times provide a research report for a stock
compiled by Reuters which will provide this number. If not, it can be
calculated.
Net Cash Flow per Share
Cash flow is the stream of money through a company. It
measures how the company is receiving its money and if they get paid as they
sell or if they sell a lot on credit to make their revenues look bigger. This
number should be looked at as a trend over five years, and the investor would
want it to increase. It is calculated as follows
C / S = R
C = Current Year Net Cash Flow
S = Average Outstanding Number Of Shares Over The Year R = Net
Cash Flow Per Share
|
|
Where It Can Be Found: Most financial websites will have it, and
brokerages a lot of times provide a research report for a stock compiled by
Reuters which will provide this number. If not, it can be calculated.
Estimating Intrinsic Value Using DCF
There are several ways to estimate the intrinsic value of a
company, and we found the Discounted Cash Flows formula to be used by Warren
Buffet. The formula is complicated, and calculating it is out of scope of the
average investor's expertise, but a formula calculator can be found here.
http://www.moneychimp.com/articles/valuation/dcf.htm
Figure 6 - Discounted Cash Flow Calculator Screen
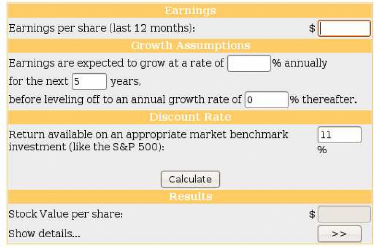
Source:
http://www.moneychimp.com/articles/valuation/dcf.htm
Some things here need to be explained. Earnings per share
should be put in here as the core earnings found from the S&P stock report.
The earnings growth projections can be found on a number of financial websites
as well as the Reuters Research Report. The investor should assume that the
earnings growth rate will level off to 0 after 5 years to give him or herself a
«margin of safety.» In addition, on average the S&P 500 is
usually growing by about 11% annually, but for additional safety the investor
may want to decrease that number. Then just click calculate and the calculator
will do all the complicated formula number crunching!
Technical Analysis
While fundamental analysis is focused on looking back at the
financial trends, the focus of fundamental analysis is looking forward and
trying to predict what will happen with the stock price. It is focused on how
the day's price, volume and trading trends will affect the price in the future.
It is important to remember that technical and fundamental analyses are not
exclusive, but are usually used in conjunction with one another by successful
traders. Neither point of view is considered «right» since any
analysis is essential an estimate, but the more information the investor has,
and the more data he or she can gather, the more confident he or she can be in
his decisions. Just like looking at only history data and ignoring price trends
is a mistake, while only looking at price without checking profitability is
similarly misguided.
Furthermore, technical trends are very important for
identifying risk levels. Even a company who has great management, growing
revenues, and growing dividends may have high volatility levels in price. After
all, the shares in the market are priced and move based on supply and demand.
Oftentimes, companies with similar fundamentals may have wildly different
volatility levels which define market risk and any investor would be stupid to
ignore those facts.
In addition, numerous technical signals could predict changes
in fundamentals. For example, a change in the volatility of the stock price can
predict earnings surprises. If a share is bought and sold 50,000 times a day,
the investor can use the combined knowledge of the traders by looking at the
charts to predict his or her own moves.
Introduction to Technical Analysis
Technical analysis is based on one thing: the stock price and
the trends in price movement. Volume is also key to considering the movement of
a stock's price. The main idea of technical analysis is to attempt estimate the
next direction the stock's price will move and to invest either in a short or
short term position. Technical analysis can also be used to estimate hold and
sell decisions as well. To do this more successfully, techniques such as chart
watching, price and volume formulas and observations of trading ranges are
employed by the investor.
Technical analysis originates from the Dow Theory that stock
prices tend to act in concert. Some very specific concepts determine how trend
analysis takes place. The first time frame technicians look at is the tertiary
movement or the daily trend of the market, not reliable for estimating long
term trends. The next is the secondary movement measured on the 20-60 period
and this movement reflects current sentiment. Finally, the primary movement can
go on from several months to several years, which is what is used to determine
if it's a bull market or a bear market.25
Current Price
This is the price the stock is currently trading at.
52 Week High / Low Price
The highest and the lowest price within the last 52 weeks, or
one year.
25 Jack D. Schwager, Getting Started in Technical
Analysis
Daily Dollar Volume
This tells the investor how much money trades in the stock on
a given day, determining how liquid the stock is, or how easily it's bought and
sold. The thing to keep in mind is that most mutual funds won't touch stocks
with low dollar volumes because it may be difficult for them to sell the stock
in the future because they trade in very large lots. The bare minimum trading
volume should be no less than $50,000 a day. Small cap investors will look for
low daily volume, less than $ 3 million so that the mutual funds are not
touching it. When the volume spikes, the mutual funds will go for the stock if
it's a good value, and the price will increase.
Chart Patterns
The whole premise of technical analysis is the study of price
and its patterns. There are several specific price patterns and concepts that
form the basis of technical analysis. In addition, the purpose of computing the
market mood and directions is not just to make good timing decisions, but also
to judge risk and volatility. Viewing price trends demonstrates the risk /
reward relationship. If the price movement is volatile, there is a greater
chance of upward movement, but also a greater chance of lower movement.
Conservative investors would rather accept lower volatility as a trade off for
smaller returns.
Trading Range, Resistance, Support
Volatility is defined by the trading range. Usually, the
prices of stocks establish a range of number of points in which they trade. If
the price breaks through this range, it's a significant event forecasting a new
rally or decline in the price level. Also, technicians will look at the stock's
price level approaching the upper or lower limits two or more consecutive
times, attempting to break through, and event called the breakout. If that
happens, it's usually a signal that the price will move in the opposite
direction.
Figure 7 - Trading Range, Resistance, Support
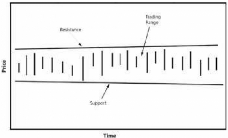
Source: Stock Market Investor's Pocket Calculator (159)
The upper trading limit is called the resistance level and is
the highest price in the current trading range. The lower level is called the
support level which is the lowest price of the stock. Once these have been
crossed, the trading range could become more volatile, until a new range has
been set. It is also necessary to point out that trading range changes may
foreshadow things like earnings surprises or meeting or not meeting earnings
expectations, causing the stock price to go up or down.
Head and Shoulders
A classic charting pattern is named head and shoulders, named
because it involves three high prices with the middle price being higher than
the first and third.
Figure 8 - Head and Shoulders Charting Pattern
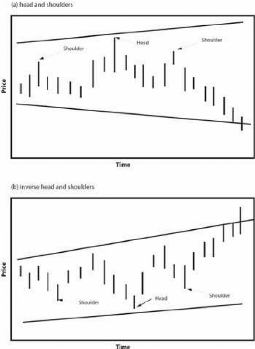
Source: Stock Market Investor's Pocket Calculator (163)
It is seen as an attempt of the price to break through the
resistance, and once the price retreats without breaking through, the pattern
forecasts a price retreat. The inverse head and shoulders pattern indicates the
opposite, and forecasts a pending price rally. 26
26 Michael C. Thomsett, Stock Market Investors Pocket
Calculator
Gaps
Gaps occur when the price closes at one level one business
day, and opens above or below the trading range of the previous day (highest
and lowest price). Gaps are important because they imply major changes in
trading range and interest among buyers or loss of interest among sellers.
Figure 9 - Gaps
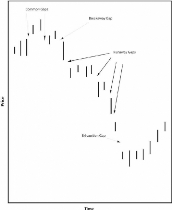
Source: Stock Market Investor's Pocket Calculator (165)
Four kinds of gaps exist that are worth looking at:
· Common gap is part of daily trading and implies
nothing
· Breakaway gap pushes the price into a new territory and
does not fill during further trading
· Runaway Gaps are several gaps over a few days moving the
price in the same direction.
· Exhaustion gap is usually large signaling the end of the
runaway pattern. After this gap, the price usually moves in the opposite
direction. 27
Other Patterns
There are many other patterns that are used by technical
analysts, but these represent the major ones and are the most important for
forecasting. In addition, it is out of scope of this paper to go into full
detail on technical analysis. Trading the range of the stock reveals the degree
of volatility and market risk. The trading range is the best value of risk.
Further Measuring Volatility through Formulas
To the technician, the price volatility is of central issue. A
smaller trading range implies lower volatility. Therefore, even as price levels
change, the trading range may state the same. However, if the trading range
begins to widen or narrow, it is a sign of coming change. Even though it is
possible to calculate the price
27 Jack D. Schwager, Getting Started in Technical
Analysis
volatility by subtracting the 52 week low price from the 52
week high price and dividing it by the low price, this formula is not entirely
accurate. Any investor that has looked at a stock chart measure the performance
over the course of a year knows that spikes in price of a stock are imminent.
Most often, these spikes do not represent the trading range well because they
are abnormal, and therefore, they should be adjusted for. A spike can be
defined as a price that is outside of the trading range substantially and the
price trading immediately returns to normal trading levels, and the spike is
not repeated. The formula proposed for calculating volatility is adjusted
volatility.
|
(H - L) - S = V
H = 52 Week High Price
L = 52 Week Low Price
S = Price Spikes
V = Point Based Spread Volatility
|
Beta
Beta is a measure of systematic risk of a security, as
compared to the market as a whole. A good way to understand beta is how a
return of a security moves with the market. Beta is calculated using regression
analysis and is often used in the Capital Asset Pricing Model, which is out of
the range of this paper. However, it is useful for an investor to know the Beta
of a company in order to understand how risky a security can be. A beta of 1
indicates that the price of the security moves along with the market. If the
market moves up one point, the stock moves up one point. A beta that's greater
than 1 is an indication that the security is more volatile than the market. For
example a lot of stable companies such as utilities will have a beta of less
than one, meaning that the investor can expect less volatily, but he or she
gives up a higher return. However, on the other hand, technology stocks have a
beta greater than one indicating that in order to get the possibility of a
higher return that comes with purchasing a tech stock, the investor needs to
take on additional risk.
Combined Testing
There is a large debate about whether technical analysis is
more reliable or better than fundamental analysis. But the main point is, who
cares? Smart investors will use both to their benefit and succeed in the
market. Both offer useful information to make good decisions as an investor. In
fact, each side is valuable for interpreting trends in the other side. For
example, when there is a lot of difference between reported earnings and core
earnings, stock volatility tends to increase, and when the investor analyzes
the stock from a technical standpoint, his suspicions can be affirmed.
Furthermore, it is necessary to note that technical and
fundamental analysis are compliments to each other, rather than two directly
opposing theories of valuing securities. A long term investor will focus on
fundamentals to make sure he or she is buying a good company. That's great
because in the long run fundamentals are what really determine the market price
of the stock. However, in the short term they do not work, and technical
analysis must be relied on. Therefore a speculator will use those techniques to
make his or her decisions.
Finally, what this section will talk about is factors that
combine fundamental indicators along with technical indicators, and these are
the most watched factors for any security.
P/E Ratio
The major indicator that combines fundamental and technical
information is the P/E ratio. Annual P/E and Quarterly P/E
|
P / E = R
P = Current Stock Price
E = EPS (Annual or Quarterly)
R = P/E Ratio
|
Basically, the ratio determines the multiple of earnings that
the current prices consist of. So for exam ple a P/E of 10 means that the
current price is 10 times greater than that latest EPS. It fol lows that the
P/E that is calculated and shown on most financial websites is based on
unadjusted EPS. What the investor needs to do is to adjust it based on Core
EPS. Therefore instead of calculating P/E as Price / Earnings per Share,
calculate it as Price / Core Earnings Per Share, calculated earlier.
The importance of P/E ratio is important in determining
whether the stock is currently trading at bargain levels. This is critical to
the value investor. When the stock price is driven up, the P/E follows, and the
investor could tell if the stock is overpriced or not. A good way to narrow
down the investments is by using a stock screener and eliminating all stocks
trading above a certain P/E.
Another advantage of the P/E ratio can help the investor set
entry and exit points into position based on this ratio. If the P/E falls too
low, the investor may want to sell, and if it goes very high, he or she may
want to sell at the high point. In addition, comparing P/E to Core P/E can be a
great test of volatility.
It also helps to determine the average P/E Over the past several
(usually 5) years:
Average P/E over N Number Of years
|
(P/E1+ P/E2+ P/En) / N
P = Current Stock Price
E = EPS (Annual or Quarterly)
R = P/E Ratio
|
Comparing this with the current P/E can help to determine if the
stock is overpriced or under priced more than usual.
Problems with P/E
While the P/E is widely used, it is potentially unreliable
when the earnings figures used are quarterly, and that is what one would expect
to find on the financial websites. For example, in the retail industry the
report that comes out December 31 has the highest earnings, because of the
holiday season. If the P/E calculation takes place using those numbers, it
could be very unreliable. However, even when tracking annual P/E reliability
problems come up because the annual P/E could easily become outdated several
months after the annual report.
Overcoming P/E Problems
They key is to measure annual P/E and track its historical
trend, as well as measure quarterly P/E and track its trend as well. Also,
evaluate year-end P/E and price range next to current quarter data. If the
investor discovers that the current P/E is out of range with the year-end
historical P/E, it could be that information is
flawed and a lot has changed since the earnings that the
investor is using. Also, it is necessary to confirm P/E changes by comparing
other ratios such as price to revenue, book value per share, and cash. This is
valuable in improving the reliability of information and determining if the
current price is typical or not by looking at trends.
PEG Ratio
The PEG ratio is popularized by Peter Lynch, but is more of a
rule of thumb than a mathematical ratio. According to Lynch, a P/E of a company
that's fairly priced will equal its growth rate. This usually works better for
growth stocks than it does for value stocks. PEG ratio is calculated as
PE/Projected Earnings Growth Rate over the next 5 years.
Price to Sales or Revenue
Price to Sales is calculated as fol lows
|
P / S = R
P = Current Stock Price
S = Sales Per Share
R = Price To Revenue Ratio
|
The price to sales ratio can also get the investor more
information if for some reason he or she is unable to determine core earnings
of the company. Because this compares sales, which usually tend to be the core
sources of revenue for the company, they may provide a clearer picture. It is
also useful to compare it in situations where earnings are flat as a percentage
of revenue, but grow each year. In this case the P/E may not be very revealing,
but the Price to Sales ratio may provide a better view.
Finding Information
One of the most important things any investor needs to do when
he or she wants to invest in the stock market is to be able to have access to
information. There is many ways to access information and that's a really good
thing because after having any information, investors need to check its
credibility. Checking all information is the first step to limit mistakes. In
the following section, we will discuss about where an investor can find
information. While some sources are free, and others require a subscription,
each source is unique in its own way, and all of them have a reputation for
reliability. Some of the subscription sources are accessible in library or in
investment group. Beginning investors should go to their public library and ask
for any information concerning finance and stock market. Following is a list of
ways, techniques and medias where business and financial information is
available. All that sources are reliable but all investors have to double-check
any information before investing in stock market.
Companies Themselves
One of the most easiest and classic ways to have information
about a company is to ask directly for it to be sent to you from the company
itself. All companies have an investor's packet that they will send to you with
pleasure. When an investor is asking for such packet it's important that this
one contain at minimum an annual report, and last 10-Q and 10-K. Sometimes, for
big companies, investors can find it on the company website. Otherwise, they
can call the investor relations department of the company directly.
The annual report
The annual report is a document that public companies must
provide to all its shareholders in order to inform them about their operation
and financial conditions. Generally, an annual report will contain at least
these elements:
- Financial Highlights
- Letter to the Shareholders
- Management's Discussion and Analysis
- Financial Statements and their notes
- Auditor's Report
- Summary Financial Data
- Corporate Information
The 10-Q
This document which is published quarterly and submitted to
the Securities and Exchange Commission, report the company's performance for
the last 4 months. There is no 10-Q for the last 4 months because at the end of
the year, it's replaced by the 10-K
The 10-K
As for the 10-Q, this document has to be submitted to the
Securities and Exchange Commission. It reports also the company's performance,
but it contains more detailed information than the 10-Q or the annual report.
Most important information is for example the company history, organizational
structure, the holdings or the subsidiaries. Generally the 10-K must be filled
2 months after the end of the fiscal year.
Financial Publications
There are hundreds of financial publications, most of them are
reliable, and the important thing with financial publication is to find one
that you like to use. Beginning investors will not use the same publication as
someone who has been investing for 15 years, or as professional stock market
investors. Investors have to feel confident with the publication, it's always
better to understand well an easy-reading publication than to not understand at
all a really difficult one.
Magazines
The magazines selected here give a good view of the general
economic and financial condition of the world. The two first specialized in
finance offer to their readers an easy-reading approach of the main news, and
opportunities of the market. The last one, more general is a good way to stay
informed of all international information that can influence the market.
Because this paper's strategy is based on real world and not stock fluctuation,
it's primordial to stay aware of how the economic world is doing in order to
anticipate opportunities and so make higher profits.
Smart Money
Smart Money is the magazine edited by the Wall street Journal.
Published monthly, SmartMoney's objective is to provide to professional and
managerial people, information about personal finance. It covers articles about
saving, investing, and spending and does a really good job with mutual fund and
stocks. The magazine also has articles on technology, automotive, and lifestyle
subjects.
An annual subscription cost $12 for 12 issues.
Contact information: 800
444-4204.
www.smartmoney.com
Kiplinger's Personal Finance
Kiplinger's Personal Finance is a magazine published every
month since 1947. It's the oldest personal finance magazine in the US. Articles
talk about personal finance and stocks, but also about other financial topics
such as credit cards, college tuition, buying homes, cars and other major
purchases.
An annual subscription cost $12 for 12 issues.
Contact information:
800-544-0155.
www.kiplinger.com
The Week
The Week is a news magazine published as its named say, every
week. It defers from other magazine by publishing a digest of best articles of
the week published in other domestic and international Medias. It's a good way
to stay informed of the most important «classic information» with
only one publication.
An annual subscription cost $50 for 50 issues
Contact information:
877-245-8151.
www.theweekdaily.com
Newspapers
Those 3 newspapers are specialized in finance, 90% of all
information published is directly or indirectly related to the market. The Wall
Street Journal and the Financial Times can be considered as the «Holly
Bible» of investors. All important information concerning the market is
published by those newspapers and the reader can be sure that the relevance of
the information is guaranteed. The last newspaper this paper advice to read is
the Investor's Business Daily, less conservative than the 2 others, it give
also relevant information and investors will love its stock table measurement
which are not available in other publications.
Wall Street Journal
Created by the Dow Jones Company, the WSJ sells 2.6 million
copies annually. Its articles treat about financial and economical subjects in
USA and international world. One of the most important sections of the wall
Street Journal is called «Money and Investing», which tracks among
other things, the performances of indexes, the interest rate, the currencies
and commodities prices. This newspaper is one of the most important financial
newspapers in the world along with the Financial Times.
An annual subscription cost $99 for print and online access.
Contact information: 800-369-2834.
http://online.wsj.com
Financial Times
The Financial Times is a Britannic newspaper famous for its
salmon pink pages. The newspaper is divides in 2 main sections, the first one
treat about national and international news, whereas the second one is focus on
the markets and company news. Printed in 24 sites as London, New-York,
Los-Angeles, and Tokyo, the Financial Times is the main rival of the Wall
Street Journal.
An annual subscription cost $298
Contact information: 800 628
8088. www.ft.com
Investor's Business Daily
The Investor's Business Daily was founded by William O'Neil
because he was frustrated because he couldn't find all information he needs on
the Wall Street Journal. Treated about economical and financial subject as the
markets growth, indexes, stocks, the Investor's Business Daily is characterized
by its stocks table that contain 6 selected measurements that no one else
published in its clear way.
An annual subscription cost$295 for print and online access.
Contact information:
800-831-2525.
www.investors.com
Newsletters
The interest of newsletters is to have a different point of
view of the market condition. The 3 newsletters selected here are of course
reliable in term of information and commentaries. The two first are published
by main investment companies, Morningstar and S&P, they provides good
information concerning the general tendencies of the stock market, explain
easily what are the opportunities and gives advices that can be interesting to
research. The third one, Outstanding Investor Digest, is more a way to be in
contact with the high level world of finance. It gives summary of researches,
international conference and so one. It's the best way to know what the last
ideas of professional investors are.
Morningstar FundInvestor
Morningstar is a big investment research company. Its
newsletter, FundInvestor is focused on strategies which have proved their
success and tries to explain them in practical terms. FundInvestor gives
advices and analyses for creating and managing an aggressive or conservative
portfolio.
An annual subscription cost $105
Contact information:
800-735-0700.
www.morningstar.com
The Outlook online
Published by Standard & Poor's, the Outlook is a reliable
newsletter wrote by S&P analysts. It provides easy-understandable market
commentary, stock analysis and advice for investing. Published on paper and
online, most of professional use its online version easiest to use.
An annual subscription cost $200.
Contact information:
800-852-1641.
www.spoutlookonline.com
Outstanding Investor Digest
This newsletter is, as indicated by its name, a digest of the
market resentment. It publishes interviews, conference call transcripts,
letters to shareholders and so on. This newsletter is a good way to be
«inside» the financial world and to stay in contact with new
ideas.
An annual subscription cost $295
Contact information:
212-925-3885. www.oid.com
Internet
With the huge development of Internet, financial information
is every day easier to access. The problem of Internet concerning that
information is that there are so many sources that it becomes difficult to
distinguish those which are good and those which have been written by a
teenager of 14 years old.
Stocks screeners
A stock screener is a financial tool which gives the
possibility to investors to filter trough certain criteria of their choice
stock existing in the market in order to easily select companies that seem to
be interesting. In the large range of criteria available in a stock screener
some include the share price, the dividend yield or the price/earnings ratio.
Using the progress of informatics, stock screener has reduced at few minutes, a
task that was needed sometimes several days of work. The 3 stocks screener
selected here are very good. The main difference between them is there approach
for the investor. It's really important to feel good with a stock screener
because a beginning investor will pass lots of time to set criteria that
correspond to his or her research. Some of them are easier than other and some
of them give more information than other too. The best way to select a stock
screener is for sure to try different one and to stay with the one investor
will prefer.
Yahoo! Finance stock screener
As all stock screeners, Yahoo! Finance is an efficient and
rapid way to find stocks which respond to basic criteria determined by the type
of strategy an investor want to use. In its paying version Yahoo! Finance
stocks screener, offer the possibility to have access to real time data, which
is not really useful, unless in a daytrading strategy. Nevertheless, in the
free version, you can determine criteria divided in 6 categories, and then have
access to charts; reports and others research with a stock that you pick.
Contact information:
http://screener.finance.yahoo.com/stocks.html
Morningstar stock screener
Created by Morningstar Inc, this stock screener uses partly
the Morningstar system of grade (from A to E). Therefore, you will be more used
to it by also reading the Morningstar publication. One of the main advantages
of this stock screener is the possibility to select the type of stock as a
criterion, like aggressive growth, hard assets, high yield or speculative
growth. Beginning investor could feel more confident with such criteria.
Contact information:
http://screen.morningstar.com/StockSelector.html
Scottrade stock screener
Scottrade is a broker which provides for free a stock
screener, nevertheless, for investors who trade with this broker it provides
really good services where criteria can be added or rejected. One of its main
difference with other brokers is that investor can play with criteria like ROE,
PEG or select the capitalization from micro to mega-cap. It's a good stock
screener for investor who wants to select companies' through a large number of
criteria.
Contact information:
http://research.scottrade.com/public/stocks/screener/stockscreener.asp
Stock exchanges Websites
A good way to have access to reliable information is to go
directly at the source, the stock exchange itself. It can be the New-York Stock
exchange (NYSE), the National Association of Securities Dealers Automated
Quotation System (NASDAQ) or the American Stock exchange (AMEX). All have a
really good website, with live updates where an investor can find lots of good
information. Free information on each company is available, like its profile,
some data regularly updated, news or analysis. These websites will provide some
basic information about a stock.
Contact information:
http://www.nyse.com
http://www.nasdaq.com
http://www.amex.com
Other websites
It exist maybe hundreds website about finance, stocks,
markets, exchanges and so on. When an investor has to choose which websites he
or she will use, 2 main criteria are important. The first one is the
reliability and the credibility of the site. Even if you double-check any
information, using a website which is not totally reliable is a waste of time,
and in finance maybe more than anywhere else, «Time is money». The
second criteria which is important is the feeling you have with the website,
the easy-use way a site is built can make a great difference to the
accessibility of the information. A good advice is to not stay in a website
where you feel lost. Here are some investments websites on which investors can
trust the information, and always doublechecked it with another sources.
Barron's online
Directed by the Wall Street Journal, the Barron's online
website give accesses to lots of data, commentary and interview of experts.
There are also lots of general articles about technology, different industry
sectors, and new challenges. Barron's online is a good way to access to of
information easily.
Contact information:
http://online.barrons.com
Bigcharts
Also directed by the Wall Street Journal, Bigcharts provides, as
indicate by its name, many charts which are customizable, by time, or for
comparison. It's a useful site for technical analysis.
Contact information:
http://bigcharts.marketwatch.com
Business week
Partner of standard & Poor's, Business week offer reliable
data through charts and articles on many different business subject. It
provides also a summary of the S&P newsletter, The Outlook.
Contact information:
www.businessweek.com
Clearstation
Subsidiary of E*Trade, Clearstation allow you after a free
registration to have access to some analysis doing by non-professional
investors and to track their performance. It's a good way to have access to
other ideas but any investors who will use Clearstation need to be very precise
with checking information.
Contact information:
http://clearstation.etrade.com
Morningstar
The website of this investment research company provides a lot
of tools that can be more or less useful for investors. More than the articles
about the market and business life in general, Morningstar has got a really
good discussion forum where investors would find interesting responses to their
questions.
Contact information:
www.morningstar.com
Mootley fool
The most interesting thing in Mootley fool is its discussion
forum which will provide investors with a really good analysis about the
general market condition as specific investment topics. Most of the
participants of the discussion board are non-professional investors, so an
automatic checking about the information is strongly recommended.
Contact information:
www.fool.com
SmartMoney
The SmartMoney website is done by the same journalist that
working in the SmartMoney magazine (which is edited by the Wall Street
Journal), that's why this website is really reliable. Investors will find
articles regularly updated and its breaking news section on the top of the home
page which is interesting is really tracking the market.
Contact information:
www.smartmoney.com
TheStreet
TheStreet is maybe the website with the more articles of this
entire list, there is articles from a technologic side to a health care point
of view. Everybody will find something interesting to read. Although most of
the articles need a subscription fee, there is an free trial access for a month
where investors will have time to try this website.
Contact information:
www.thestreet.com
Other websites are also interesting to have a look on them; it's
possible to name
StocksCharts.com,
Marketwatch.com, Yahoo!
Finance.com, Google
finance.com,
Briefing.com, or SeekingAl
pha.com.
Other Medias
Information are available everywhere, it will be stupid to
limit research just at one or two magazines, newspapers or websites. Here are
some others sources which can be really useful for investors who want to have a
perfect access to all the information.
Value Line Investment Survey
The Value Line Investment Survey gives report and commentary
for more than 1,700 companies in the US. On the 2 pages devote to each company,
investors will find elements like a ranking, a price projections and insiders
decisions, a price history chart or even a quarterly financial statement.
Regardless to the price of the subscription, Value Line advices to consult a
tax advisor because the subscription may be tax deductible.
An annual subscription cost $538 for online access.
Contact information:
http://www.valueline.com
Standard & Poor's stock reports
More detailed than Value Line, the Standard & Poor's stock
reports, provides information on more than 5000 companies. Each reports
contains reliable data and objective analysis, it's a good resource to identify
investment opportunities, evaluate the performance of a portfolio and to build
strategies.
Subscription cost of $35 for each company (possibility to buy for
the whole industry)
Contact information:
www.standardandpoors.com
Reuters
Reuters is provider of information, divided in business &
finance news and general one, investors can have access to it via its Website.
The Headquarter is based in London but the information is really international.
It's an efficient way to have access to financial and general news in the same
time.
Contact information:
www.reuters.com
Bloomberg
Bloomberg is provider of information, mostly financial. Most
non professional investors can have access to Bloomberg services trough
Internet or their TV channel, nevertheless it exist a computer platform system
used by professional which is updated in real time and give the last
information about the market. Thanks to its professional analytic tools,
Bloomberg is a good way to access information or to check information already
known.
Contact information:
www.bloomberg.com
CNBC
The "Consumer News and Business Channel» (CNBC), is an
American TV channel which provide business information and cover the financial
markets. Although different from Bloomberg, CNBC is a also a good way to stay
informed of major Business and financial news.
Contact information:
www.cnbc.com
Personal experience
A good way to start finding companies that can be interesting
to invest in, is to follow your money. Few investors are thinking like that,
but you are probably buying the same things as millions of people. Try to know
why you are buying this product rather than its competitors. Peter Lynch who
had managed Fidelity Magellan Fund during 13 years has built his fortune partly
like that. He has invested in Taco Bell because he had liked it when he tried
one in California; he has invested in Apple Computer because his children and
the system manager of his firm were wanted those computers.28 The
fact is not to invest in the entire product an investor is consuming, but more
to be aware of what product worth to be examined to maybe become a future
investment.
As we have seen, finding the right information is important to
make good investment, checking the information is also something necessary to
limit mistakes. There is a lot of information available everywhere, now it
times to understand the information. A good advice that investors should keep
in mind is go step by step, time and experience will give them the knowledge to
find the best information they need and to understand it perfectly.
28 G. Hagstrom The Essential Buffett: Timeless Principles for
the New Economy
Successful strategies
Benjamin Graham
Who is Benjamin Graham and why he is important
Born in London in May 1894, Benjamin Graham (born Grossbaum),
moved to New-York when he was a child. His family was rich until the death of
his father in 1903, and the bankrupt of the boarding house of his mother. After
his Bachelor of Science from Columbia University, Benjamin Graham started to
work in Wall Street at 20 years old. First as messenger in a brokerage firm, he
quickly became a partner. At 25 years old, his salary was $600,000 a year.
In 1926, he created an investment partnership. At the same
time Graham was managing his own company, he took courses of finance at
Columbia University. With the help of David Dodd, professor at the university,
Benjamin Graham wrote what will become a classic of the investment world,
«Security Analysis», published in 1934. The second book of Benjamin
Graham published in 1949 «The intelligent investor» is still a
classic of investment strategy. Buffett says that is «the best book on
investing ever written».
Because Benjamin Graham is still considered the father of
value investing and because his theory and strategies are still applicable
nowadays, we consider it's important to refer to him in order to give to the
reader a good approach of the market. It's also a good way to understand the
philosophy from which the strategy of this thesis is found.
Main ideas from «security analysis» and «The
intelligent investors» for selecting stocks
In order to understand perfectly how Benjamin Graham was
looking at the market, investors have to know that for Graham, the market is
non rational, and that non-rationality comes from being human. For Graham, fear
and greed are the factors that make stocks fluctuate. When investors are
greedy, it will drive the market to overprice stocks, and the opposite effect
can be expected when they are afraid. Benjamin Graham considers that stock
prices are not representative of the value of a company because the market is
driven by human emotion. In order to help the investor not to
«listen» to his emotion (which has no use in stock markets), Graham
gives us a way for selecting stocks.
Investment Vs Speculation
First of all, Benjamin Graham clears up a difference between
investment and speculation. He was not considering speculation as an investment
strategy, for him it was more relative to gambling than to investment. Graham's
idea is not always easy to understand because for him, there is no perfect
criteria to determine the difference between investment and speculation. Here
is a definition of investment given by Graham: «An investment operation is
one which, upon thorough analysis, promises safety of principal and a
satisfactory return. Operations not meeting these requirements are
speculative.29» For him, a bond with a low return can be
associated as a speculation even if it's a bond, as well as, a stock which is
priced under the value of the company, is not speculative just because it's a
stock. Graham considers that it's more why you are investing than in what you
are investing that defines if it's an investment or a speculation. He believes
that there are 3
29 Benjamin Graham, Security Analysis(18)
criteria that define investing. First the investor should
analyze the company, second the investor has to protect him or herself against
big losses and third, investors should expect adequate returns and not get rich
quick schemes.
Satisfactory return and a limited risk
Graham was considering that the return of a stock is made both
by the income it generates and by the appreciation of the stock itself. He
advises investors to not take into account the day to day fluctuation of a
stock because great returns need time. Any investment should be done for a long
period, which means several years. Because for him, an investment is a mix
between satisfactory return and a certain amount of risk, Graham also believes
that in order to reduce the risk, they should diversify their portfolio. It's
important to understand that for Graham, risk is inherent to investment, and a
limited risk exists when the potential of losses is restricted.
Because he wrote «The Intelligent Investor» for the
common investor who is not a professional, Graham is really prudent about the
amount an investor should put in the stock market. He explains that, any
investors should at minimum have 25% of their investment in bonds. He also asks
the question of the risk to put all the rest in stocks. At this time, the
general thinking was that the amount of money you put in stock is a function of
your age. (100 - your age = % of your investment in stocks). Graham refutes
this idea, explaining that a couple which are retired with a good pension,
don't have the same relation to the risk, that a young couple that want to
invest to buy a house, pay the school of kids, the medical care, and so on.
Margin of safety
The main notion that Graham gives to the investment world was
what he called «the margin of safety». The basic concept take for
sure that is impossible for any investors to always be right in their
valuation, the margin of safety is a way to limit the risk of loss. Defined
quickly, the concept is «By refusing to pay too much for an investment,
you minimize the chances that your wealth will ever disappear or suddenly be
destroyed.30»
Graham develops the idea of margin of safety this way. If an
investor has found a company which seems to have an expected growth, he or she
has to buy stocks of it. Investors have 2 ways to buy those stocks, in the
first case, the market is in a bear condition, and it undervalued most of the
stocks. In the second case, the market just undervalued the price of this stock
compare to the value that you asses to the company. In both case, because the
price of the stock is under the intrinsic value of the company, there is a
margin of safety which will limit the risk of loss. For Graham, the best way to
limit the risk is to buy companies which are undervalued by the market. The
bigger the difference between the price of the stock and the intrinsic value of
the company, the bigger the margin of safety and the smaller the risk of
loss.
In order to evaluate the value of the company, Graham suggests
using the «future earnings power» of the firm. Nowadays, investors
which are following the main idea of Graham are not using this «future
earning power» to determine the value but the future cash flow discounted
to today's value.
«There are two rules of investing,» said Graham.
«The first rule is: Don't lose money. The second rule is: Don't forget
rule number one. 31» This «don't-lose?» philosophy
steered Graham toward two approaches to selecting common stocks that, when
applied, adhered to the margin of safety: (1) buy a company for less than
two-thirds
30 Benjamin Graham, The Intelligent Investor, Revised
Edition(527)
31 G. Hagstrom The Essential Buffett: Timeless Principles for
the New Economy (83)
of its net asset value, and (2) focus on stocks with low
price-to-earnings ratios. As we have seen, Benjamin Graham which is considered
as the father of the «value investment» has developed a concept which
is always used now. Some investors like Warren Buffett are still using Graham's
principle in all their trading operations. If Graham is seen as the father of
value investment, let's have a look, on Philip Fisher, the father of
«growth investment».
Philip Fisher
Who is Philip Fisher and why he his important
Born in September 1907, Philip Arthur Fisher is considered as
the father of Growth investment. Graduate from Stanford University in Business
Administration, he began his carrier as an analyst, in a firm of San-Francisco,
2 years later; he was the manager of the bank statistical department. He opened
his own investment company in 1931, two years after the crash of 1929. He had
said that it was the best moment to open his business because investors who
still have little money are probably not satisfied of their old broker. His
most famous book, «Common Stocks and uncommon profits» is still today
a reference for many growth investors. One of the most profitable investment he
ever made was to purchase stock of Motorola in 1955, he hold them until his
death in 2004.
As well as Graham for value investing, Philip fisher is
considering as the father of growth investing. His theory and strategy are
still used by many investors in the world. It's important that the reader
understand the basis of Fisher's contribution to the investment world because
the strategy develop later in this paper is for a part based on Fisher's view
of the market.
Main contribution of Fisher to the investment world
When Philip Fisher was a student at Stanford University, one
of his professors required him to come in order to visit companies together.
Each week, Fisher and his professor were going to visit a different company,
see how it works, and they have a discussion with the managers. After each
visit, during the way back, Fisher and his professor were talking about this
company, how they perceived it, its strength and weaknesses. Fisher will say
later about this discussion during the way back that «was the most useful
training I ever received32.» From these useful experiences
Fisher will develop the idea that companies with a higher return than the
average have 2 common points. The first one is that they have a potential of
growth higher than the average of their industry, the second one (probably link
to first one), is that they have a great management. Fisher will develop
criteria in order to select those companies which are able to generate higher
profit for investors.
Selection of good companies
Increasing of sales and profit during several years
For Philip Fisher the only way for a company to increase sales
and profits during several years is to have a product or service which has a
market potential growth. Fisher was looking for company with a future growth
higher than the average. He was also aware that an investor can judge a company
only through several years because a year of result is not representative of
the company potential.
Research and Development
One particular aspect which determines the potential of a
company for Fisher is its ability in research & development. Because he was
looking for a company with a future high potential, and because for him sales a
related to the product of the company, he knew that a company with a good
research and development department will generate future sales from their new
product. Fisher proposes that even companies which are not in a technical
industry have to possess a good R&D to implement new services, new process
and be more efficient.
32 G. Hagstrom The Essential Buffett: Timeless Principles for
the New Economy(65)
Sales organization
Although a Company can have an efficient Research and
Development department, it's not enough in Fisher's point of view. The R&D
create new product or services but they will be sold by the sales department,
if they are not, all the effort is useless. Fisher also believed that the
company has to generate profit from the sales in order to make new investments
and generate return for shareholders. Fisher wrote in Common stocks and
uncommon profits that «All the sales growth in the world won't produce
the right type of investment vehicle if, over the years, profits do not grow
correspondingly.33» He tries to explain to investors that
R&D generate good product that can be sold in the market. Those sales have
to produce a profit that can be reinvested in order to increase future sales
and future profit. He also says that a marginal company in a marginal industry
can generate profit but it will not be recurrent over the years. Fisher has
just created the growth strategy
.
No or few debt
For Fisher, all those condition are still not enough to invest
in a company. If a company wants to deserve his interest, it needs to fulfill
all those criteria, but without accumulating debt. Because companies with debt
are more fragile during period of bad economic conditions, Fisher was
interested only by company able to generate enough profit internally to be
self-financing.
Management honesty
The last advice that Fisher gives in order to select good
companies is in regard to the management. During the numerous company visits he
made with his professor, Fisher found that many managers are not honest with
shareholders. In his writing, Philip Fisher advices investors about the
absolute requirement of integrity and honesty of managers. Too many managers
are putting their own interest before the interest of shareholders. A good way
to determine a well-done management style for Fisher is the ability of a
manager to speak about bad news. All companies encounter problems, the honest
managers will not try to hide those, and will communicate to shareholders all
information concerning the situation. That's for Fisher the best way to see if
management is working in the best interest of the shareholders.
33 Philip Fisher Common stocks and uncommon profits and other
writings (126)
Investment in good companies
Focus portfolio in a circle of competence
Because the selection process of Philip Fisher is long and
time consuming, he was aware about that, he simply tells investors to limit the
number of companies in which they will they invest. In Fisher's point of view,
having a diversified portfolio will just diminish the return and increase the
risk, because selecting a few good companies with high return is more
profitable and less risky, Fisher's advice to have a focused portfolio.
The last advice Fisher gave to investors, is what he called
«the circle of competence». Investor shouldn't invest in industry
that they didn't know. He explained concerning a mistake he made «to
project my skill beyond the limits of experience. I began investing outside the
industries which I believed I thoroughly understood, in completely different
spheres of activity; situations where I did not have comparable background
knowledge.34»
In order to have an overall look on Fisher way of thinking there
is the fifteen point he advices any investors to look before investing a
company
.
34 G. Hagstrom The Essential Buffett: Timeless Principles for
the New Economy(67)
The fifteen points to look for in a common stock35
- Does the company have products or services with sufficient
market potential to make possible a sizable
increase in sales for at least several years?
- Does the management have a determination to continue to develop
products or processes that will still
further increase total sales potentials when the growth
potentials of currently attractive product lines have largely been
exploited?
- How effective are the company's research and development
efforts in relation to its size?
- Does the company have an above-average sales organization?
- Does the company have a worthwhile profit margin?
- What is the company doing to maintain or improve profit
margins?
- Does the company have outstanding labor and personnel
relations?
- Does the company have outstanding executive relations?
- Does the company have depth to its management?
- How good are the company's cost analysis and accounting
controls?
- Are there other aspects of the business, somewhat peculiar to
the industry involved, which will give the
investor important clues as to how outstanding the company may be
in relation to its competition?
- Does the company have a short-range or long-range outlook in
regard to profits?
- In the foreseeable future will the growth of the company
require sufficient equity financing so that the
larger number of shares then outstanding will largely cancel the
existing stockholder's benefit from this anticipated growth?
- Does the management talk freely to investors about its affairs
when things are going well but "clam up"
when troubles and disappointments occur?
- Does the company have a management of unquestionable
integrity?
35 Philip Fisher Common stocks and uncommon profits and other
writings(47)
Warren Buffett
Who is Warren Buffet and why his is important
Warren Buffet is well known by all investors around the world
for several reasons, one of them, which make him someone unusual is that he is
the richest person in the world. In its annual ranking, the magazines Forbes of
February 2008 had ranked Warren Buffet number 1, with a personal fortune
estimated at $62 billion.
Born in Omaha, Nebraska in August 30, 1930, Warren Edward
Buffett was pre-determined to work in the Stock exchange; his father was a
local stockbroker. As a young boy, Warren Buffett was fascinated by numbers and
mathematics. At only 8 years old; he was reading his father's books on the
stock market. At the time he was in the University of Nebraska studying
business, he read «The Intelligent Investor» by Benjamin Graham,
professor at the Columbia University. So interested by the ideas of Graham,
Buffet applied to Columbia University in order to study directly from Graham,
who became Warren Buffett's mentor.
Only just graduated with a master in economics, Warren Buffett
was going to work in Graham's company. During the Two years he worked in the
Graham-Newman Corporation Buffett was immersed in Graham investment approach of
the market. In 1956, Graham went to retire and Buffett went back to Omaha,
where at only 26 years old he founded an investment partnership with seven
partners and $100,000. For the 13 years he was CEO of this investment
partnership, he has got an average annual rate of return of 29.5% a year. One
of the most famous investments Buffet made at this time was with American
Express which as victim of a scandal saw its shares drop from $65 to $35.
Remembering a lesson of his mentor; that when stocks of successful company are
trading under their value, investors have to act intelligently, Buffett bought
$13 million of American Express shares (40 percent of the partnership's total
assets). Two years later, and after a tripling of the prices of the shares,
partners received a profit around $20 million. In 1969, because he was thinking
the market was too speculative, Buffett closed the investment partnership.
Buffet's shares of the investment partnership had grown to $25million, which
was enough to take the control of Berkshire Hathaway.
At the beginning, Berkshire Hathaway was a textile company
which quickly became the holding of Buffett to invest in other companies. At
first, Warren Buffet through his holding purchased insurance companies. He had
interest in insurance companies mainly for one reason: Insurance provide a
constant stream of cash flow via the premium paid by policyholders. Following
the advice of Graham, Warren Buffet was persuaded that there is an opportunity
when a structural good company is under-evaluated by the market. That was the
case with The Government Employees Insurance Company usually called GEICO. In
1976, GEICO' stock price dropped from $61 to $2, in five years, Buffet has
invested about $45.7 million in this company, persuaded it was a good
investment due to the competitive advantage of GEICO. Few years after, the
company made impressive performance and Buffett continue to invest on it. In
1994, Berkshire Hathaway purchased all the company which is still making really
good profits.
Berkshire Hathaway still exists today and it's still directed
by Warren Buffett. He had closed the books of the Textile Company in 1985.
Berkshire Hathaway now owns companies in many other sectors than insurance,
like in the food industry, clothing, media or luxury industry. Warren Buffet
took the control of Berkshire Hathaway, a company with a net worth of
$22million, nowadays, the same company, 35 years in the hand of this man, has a
net worth of $69 billion. If investors are interested investing in this
company, they just have to know that the share is trading around $134,000. That
makes it the most expensive share in the stock market.
With this kind of resume of Warren Buffet it's easy to
understand why this paper wants to develop his strategy. Based on Graham's and
Fisher's view of the market, Buffett's strategy is more contemporary, it's
easier for the reader to understand what are the criteria that makes Buffett
invest in a company. As well as Graham and Fisher, the strategy and the
approach of Buffett is important for the strategy developed later, it gives a
background in order to understand the context and the factors that are
important for investing in good companies and make profit in the stock
market.
Strategy: Buying good company at a bargain price
The beginning of the strategy of Warren Buffett is made by
some tenets that characterize his way to select a company in which he will
invest. Following are the most important tenets that Buffet is using, there a
combination of his personal experience, his mentor principle and Philip Fisher
theory.
Tenets of the Warren Buffett Way36
Business Tenets
- Is the business simple and understandable?
- Does the business have a consistent operating history?
- Does the business have favorable long-term prospects?
Management Tenets
- Is management rational?
- Is management candid with its shareholders?
- Does management resist the institutional imperative?
Financial Tenets
- Focus on return on equity, not earnings per share.
- Calculate «owner earnings.»
- Look for companies with high profit margins.
- For every dollar retained, make sure the company has created at
least one dollar of market value.
Market Tenets
- What is the value of the business?
- Can the business be purchased at a significant discount to its
value?
36 G. Hagstrom The Essential Buffett: Timeless Principles for
the New Economy(79)
Business Tenets
It's important to understand that for Warren Buffett, stocks
are not the most important factor when he is doing an investment. Warren
Buffett considers that investors have to use the same scrutiny in buying stock
as they will do when they buy the whole company. He based his decision on how
the business is done by the company and not on how the market perceived the
business. Here are some fundamental principles Buffett is attentive of when he
starts looking at a company.
Is the business simple and understandable?
The first tenet of Buffett is to understand very well the
business in which the investor want to invest. It's important to know almost
everything about the industry, the sector and the company. In doing so, any new
information will be understood as a new factor that influences the portfolio of
the investor. Although Buffett was a «disciple» of Graham, he took
one of the main ideas of Philip Fisher when he is talking about investing
within your «circle of competence». The purpose is not how big the
circle of competence of the investor is, but how well he or she can understand
all the parameters inside it.
Does the business have a consistent operating history?
In the Buffet's view of investing; investors have to avoid all
companies that are changing radically their position in the business because
the previous one is not efficient now. He also advocates to never buy stocks of
a company which is actually solving difficult problems. Buffett emphasis the
fact that he avoid Radical change and Difficult problem, in the sense that all
companies are constantly modifying their positions in the market by launching
new products and solving «day to day» problems. Buffett observes that
«Severe change and exceptional returns usually don't
mix.37» For him, best returns are achieved by companies which
are consistent on their product line in the long term.
Does the business have favorable long-term prospects?
In order to understand perfectly the long term view of Warren
Buffet, it's important to distinguish the difference he made between what he
called a «Franchise business» and a «Commodity business». A
franchise business is characterized by the fact that they don't have a close
substitute and they operate in a market which is not regulated. At the
opposite; a commodity business' product is not distinguishable from competitor,
like oil, gas or chemical product. According to Buffett, commodity businesses
have a low rate of return and are more exposed to profit' problems whereas,
franchise businesses he said, «Can tolerate mismanagement. Inept managers
may diminish a franchise's profitability, but they cannot inflict mortal
damage.38»
37 G. Hagstrom The Essential Buffett: Timeless Principles for
the New Economy(81)
38 IBID (82)
Management Tenets
After having watched with scrutiny the business, Buffett tells
investors to have a look at the management style of the company. He thinks that
managers who are acting like the owner of the company are more able to see the
long term objectives and so they will act with more rationality.
Is management rational?
For Warren Buffett, the rationality of a management is seeing
with the allocation of capital. For him, the allocation of capital is essential
because that's what will create the future value for shareholders. The
allocation of capital has to be in accordance with the position of the company
on its life cycle (development, growth, maturity or decline). In Buffett's
mind, all cash that invested internally will produce a rate of return on equity
higher than the cost of capital has to be invested in the company. There is no
logical reason to not reinvest those earnings. The only reason, for him to not
reinvest this cash is that it will not produce a return higher that the cost of
capital. In such situation, the company has to give this cash to shareholders
trough dividend or share buy-backs that will increase the value of each share
in circulation in the market. For Buffett, the way the cash is allocated
between the company and the shareholders is the proof of the rationality of the
management. Berkshire Hathaway, has almost never distributed dividends to
shareholders.
Is management candid with its shareholders?
Because management is human, Buffett insists on the fact that
managers have to be respectful and honest with shareholders and always act on
their best interest. He likes when annual reports contain explanations of what
is right in the company, but he prefers to know what is wrong, and why. For
him, managers who have the courage to discuss publicly the problems of the
company are able to resolve those problems. It's normal that a company
encounters problems, it's business, the most important is to not hide them. As
all managers, Buffet is using the Generally Accepted Accounting Principles
(GAAP), but he also refers to data that are not required by the GAAP.
Does management resist the institutional imperative?
Another point that distinguishes exceptional manager from
others is their ability to resist what Buffett calls, the «institutional
imperative». For him, the majority of managers are not independent in
their way of thinking; they imitate other managers which also imitate them.
Buffett saw «free-managers» as the top of the basket, they are making
their decisions based on their own knowledge and understanding of a situation
and will not fol low the group blindness.
Of course it's difficult to measure the quality of a manager;
there is no quantitative data that can be used to identify strength and
weaknesses of managers, all is about qualitative perception of a Human that by
definition can make errors. «When a management with a reputation for
brilliance tackles a business with a reputation for poor fundamental
economics,» Buffet w rites, «it is the reputation of the business
that stays intact.39»
Financial Tenets
When Buffett has selected companies which are running the
firsts tenets, he analyzes how the company is doing financially. Mostly, he
looks at 3 criteria that are non-negotiable, the return on equity, the high
profit margin and the creation of market value, here are those criteria.
39 G. Hagstrom The Essential Buffett: Timeless Principles for
the New Economy (85)
Focus on return on equity, not earnings per share.
After having looked at the business and the managerial skill
of a company, Warren Buffett analyzes the financial situation of companies he
is interested in. When most investors analyze the earning per share, one of the
main criteria for Warren Buffet is looking the return on equity. For him the
return on equity gives a better understanding of the financial health of a
company than the earning per share. He explained that companies can accumulate
previous earnings and use it to increase the actual earnings per share, so this
time horizon problem can sidestep the analysis of the health of a company. In
order to perfectly use the return on equity ratio that is more accurate of the
company' used of shareholders equity, Warren Buffet told investors to make some
adjustments. Investors should exclude of their calculation all the gains or
losses due to capital operation as well as all extraordinary gains or losses
that influence the earnings. Return on equity should reflect the normal
activities of a company; it should show how the management is able to generate
return with the capital employed. Always concerning the return on equity,
Buffett point of view, is that a company should generate profits without or
with few debts. There are 2 reasons to this «debt allergy». The first
one is because with debt, a company can increase their return on equity through
the leverage effect of the debt-equity ratio. The second reason is that company
with no or few debts are more able to resist to bad economic conditions.
Look for companies with high profit margins.
For Warren Buffett, investors should focus their attention to
companies with high profit margin. He distinguishes 2 types of managers
regarding the profit margin: those running a high-cost operation, and those who
are running a low-cost operation. For him, high-cost operation managers always
added overhead expenses and are fighting against cost only when it
significantly reduces the profit. On the other hand, low-cost managers are
always trying to find ways to reduce expenses.
Buffett reckons that when a company managed in a high-cost way
tries to cut-off expenses through a «cost-killer program», it will
affect the return of the company. He explains that «The really good
manager does not wake up in the morning and say, this is the day I'm going to
cut costs.40» Buffett emphasizes the fact that the overhead
expenses of his company, represent less than 1% of the operating earnings, when
similar companies have something around 10% of overhead expenses; in doing so,
shareholders are losing 9% of the operating earnings.
For every dollar retained, make sure the company has created
at least one dollar of market value.
Another financial tenet Buffett considers is that for each
dollar invested by shareholders, the company should generate at least one
dollar of market value. Less than one-for-one is a loss for shareholders.
Nobody wants to invest $1 and be the owner of 50cents a few years later. Good
companies should increase their value in the market by more than the value of
earnings they retained.
Market Tenets
After having analyzed previous criteria, Warren Buffett is
able to know if the company is a good one or not. If it's a good one, he will
analyze how the market perceived this company. When most investors are looking
at the market first, Buffet is looking at it at the end of his selection
process. By analyzing the market he will try to know if it's time to invest on
the company to take advantage of a bargain price.
40 G. Hagstrom The Essential Buffett: Timeless Principles for
the New Economy(95)
What is the value of the business?
Buffett considers that the value of a company is the total
amount of the net cash flows expected in the future discounted to an
appropriate rate. In doing so, he explains any company, never mind the
industry, will be judged equally in an economic point of view. Buffet also
explains that if an investor can't estimate with precision the future cash flow
of a company, he or she should not invest on it. That's why, Buffett don't
invest in new-technology company because he can't estimate the future cash flow
and he explains that those companies are out of his circle of competence. Once
an investor has made a good estimation of the company, he or she has to
discount this value to today; the investor will use a discount rate. Buffett
considered that this rate should be a risk-free rate, that's why he advices to
use the long term US government bond. (Those bonds are virtually risk-free,
because the government will always pay its debts). Lots of investors will add a
premium to this risk free rate considering the fact that the company's future
is uncertain (in comparison to the certainty of the US government bond). Buffet
doesn't add any premium; he prefers to adjust the discount rate. If the
discount rate is too low, let's say 7% Buffett will correct it to 10%. In doing
so, he increase the «margin of safety». If he is right he just used
the good discount rate, if his wrong, he just increased his margin of safety of
3%.
Can the business be purchased at a significant discount to its
value?
In order to buy companies for less that their value, Buffett
is using the margin of safety. This notion developed by Buffett's mentor, the
professor Benjamin Graham, is the difference between the stock price of a
company and its intrinsic value. If a company is a little bit undervalued by
the market, there is a small margin of safety, if the value stock of the
company is really undervalued there is a big margin of safety. This margin of
safety is a tool to helps investors of 2 different ways. First of all, if the
investor has made a bad evaluation of the company, the margin of safety will
reduce the risk of looses. If an investor evaluate a company at $100 per share
and the market undervalue it at $85, the investor has a margin of safety of
$15. If the value of the company drops to $90, the investor has still $5 of
gain. The second help, which is more or less the opposite of the first one, is
the possibility to earn extra-returns.
Summary
All the strategy of Warren Buffett is a process which starts
from the examination of the business in order to understand perfectly all
factors that influence it. Then he looks if the top management of the company
is good and rational. When Buffet has found a company with those criteria, he
ana lyzes the financial health of the company in order to estimate its value.
At the end of this process, he analyzes the market to see if the stock price of
the company is under-valuated. Buffett likes to say that he is 85% Graham and
15% Fisher. His strategy for picking stocks is inspired by those two men.
Buffett always buys quality companies at a bargain prices. A last remark is
important to be made, Warren Buffett has more than 50 years of experience now,
and he is lucky to have amazing business and financial skills. Most of
beginning investors will not at the first time be able to analyze the market or
companies like Warren Buffett. Investors can know perfectly each tenets or
advice of Warren Buffett, but in order to invest like him, investors will need
time to create their own experience and most of them will unfortunately never
reach the success of Buffett.
Focus investment
Now that investors know about the way Warren Buffett selects
the companies in which he will invest, it's interesting to have a look on what
Warren Buffett says about portfolios. As well as selecting companies, Buffett
is not acting like most of the investors.
The Status-quo of Active portfolio Vs index investing
The general idea about investment in the stock market is that
there are mainly 2 strategies, the active portfolio investment and the index
investment. Investors who trust in the active portfolio style are always
trading lots of stocks in order to outperform the market. They don't select
stock trough criteria based on the company but more on how they perceived the
stock will fluctuate in the short term. For example intraday trading is an
active portfolio style of investment. Investors are buying and selling the same
stock during the day and hope they will outperform the market thanks to their
superior market perception skills.
Investors who trust in the index investment are less
presumptuous; their point of view is to stick the market. Because the market is
composed of thousands of stocks, those investors are creating diversified
portfolios which are similar to indexes like the S&P500, the Dow Jones or
the Nasdaq100. Nevertheless, by acting like that, investors can't outperform
the market because they are following it, so in the best chance they will have
the same return of it but never more. Because of the different way of managing
their investment active portfolio investors and indexes investors are
constantly trying to proof that their way of investing is better than the other
one. Now, it's commonly accepted that index investments have a higher return
than the active portfolio. Nevertheless, those ways of investing have a common
denominator; both are investing with a diversified portfolio. Many books will
claim that diversification reduce risk and maximize profit. Thousands of
business school' students have heard that diversification is the best, if not
the only way to be successful in the market. Let's see what Warren Buffett
proposes.
A third choice
Because Warren Buffett is not satisfied of the result of the
previous strategies, he advises investors to invest in a focused portfolio. The
main aspect of this strategy is to select few stocks of good companies, to
invest more money on high return' stocks and wait without worrying about market
fluctuations.
Find good companies through Buffett's tenets
As it's developed in the previous sections; Warren Buffett
selects good companies through a process of 12 tenets. By doing the same
investors should isolate some companies that are able to give high returns.
Having all his eggs in the same basket is an easier way to
look at them
The main principle of focusing investment is to be able to
invest in few companies with the highest chance of performance. Buffett
explains: « If you are a know-something investor, able to understand
business economics and to find five to ten sensibly priced companies that
possess important lon g-term competitive advantages, conventional
diversification [broadly based active portfolios] makes no sense for
you.41» As he explains, the «know-something»
investor, who is not a professional but someone interested in stocks with a
basic knowledge, should invest money between 5 or 10 companies he or she knows
very well, rather than investing in 50 companies that he or she doesn't know
anything.
10 stocks at 10%?
As Buffett says, he is 15% Fisher, one of the ideas of Fisher
was to invest more in stocks that have a stronger opportunity, that mean, a
higher return. Following this idea, Buffett says «With each investment you
make, you should have the courage and the conviction to place at least ten
percent of your net worth in that
41 Robert Hagstrom, The Warren Buffet Way (122)
stock.42» That's why previously he advises to
have at maximum 10 stocks. Nevertheless, some investments will have a higher
return than others; investors should allocate more resources to those in order
to have an overall higher return.
Time horizon
Focus investment is also different from diversified investment
trough its relation to time. When diversified investment has a short term
vision, Focus investment has a long term vision. One of the reasons to invest
in the long term is to limit the risk. In short term, stock price will
fluctuate due to several factors like a change in the interest rate, a new
report concerning inflation, a natural disaster and so on; but in the long term
share prices will more often increase. Buffett suggests having a relative
turnover of the stocks contained between 10% and 20%, so the time horizon of an
investor should be between 10 and 5 years.
Don't look at price fluctuation
Because prices fluctuate, and the value of stocks can drop
investors are subject to panic. But because focus investors are running the
long term, and because in the long term stocks are rising, there is no reason
to be afraid of short term fluctuation. The reader will not be surprised to
know that Warren Buffett never looks at short term fluctuation of his
stocks.
THE FOCUS INVESTOR'S GOLDEN RULES43
1. Concentrate your investments in outstanding companies run by
strong management.
2. Limit yourself to the number of companies you can truly
understand. Ten is a good number; more than 20 is asking for trouble.
3. Pick the very best of your good companies, and put the bulk
of your investment there.
4. Think long term 5 to 10 years, minimum.
5. Volatility happens. Carry on.
|
When investors have to sell their stocks
It can appear strange, selling stock is really easy. Investors
will sell their stocks due to 3 factors. The first one is because something was
wrong in the equation; stocks return is not as high as expected. The second
reason a change in the equation; what was right yesterday may not be right
tomorrow. The third reason is life cycle, your stocks as still a high return
but new one have a higher return.
42 IBID(122)
43 G. Hagstrom The Essential Buffett: Timeless Principles for
the New Economy(129)
Something wrong in the equation
Error is human; sometimes investors will make a mistake when
they estimate the value of a company, it will appear interesting to invest and
few times later investors will realize that it was not. In such occasion, the
best thing to do is to analyze the actual situation with calm, try to see how
bad the situation is. Maybe it will be necessary to sell the stocks and lose
money. It's business, it happens. Beginning investors are the most exposed to
make errors at the beginning, that's why experience is useful in investment.
Something changed in the equation
Because focus investment is running in the long term,
parameters can change. A really good company can become not so attractive a few
years after. Top management can change, financial situation can become more
risky, and there are several reasons this can affect a company. Even though
good companies generally stay good companies in the long term, exceptions
exist. In order to act and not to be subject of those changes, always staying
informed of the business, the company, the sector is a way to anticipate them.
If an investor sees that the company in which he or she has invested 5 years
ago is not fulfilling the criteria that it should, he or she will have to sell
and take his profit before the market understands the change and the stocks
drop.
Life cycle
The main reason that makes investors sell stocks is that a
better opportunity is coming. Investors can have a portfolio of really good
stock, but sometimes, a new stock give higher expected return. The new stock
will so take the place of an old stock in the portfolio. Generally, it will
take the place of the stock with the lower return. Remember what Warren Buffet
says about the turnover of a portfolio, it has to be between 10% and 20%, which
mean a time horizon of 5 to 10 years. Investor will keep a stock during one or
two years and others during 10 or more if the stock is always a top
performer.
All the strategy of Warren Buffett can be summarized in one
sentence. Buying quality companies at bargain prices. Warren Buffet told us to
understand the market, the business, the company before investing on it;
investors will have a better understanding of companies inside their circle of
competence. He teaches us to buy stocks when the market underestimates the
value of the company and so to take advantage of the margin of safety. Finally
Buffet told us to have a focus portfolio and to run it in the long term.
«I'm the luckiest guy in the world in terms of what I do for
a living. No one can tell me to do things I don't believe in or things I think
are stupid.44»
44 Quotable Executive (118)
Proposed strategy
Introduction
This section will outline the strategy that this paper will
propose for investing. At first, it will outline the market philosophy that the
authors of this paper will rely upon in order to develop the strategy.
Afterwards, it will discuss the different kinds of risk that can exist for an
investor and how an investor should know him or herself and his or her
financial position in order to responsibly adjust his or her portfolio for the
amount of risk that he or she can take. Furthermore, it will discuss how an
investor can overcome the hype caused by financial porn45 and
so-called market gurus and control for his emotions when he or she is investing
in the market. Following this, it will provide information on finding companies
and evaluating them, as well as how to organize the information, and to create
an investment thesis. It will finish by discussing buying and selling
strategies.
Strategic Philosophy
This paper makes the assumption that markets are inefficient.
It rejects the Efficient Market Hypothesis by asserting that it is possible to
beat the market by picking undervalued stocks and selling them at higher
prices. The main premise of this strategy will be to combine growth and value
investing in such a way that the investor will be looking for strong growth
companies at value prices, therefore getting into growth companies when they
are undervalued and selling them when the market recognizes their potential and
performance. The strategy will also attempt to control for the investor's
natural ability to «be human» therefore being prone to error and
emotion. In addition, it will try to time the market on a certain level by
using technical charts at their most basic level only as value indicators, but
not placing too much emphasis on them. In addition, the strategy will be
designed to help the investor organize the numerous amounts of information he
or she will collect about each company in a manner that would help make the
overall analysis and the creation of an investing thesis and strategy easier.
Furthermore, it will help the investor increase his or her performance by
evaluating it and as such learning his flaws and trying to account for them.
Know Yourself.
Before investing, it is necessary for the investor to
understand him or herself and his or her financial position in realistic terms.
This section will outline different factors that will influence the strategy of
each i nvestor.
Risk
Investing in the market does not come without risks, and it is
a necessity to understand that. It is virtually impossible to eliminate risk
for any investor in the stock market no matter how skillful. However, it is
possible to control the level of risk that is undertaken on any investment. In
order to understand how much risk an investor is willing to undertake, there
are certain criteria that he or she needs to evaluate about his personal
financial position.
The first thing that an investor needs to evaluate is how much
money can be invested in the stock market. Managing of personal finances is out
of the scope of this strategy, but it is necessary to mention that
45 The overwhelming amount of financial information on television
and the news, much of which is useless and promises to make a lot of money in a
very little time.
the investor must not be tied to any high interest debt such
as credit cards while investing in the stock market. The returns gained in the
market will rarely outweigh the interest compounding as an obligation to credit
card debt, therefore before investing it is necessary to be free of such debts.
Furthermore, it is necessary for the investor to understand that money he or
she is investing in the stock market should be highly illiquid assets. This
strategy will recommend long term investment and due to market volatility, the
longer term, and the better. Remember Warren Buffett's quote, «In the
short term the market is a popularity contest, but in the long term it is a
weighing machine.»46 It is necessary to understand that any
investments undertaken need to be taken for the long term. Therefore, for
example if the investor has a house purchase planned in the near future, it is
wrong for him or her to put the money in the market because in cou ld devalue
by the time he or she has to pull it out.
A full discussion of personal investment risk is outside the
scope of this paper as it is up to the individual investor to decide how much
risk he or she can take based on numerous different factors. Another aspect of
investing that must be understood is how much time the investor has to perform
research on each stock. He or she must make a decision about whether to be an
active investor or a passive investor. An active investment strategy will
require more research, while a passive investment strategy may just invest in
an index, compromising a lower rate of return for lower volatility and less
research.
A certain part of the investment portfolio should be kept in
low risk assets such as bonds. The size of that part must be determined by the
investor him or herself after carefully assessing his financial situation and
future prospects. The part of the portfolio that can be used for investing in
the stock market can also be adjusted for risk by certain factors. Several
indicators such as market capitalization can be used to determine the general
risk level of a given company's stock. For example, small cap companies offer a
a greater chance of return for a higher amount of risk, while mega cap stocks
such as the ones in the DOW offer lower amounts of risk for lower returns. It
is necessary for the investor to adjust his portfolio according to the amount
of risk he or she is willing to take.
Ignoring Financial Porn and Controlling Emotions
The media, internet and magazines are full of advertisements
for the next big thing, and the «10 Best Stocks.» In addition,
friends and coworkers are always excited about the next Furby doll or another
next big thing. As an investor, it's hard not to listen to the bombardment of
information that is thrown around. However, it is possible to use that
information advantageously in a responsible way. Before hitting that
«buy» button, the investor needs to have a well defined entry and
exit strategy as well as reasons for doing so. This strategy will outline how
to evaluate stocks and companies behind them while trying to control for the
investor's human emotions and flaws.
46 Robert Hagstrom, The Warren Buffet Way( 103)
Finding Stocks
Circle of Competence
Even though Warren Buffett respects Bill Gates highly as a
manager and entrepreneur, he never had a position in Microsoft stock. The
reason for that is because technology companies are outside of Buffett's
«circle of competence.» This concept is best described as the area of
business you already know. For example, Tony would know the IT industry best,
while Buffett would concentrate on the insurance industry. Within that circle
of competence, the investor should perform thorough research to understand what
the next trends are and what companies are positioned for success.
Personal Experience
As described above, investors are bombarded with
«hot» stock tips, ideas from coworkers, and other sources. In
addition, it's always easy to see the next biggest trends as long as the
investor keeps his eyes open. For example, anyone who noticed the Abercrombie
and Fitch trend when it first started would have made a very good amount of
money by investing in the company. Seeing what people are buying, which
industry gets interest and other such factors could point you to successful
companies. However, as previously pointed out before, no investments should be
made without due research into the company's fundamentals.
Stock Screener.
After thinking about personal experience, and thinking about
the hot stock tips the investor has received from his friends and coworkers, if
the investor can't really find any good stocks, many websites provide a very
useful tool called a stock screener. With this tool, it is possible to set
several criteria and then obtain a result that shows several stocks that fit
these criteria. Our advice to set some non-negotiable criteria that the
investor will not compromise on. A suggestion would be to specify these
factors:
Market Capitalization:
The higher the cap, the lower the risk, in most cases. The
definitions of market capitalizations as assumed by this strategy are as
follows.
Table 2 - Market Capitalizations
|
Market Capitalizations
|
|
Mega Cap
|
More Than $200 Billion
|
|
Large Cap
|
$10 - $200 Billion
|
|
Mid-Cap
|
$2 - $10 Billion
|
|
Small Cap
|
$300 Million - $2 Billion
|
|
Micro Cap
|
Lower Than $300 Million
|
Created with Information from
Investopedia.com
It is important to note that these definitions are not set in
stone, and change from time period to time period for many reasons. In order to
give a feel for returns of these companies, we have provided a table of their
returns:
Table 3 - Returns By Capitalization
|
Returns by Capitalization
|
|
Capitalization
|
Index
|
1-Year
|
3-Year
|
5-Year
|
|
Large
|
MLCP
|
-4.27%
|
8.34%
|
10.43%
|
|
Mid
|
MMCP
|
-6.7%
|
10.83%
|
15.56%
|
|
Small
|
MSCP
|
-11.39%
|
8.22%
|
14.11%
|
Created Using Data From MorningStar on May 9, 2008
It's obvious to see that mid-caps provide more volatility than
large-caps, less volatility than small caps, and seem to provide the best
return out of all three over a long time period. But as can be seen from the
one year data, the market did not do so well over the past year, and the
returns here are negative. This is important to understand and goes back to the
previous discussion of risk. This strategy will propose to pick mostly mid-cap
stocks because of their increased return and medium level volatility. In
addition, it will strongly suggest against companies capitalized at less than
$350 million dollars at all, even if looking for high volatility, because it
seems that these companies have a much higher chance of failure.
Daily Dollar Volume:
Low dollar volume on a stock suggests that institutional
investors have not noticed the stock yet and will not touch it because since
they are trading a large number of shares per trade they need high volume in
order to move their stock. The investor can use this to his or her advantage
because if a small cap stock has not been noticed by institutions yet and it is
a fundamentally strong company, it will eventually and when it does, the stock
price will increase. The other thing to keep in mind is that if the volume is
too low, that means the volatility is extremely high, and there is a chance of
inability to sell the shares. Therefore, this strategy will suggest a minimum
daily dollar volume of $50,000 per day, and no lower than that under any
circumstances.
PEG
PEG is the ratio of P/E divided by Earnings Growth Rate. In
the previous discussion about earnings and creative accounting, this paper has
mentioned that it is possible to manipulate earnings. Therefore, it would also
be possible to manipulate P/E. However, if the P/E is used in conjunction with
growth rate, the ratio itself cannot be manipulated. Following is a table of
PEG Ratio of companies in 2003. The returns were calculated as of April
2006.
Table 4 - PEG Ratio Correlation to Return
|
PEG Ratio
|
Number of Companies (1,316 total*)
|
Median Return
|
Average Return
|
|
Below 0.00
|
213
|
43.9%
|
69.4%
|
|
0.00 - 0.99
|
583
|
154.1%
|
225.2%
|
|
1.00 -1.50
|
193
|
78.4%
|
92.6%
|
|
1.51 - 2.00
|
102
|
60.5%
|
79.0%
|
|
More Than 2.00
|
225
|
44.4%
|
69.4%
|
*Includes U.S. companies trading on major exchanges with market
caps greater than $500 million for which data was available.
Source:
Fool.com
Stocks with a PEG ratio between 0 and 1 have provided the
highest average and median returns. It is necessary to note that this study is
not statistically correct because there is no such thing as negative PEG unless
earnings growth rate is negative, which is why the companies with PEG less than
0 provided lower returns. In addition, this usually works better for value
stocks rather than growth stocks. Therefore, this will help us find value
stocks, and we will use other factors to narrow them down to ones that are
growth.
ROE:
Buffet looks for return of equity of at least 20%. Our ideal
measure for this value would be above 25%, but if the company seems to have
other good fundamentals, and debt is extremely low, then 20% is acceptable.
Debt to Total Capitalization Ratio:
We are looking for companies whose management can keep them
out of debt. Therefore, we are looking for this number to be as small as
possible. We will not accept stocks with more than 10% debt to total
capitalization, and we will look for ideally for less than 5%.
Evaluating companies behind stocks
To be able to successfully invest, it is necessary not only to
find information and understand it, but it is also important to present a clear
picture of the company. This strategy would like to propose a system for doing
so. The system would consist of several spreadsheets to help the investor
analyze and narrow down companies that he or she is interested in. There are
several phases:
Quantitative factors
Phase 1
Once the criteria has been run the first stock screener, the
companies that are left after elimination will enter Analysis Phase 1
where they would enter the first spreadsheet. Here the spreadsheet will contain
quantitative factors that are the most important and the investor must look
at
|
Analysis Phase 1
|
|
|
Criteria
|
Significance
|
|
Date
|
When data was collected
|
|
Company Name & Ticker
|
To know what company this is
|
|
Current Price
|
Current price of stock
|
|
52 Wk High / Low
|
Used to judge point based volatility and trading range
|
|
Market Capitalization
|
Company size
|
|
Daily $ Volume
|
Liquidity and volatility
|
|
Debt / Total Capitalization
|
How much capitalization of the company consists of debt.
|
|
Industry Debt / Total Capitalization
|
In order to compare the company to industry levels
|
|
Return On Equity - ROE ?
|
How well the company put capital to work in order to make money
for investors. Bigger Is Better and should be increasing over past 5 years.
|
|
Industry ROE ?
|
Compare to industry.
|
|
Insider Ownership %
|
How much of the company is owned by insiders. Bigger Is Better
|
|
Stock Buyback Plan
|
If there is a stock buyback plan that is significant. Yes is
better.
|
|
5yr Price Appreciation
|
How much the price changed over the past 5 years.
|
|
Current P/E
|
How high is the price of the company to current earnings. Lower
is better.
|
|
Avg 5 Year P/E
|
In order to compare current p/e and see if it's overpriced.
Current P/E should be lower
|
|
Industry P/E
|
Average industry P/E. Current P/E should be lower
|
|
Price to Sales ?
|
How is the company priced according to estimated core earnings.
Should be lower, and increasing over past 5 years
|
It is necessary to be aware of recent stock splits as those
could influence price appreciation, P/E, and other ratios. Here the investor
would look at the companies and make a decision about which to keep and which
he or she would not move on to the next level of analysis. Since further
analysis takes time, it is necessary to narrow down companies that are not good
investments as early as possible before moving on to Analysis Phase 2.
Phase 2
Here the investor will perform more detailed analysis on a
smaller list of companies that the first list should have filtered out. He or
she will look at:
|
Analysis Phase 2
|
|
|
Criteria
|
Significance
|
|
Earnings Per Share ?
|
Earnings should be increasing.
|
|
Core Earnings Per Share ?
|
EPS adjusted for non-recurring revenues. Should be increasing.
|
|
EPS - Core EPS
|
Difference between EPS and core EPS. Reflects on the honesty of
accounting
and predicts volatility.
|
|
Core P/E
|
P/E based on core earnings
|
|
Net Earnings Growth ?
|
Growth of core earnings should be increasing
|
|
Industry Earnings Growth ? Projected Earnings Growth ?
|
Is the industry growing as fast as company or is the company
pushing to the top of the industry.
What are the projected earnings for the company.
|
|
Quick Ratio ?
|
How much more cash does the company have than debt due in the
next 12 months, excluding inventories. Should be 1 and hopefully going up.
|
|
Current Ratio ?
|
How much more cash does the company have than debt due in the
next 12 months, excluding inventories. Should be 2 and hopefully going up.
|
|
Industry Quick Ratio ?
|
How does the company compare to industry
|
|
Industry Current Ratio ?
|
How does the company compare to industry
|
|
Dividend Yield ?
|
A company with a good dividend yield could be a good investment,
but we are not looking for dividends since we are looking for growth.
|
|
Sales Per Share ?
|
How well is capital being put to use.
|
|
Free Cash Flow ?
|
How much free money does the money have available to expand?
|
|
Net Cash Flow ?
|
How much money actually moves through the company that's cash.
|
|
Projected High / Low
|
What are the projections for the high and low prices. Lowest
projection should be higher than current price.
|
|
Value Line Timeliness
|
Should be 1 or 2. How well the stock should perform relative to
all other stocks in the next 12 months.
|
|
Value Line Safety
|
Should be 1 or 2. How safe is the stock compared to all other
stocks in the next 12 months.
|
|
S&P Stars Rating
|
Should be 4 or 5. This is a measure that S&P uses to select
for their platinum portfolio.
|
|
S&P Fair Value Rating
|
Should be 4 or 5. The lower the number, the more overvalued the
stock is.
|
The stocks that pass through the analysis of this spreadsheet
will move to Analysis Phase 3. This phase looks at specific fundamentals
as compared to industry and is an optional analysis:
Phase 3
|
Analysis Phase 3
|
|
|
Criteria
|
Significance
|
|
Revenues to Direct Costs ?
|
How much direct cost does it take to generate revenues.
|
|
Cash Ratio ?
|
How much highly liquid assets does a company have
|
|
Gross Profit ?
|
Should stay constant. How much revenue is left after direct costs
are spent.
|
|
Gross Margin ?
|
Ratio of gross profit to revenue. Should stay level
|
|
Growth Rate Of Expenses
|
How much expense does it take to generate revenue.
|
|
Growth Rate of Revenues
|
How fast are revenues growing?
|
|
Expense to Revenue Ratio ?
|
Compare to gross margin to see if overhead is growing
|
|
Operating Profit Growth
|
Core income growth. Use if core earnings are not available.
|
|
Working Capital Turnover
|
How many times the working capital generated its value In
revenues.
|
|
Bad Debts to Accounts Receivable ?
|
How much money is lost that is not collected by the company
because of defaults by the people that owe the company? Is it increasing?
|
|
Accounts Receivable Turnover ?
|
Should stay level as receivables grow, otherwise the accounting
is not very honest.
|
|
Average Inventory ?
|
How much inventory is kept on average.
|
|
Inventory Turnover
|
How often is the entire inventory sold and replaced.
|
|
DCF Valuation
|
Results from running the DCF formula.
|
|
Margin Of Safety
|
How much of a margin of safety the investor feels is needed.
|
These three spreadsheets should provide a complete evaluation
of fundamental analysis of the quantitative factors of the company. Inferences
made from this should be put onto the investment thesis, the creation of which
will be discussed further. Companies that pass the previous three spreadsheets
should be further researched by the investor, but this time in terms of
qualitative fundamental factors.
Looking at Qualitative Factors
The nature of qualitative factors about a company does not
permit them to be organized in a numerical fashion, such a spreadsheet.
Therefore, this strategy will propose the creating of an investment thesis,
containing such factors about the company. It will permit the investor to keep
a clear record of why he or she is invested in the company. It will be look
similar to this:
|
Company Strengths Company
|
Growth And / Or Value
Is this a value or growth stock?
Hopefully it's both.
|
Why Buy?
Why invest in this company? Does it have a positive earnings
outlook? Is it poised to succeed in this industry? Is the PEG extremely low and
all the fundamentals are correct? Is the ROE great?
|
|
What are the strengths of this company? Is it poised for growth,
does it have
competitive advantages? Does it have good management? Is it an
industry leader? Does it own a new great patent?
I ndustry
|
|
Price Target
How high do you think this stock will go up before it starts
going back down.
|
|
Is this a fast growing industry? Is it something that will
take off in a few years?
|
|
Increase Position Target
If you are using DCA (explained
further) when you should you increase your position? This
strategy recommends 10%.
|
|
Company Challenges. Industry
|
Re-Evaluation Point
How much does a stock have to decline in order for you to re-
evaluate your position? This strategy recommends 10%
|
Why Sell?
What would have to happen that would cause you to reevaluate your
position or sell? Would the earnings drop significantly? Would ROE have to
reach a certain point?
Would oil have to reach a price point where you know the industry
will react negatively?
|
|
There should be no significant internal weaknesses within the
company.
Does the company face fierce competition? Does the rising
price of oil affect its growth outlook?
|
|
Stop Loss Target
When should you pull out and cut your losses? This strategy
recommends at 15%
|
Other advices
Picking a Broker.
This strategy will recommend going with a discount broker such
as Scottrade or Ameritrade, but there are many others. They have several
pricing plans as well, and in order to make an intelligent choice, the investor
needs to assess how he or she will invest. If he or she plans to increase his
positions several times a month, some brokerages have per-month pricing plans,
while other may charge $7 or $8 per trade.
Buying and Selling Strategies.
Gradually Building A Portfolio.
It's necessary to understand that not all the money you have
should be dumped into investments on the first day. The reason is that at first
any investor will make mistakes, and losses are sometimes inevitable. Invest in
a stock or two gradually, and keep some money in your brokerage account to put
into others. Besides, if you have all your money tied up in positions, then you
can't buy exciting value stocks that you have recently found. It's good to keep
in mind that if you miss one great opportunity, there are so many stocks that
there are many other great opportunities.
Dollar Cost Averaging
In addition, you will be unable to do dollar cost averaging
when you keep all your money in positions. Dollar cost averaging refers to
increasing your positions in your investments that have gone down in price. In
order to be able to perform this type of investing it is necessary to be
absolutely sure in your companies because this involves putting more money in
when the stock price goes down. This way you are able to increase your returns
by averaging down the entry price of the overall position. However, this cannot
work if the investor is unsure of his investments because this can lead to
increasing losses.
Set Specific Targets
This strategy will assert that an investor should estimate how
much he or she would like to pay for a stock, the set a limit order for that
amount so that when that price hits, the broker will automatically buy the
necessary shares. Therefore the investor does not have to sit in front of the
computer day in and day out tracking the stock. Let your broker do all the
work.
It is also necessary to set an exit strategy. This strategy
proposes setting a re-evaluation point and an exit point before even investing
in the stock. This means both directions. Know how low the stock will have to
go for you to re-evaluate, as well as how high. For price increases, set an
evaluation and target price for the stock. Estimate what price the stock has to
be when you think it should be re-evaluated. If you think it's a great company,
keep it and it will keep going up. But if you think it's time to sell, do it
gradually. Sell only a part of your shares rather than all of them. The idea is
the same as Dollar Cost Averaging, but works backwards. By making gradual
sells, the investor can still get a piece of further price increases when the
price reaches his target point. The same goes for price drops. Know at what
price you should re-evaluate your investment and consider cutting your losses,
and a price point at which you should sell to stop your losses. Sometimes it's
hard to admit a mistake, but doing so can save you from losing a lot more.
Emotion and Fluctuation In The Market.
It's necessary to understand that the market will not stop
fluctuating when you have money in it. In fact, it will probably seem to
fluctuate more when you have money in it. It's necessary to keep a cool head
and remember the reasons that you own the company and the reasons that would
cause you to sell. If none of those reasons have been reached, leave it alone.
The market will fluctuate, but it's important to remember that «Time helps
great companies and destroys mediocre ones.»47
Tracking Performance
To track performance, several things need to be kept in mind.
If your portfolio returns 4% annually, then what's the point when you can get
the same rate in a bond? The return of your portfolio needs to justify the risk
that you undertake. Furthermore, you must account for the capital gains taxes
on the returns that you get. A discussion on taxes is well out of the scope of
this paper, but it is a consideration to be made when tracking your portfolio's
performance. In addition inflation is another thing to consider. How much money
are you making after factoring out those factors? In addition, another factor
that must be considered in gauging your performance is the fees that you pay
your brokerage. If you pay $8 per trade, then it takes you $16 to enter and
exit a position. These calculations need to be taken into effect when
calculating portfolio return.
To track your performance with the individual stocks themselves,
you can track four factors: - Stock Price 3 months Before Purchase
- Buy Price
- Sell Price
- Stock Price 3 months After Sell.
Based on these factors you can determine whether you bought too
high, sold too low, and how well the Dollar Cost Averaging strategies helped
you out.
47 Robert Hagstrom, The Warren Buffet
Way(147)
Example
Explanation: Following is an explanation of the theory we have
proposed, because we believe that seeing it in action will provide a clearer
example for a beginning investor.
Stock Screener Criteria Used the 05/21/08:
ROE: 25% or more, and above industry average
PEG: Less than 1
Debt to Total Cap: 0 - 5% and below the industry average
Capitalization: Mid cap, $2-10billion
Returned 4 companies, and we picked HANS because of the stability
of industry, and because it's in our circle of competence.
|
Analysis Phase 1
|
|
#
|
Date
|
Company
Name &
Ticker
|
Current
Price
|
52 Wk
High /
Low
|
Market Cap
|
Daily $
Volume
|
Debt / Total
Capitalizati
on
|
Industry
Debt / Total
Cap
|
Return
On
Equity
- ROE
?
|
|
1
|
05/21/08
|
Hansen
Natural
HANS
|
$28.46
|
$68.4 /
$38
|
$2.7b
|
$5.8m
|
0.1% ?
|
54.60%
|
45.2%?
|
|
2
|
|
|
|
|
|
|
|
|
|
|
3
|
|
|
|
|
|
|
|
|
|
|
Analysis Phase 1
|
|
#
|
Industry
ROE
|
Insider
Ownership
%
|
Stock
Buyback
Plan
|
5yr Price
Appreciation
|
Current
P/E
|
Avg 5
Year P/E
|
Industry
P/E
|
Price to
Sales ?
|
|
1
|
30.90%
|
22
|
Yes
|
5366.00%
|
17.9?
|
23.86
|
19.2
|
2.83 ?
|
|
2
|
|
|
|
|
|
|
|
|
|
3
|
|
|
|
|
|
|
|
|
|
Analysis Phase 2
|
|
#
|
Ticker
|
Earnings Per
Share ?
|
Core Earnings
Per Share ?
|
EPS - Core
EPS
|
Core P/E
|
Net Earnings
Growth ?
|
Industry
Earnings
Growth
|
|
1
|
HANS
|
1.79?
|
$1.51
|
$0.28
|
27.46
|
62.7% ?
|
11.30%
|
|
2
|
|
|
|
|
|
|
|
|
3
|
|
|
|
|
|
|
|
|
Analysis Phase 2
|
|
#
|
Projected
Earnings
Growth
|
Quick Ratio ?
|
Current Ratio
?
|
Industry
Quick Ratio
|
Industry
Current Ratio
|
Dividend Yield
?
|
Sales Per Share
?
|
|
1
|
20.1
|
2.8?
|
4?
|
0.7
|
1.1
|
n/a
|
$9.15?
|
|
2
|
|
|
|
|
|
|
|
|
3
|
|
|
|
|
|
|
|
|
Analysis Phase 2
|
|
#
|
Free Cash
Flow / Share
|
Net Cash Flow
/ Share
|
Projected
High / Low
|
Value Line
Timeliness
|
Value Line
Safety
|
S&P Stars
Rating
|
S&P Fair
Value Rating
|
|
1
|
$1.08
|
$1.62
|
No access to value line
|
b
|
5
|
|
2
|
|
|
|
|
|
|
|
|
3
|
|
|
|
|
|
|
|
|
Analysis Phase 3
|
|
#
|
Ticker
|
Revenues to
Direct Costs
|
Cash Ratio
?
|
Gross
Margin ?
|
Growth Rate
Of Expenses
|
Growth Rate
of Revenues
|
Expense to
Revenue
Ratio ?
|
|
1
|
HANS
|
2.07
|
0.92?
|
51.20%
|
15.00%
|
45.90%
|
1.34%
|
|
2
|
|
|
|
|
|
|
|
|
3
|
|
|
|
|
|
|
|
|
Analysis Phase 3
|
|
#
|
Operating
Profit
Growth
|
Working
Capital
Turnover
|
Bad Debts to
Accounts
Receivable ?
|
Accounts
Receivable
Turnover ?
|
Inventory
Turnover
|
DCF
Valuation
|
Margin Of
Safety
|
|
1
|
4.33%
|
4.83%
|
n/a
|
12.10%
|
5.40%
|
$35.54
|
$7.08 / 27%
|
|
2
|
|
|
|
|
|
|
|
|
3
|
|
|
|
|
|
|
|
|
Company Strengths Company
|
Growth And / Or Value This is a value buy,
because the stock is currently undervalued by
|
Why Buy?
The company has an extremely small amount of debt and a huge
return on equity to shareholders. It is poised better than the rest of the
industry. The earnings prediction is 20% for the next five years, and DCF
valuation shows a 27% margin of safety.
|
|
The company's products are made to differentiate. It owns major
energy drink Monster which is a large competitor to Red Bull in the US. In
addition, France will be legalizing Red Bull and other energy drinks therefore
opening a new market for Monster.
Industry
|
|
a age g
Price Target
Long term hold
|
|
Increase Position Target $30
|
|
The industry outlook for this industry is neutral, projecting
steady growth in companies' earnings and cash flows.
|
|
Company Challenges.
|
Re-Evaluation Point
|
Why Sell?
|
|
$25
|
|
|
Industry
|
|
If the company begins to accumulate debt, or
|
|
The industry is threatened by the higher
|
|
if the ROE falls below 20% we will evaluate
|
|
costs of corn, and therefore HFCS, but
|
|
position. Also, we will watch the prices of
|
|
because it's so competitive, companies
|
|
HFCS and aluminum and predictions for
|
|
price increases will be passed to
|
|
those. In addition, if the legal arena for
|
|
consumer because if one company has to
|
Stop Loss Target
|
energy drinks changes, this may cause us to
|
|
increase prices because of increase in raw material cost, all
companies will have to do the sa me.
|
$23.50
|
re-evaluate.
|
In order to help a beginning investor understand our strategy,
we decided to put it into action on May 21, 2008. After running the stock
screener, we have picked one company which we have believed to be in our circle
of competence. Hansen Natural, which produces various non-alcoholic beverages
such as energy drinks and juice has a ticker of HANS. We have decided to
analyze this company as an example.
In order to find our data, we have relied on the information
provided by Scottrade in terms of financial statements. We have also used the
Reuters Research Report and the S&P stock report made available to us by
Scottrade. In addition, to gather our qualitative data, we have visited the
website of Hansen Natural and looked over the most recent 10q and 10k. The
purpose of this example is to show our strategy to the beginning investor and
giving an example of a great company.
In the case of Hansen Natural, after we have completed the
three phases of qualitative evaluation, we have been able to see several things
that made it a good investment. First of all, the debt to capitalization ratio
was extremely low (0.1%) and decreasing over the years, showing that the
company has been decreasing its debt and using mostly equity to produce
returns. In addition, the return on equity was 45.2% and higher than the
average of the industry showing us that the company is squeezing every last
dollar to make returns on investor capital. In addition, the company has grown
over 5000% in the past 5 years. The managers and employees are confident in the
future of the company even after the recent price drops because of the high
percentage of insider ownership. In addition, there is a $200m buyback plan
that was announced in April which means that the company plans to buy back
shares which will eventually increase the price. In addition, we believe the
industry outlook to be positive because of the high popularity of energy drinks
in the US. We have also calculated a value per share using DCF and have came up
with $35.54 and we feel comfortable with a 27% margin of safety provided to us
at the current price. Of course, these are not the only factors and investor
should look at, but weigh the importance of the ones we have provided him
Conclusion:
From all of our research, and our newfound familiarity with
the topic, we conclude that investing can be a great thing, but not performed
correctly it can lead to great losses. There's something in the market for
everyone, from the safety concerned investor to the strong stomached. One does
not have to take great risk to realize great gains, but to perform research and
to maintain a long-term outlook are the two most important tenets.
The strategy we have outlined does not show anything new, but
advocates diligent research and longterm investing. It combines the best
aspects of the strategies that have been proven to work to try to create an
idealistic hybrid. Of course, in order to have any academic significance it
still needs to be proven and doing so could involve a lot of work and data
collection. However, from our analysis of different sources, we believe that
the strategy we have synthesized will work by helping the investor pick
companies with strong assets that will perform well in the long run in a bear
or a bull market.
Bibliography
1. Ackerman, Alan R.. Investing Under Fire: Winning Strategies
from the Masters for Bulls, Bears, and the Bewildered. New York: Bloomberg
Press, 2003.
2. "American Stock Exchange." American Stock Exchange.
http://www.amex.com (accessed June 3,
2008).
3. "
Bigcharts.com."
Bigcharts.com.
http://bigcharts.marketwatch.com
(accessed June 3, 2008).
4. Blacklick, John . The Quotable Executive: Words of Wisdom
from Warren Buffett, Jack Welch, Shelly Lazarus, Bill Gates, Lou Gerstner, and
More. New York: Mcgraw-hill Companies, 2000.
5. Blitzer, David M, Ph.D, Robert E, Cpa Friedman, and Howard J
Silverblatt. Measures Of Corporate Earnings. New York, NY: Standard and Poor's,
2002.
6. "Bloomberg." Bloomberg.
http://www.bloomberg.com
(accessed June 4, 2008).
7. "Business Financial News, Business News Online & Personal
Finance News at
WSJ.com -
WSJ.com."
WSJ.com.
http://online.wsj.com (accessed June
3, 2008).
8. "Business News, Stock Market & Financial Advice -
BusinessWeek." Business News, Stock Market & Financial Advice -
BusinessWeek.
http://businessweek.com (accessed
June 3, 2008).
9. "BW Online | May 14, 2002 | Inside S&P's New "Core
Earnings"." Business News, Stock Market & Financial Advice - BusinessWeek.
http://www.businessweek.com/investor/content/may2002/pi20020514_4676.htm?chan=search
(l ast accessed June 3, 2008).
10. "Cash Flow Statement - The Indirect Method - Financial
Education - Everything You Need To Know About Finance." Financial Education -
Everything You Need To Know About Finance.
http://financialeducation.com/2007/03/26/cash-flow-statement-the-indirect-method/
(accessed J une 3, 2008).
11. "ClearStation : Welcome to ClearStation!." ClearStation :
Welcome to ClearStation!.
http://clearstation.etrade.com
(accessed June 3, 2008).
12. D., John, Jerald E., Thomas R., Dennis W., Cfa Mcleavey, Cfa
Pinto, Cfa Robinson, and Cfa Stowe. Equity Asset Valuation. New York, NY:
Wiley, 2007.
13. "DCA: It Gets You In At The Bottom ." Welcome to
Investopedia.com - Your Source for
Investing Ed ucation.
http://www.investopedia.com/articles/01/090501.asp(last
accessed J u ne 3, 2008).
14. "Discounted Cash Flow Calculator for Stock Valuation."
Moneychimp: learn Stock Investing, Index Funds, Valuation Models, and more..
http://www.moneychimp.com/articles/valuation/dcf.htm
(accessed June 3, 2008).
15. Fact Sheet -- Measures of Corporate Earnings for Equity
Analysis. New York, NY: Standard and Poor's, 2002.
16. "Financial Investment News - Stock Investing News -
Investment News -
Barrons.com." Financial Investment News
- Stock Investing News - Investment News -
Barrons.com.
http://online.barrons.com
(accessed June 3, 2008).
17. Fisher, Philip A.. Common Stocks and Uncommon Profits and
Other Writings. New York, NY: Wiley, 2003.
18. "
Fool.com: Stock Market Advice | Stock
Investing Advice ."
Fool.com: Stock Market Advice | Stock
Investing Advice .
http://fool.com (accessed June 3,
2008).
19. "Fundamental Analysis: Introduction." Welcome to
Investopedia.com - Your Source for
Investing Education.
http://www.investopedia.com/university/fundamentalanalysis/
(last accessed June 3, 2008).
20. Google Finance
http://finance.google.com (last
accessed June 3, 2008)
21. Graham, Benjamin. Security Analysis. New York: McGraw-Hill,
2004.
22. Graham, Benjamin, and Jason Zweig. The Intelligent Investor
Rev Ed. (Collins Business Essentials). London: Collins, 2003.
23. "Greatest Investors: Introduction." Welcome to
Investopedia.com - Your Source for
Investing Education.
http://www.investopedia.com/university/greatest/
(last accessed June 3, 2008).
24. Hagstrom, Robert G.. The Warren Buffett Way, Second Edition.
New York, NY: Wiley, 2005.
25. "Investor's Business Daily." Investor's Business Daily.
http://www.investors.com
(accessed June 3, 2008).
26. Jr., Robert G. Hagstrom. The Essential Buffett: Timeless
Principles for the New Economy. New York, NY: Wiley, 2002.
27. "
Kiplinger.com - Personal Finance,
Business Resources, Retirement and Financial Advice."
Kiplinger.com - Personal Finance,
Business Resources, Retirement and Financial Advice.
http://www.kiplinger.com
(accessed June 3, 2008).
28. Lehmann, Paul-Jacques. Bourse Et Marches Financiers. Paris,
France: Dunod, 2005.
29. Montgomery, Cynthia A.. Strategy: Seeking and Securing
Competitive Advantage. Cambridge, MA: Harvard Business School Pr, 1991.
30. "Morningstar." Morningstar.
http://www.morningstar.com
(accessed June 3, 2008).
31. "MSNBC - Stock Market News, Business News, Financial,
Earnings, World Market News and Information Front Page." MSNBC - Stock Market
News, Business News, Financial, Earnings, World Market News and Information
Front Page.
http://cnbc.com (accessed June 3,
2008).
32. "NASDAQ Stock Market - Stock Quotes - Stock Exchange News -
NASDAQ.com." NASDAQ Stock Market - Stock
Quotes - Stock Exchange News -
NASDAQ.com.
http://www.nasdaq.com (accessed June
3, 2008).
33. "NYSE, New York Stock Exchange ." NYSE, New York Stock
Exchange .
http://www.nyse.com (accessed June 3,
2008).
34. "Online Discount Brokers, Online Stock Trading, Stock
Investing, Mutual Funds, IRA - Scottrade." Online Discount Brokers, Online
Stock Trading, Stock Investing, Mutual Funds, IRA - Scottrade.
http://www.scottrade.com
(accessed J u ne 3, 2008).
35. "Online Investing: Stocks, Personal Finance & Mutual
Funds at
SmartMoney.com." Online Investing:
Stocks, Personal Finance & Mutual Funds at
SmartMoney.com.
http://www.smartmoney.com
(accessed June 3, 2008).
36. "The Outlook." The Outlook Online. www.spoutlookonline.com/
(accessed June 4, 2008).
37. "Outstanding Investor's Digest." Outstanding Investor's
Digest.
http://www.oid.com (accessed June 4,
2008).
38. "Relative Valuation: Don't Get Trapped ." Welcome to
Investopedia.com - Your Source for
Investing Education.
http://www.investopedia.com/articles/fundamental/03/111203.asp
(last accessed J une 3, 2008).
39. Schwager, Jack D.. Getting Started in Technical Analysis
(Getting Started In ). New York, NY: Wiley,
1999.
40. "SEC Info." SEC Info - the best EDGAR online database of
Securities and Exchange Commission filings & IPOs.
http://www.secinfo.com (last
accessed June 3, 2008).
41. St. Louis Fed: Economic Data - FRED St. Louis Fed: Economic
Research.
http://research.stlouisfed.org/fred2/
(last accessed June 3, 2008).
42. "Stock Market News, Investing Advice, Stock Picks and Quotes
-
TheStreet.com." Stock Market News,
Investing Advice, Stock Picks and Quotes -
TheStreet.com.
http://thestreet.com (accessed June
3, 2008).
43. Thomsett, Michael C.. The Stock Investor's Pocket
Calculator: A Quick Guide to All the Formulas and Ratios You Need to Invest
Like a Pro. New York: Amacom/American Management Association, 2007.
44. "Value Line - The Most Trusted Name in Investment Research."
Value Line - The Most Trusted Name in Investment Research.
http://valueline.com (accessed June
3, 2008).
45. "The Week Magazine - News reviews and opinion, arts,
entertainment & political cartoons." The Week Magazine - News reviews and
opinion, arts, entertainment & political cartoons.
http://www.theweekdaily.com
(accessed June 3, 2008).
46. "World Business, Finance and Political News." Financial
Times. http://www.ft.com/ (accessed June 4, 2008).
47. "World News, Business News, Breaking US & International
News |
Reuters.com." World News, Business
News, Breaking US & International News |
Reuters.com.
http://reuters.com (accessed June 3,
2008).
48. Yahoo Finance
http://finance.yahoo.com (last
accessed Jun 3, 2008)
Appendix
S&P reports on Hansen Natural
Figure 10 - S&P Report for HANS
Source: Standard and
Poor's
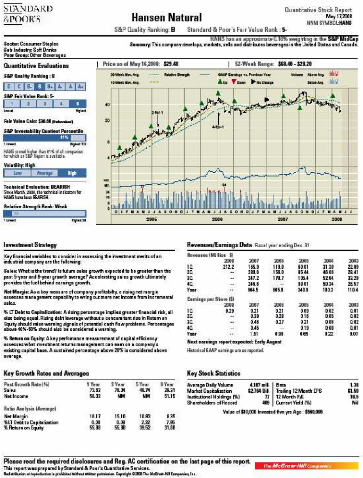
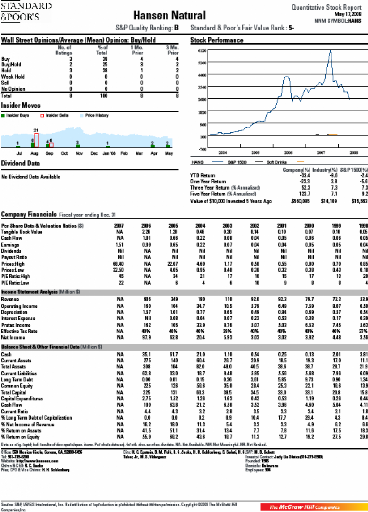
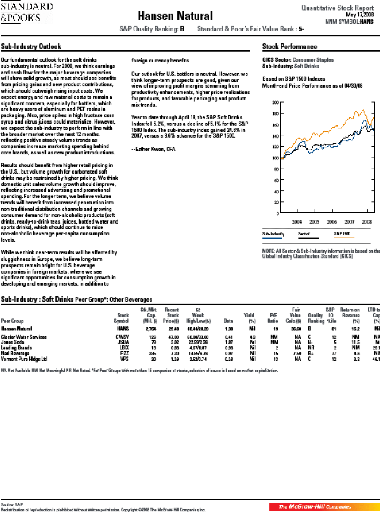
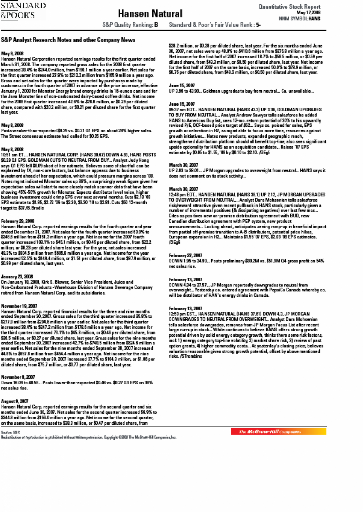
107
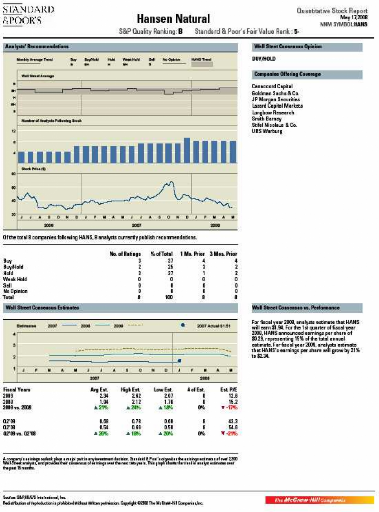
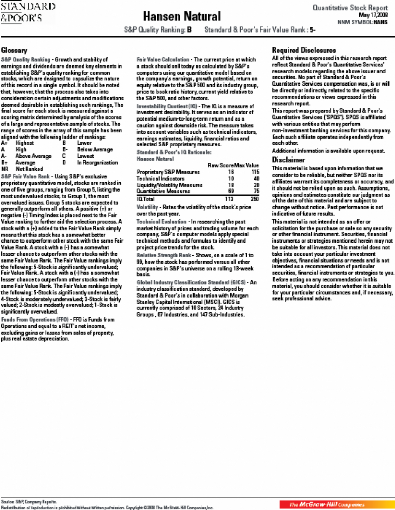
Reuters report on Hansen Natural
Figure 11 - Reuters Report For Hansen Natural
Source -
Reuters


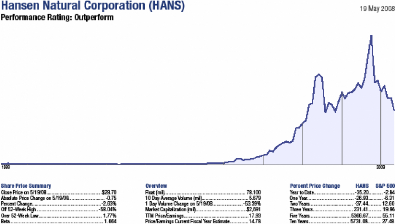
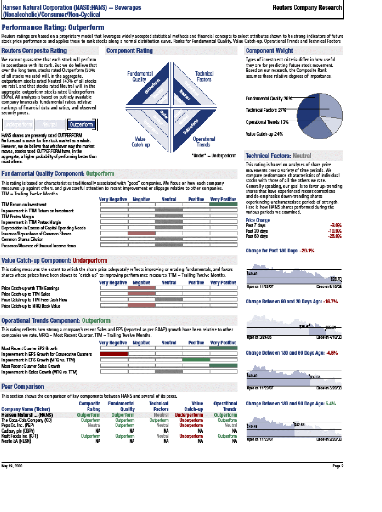
111
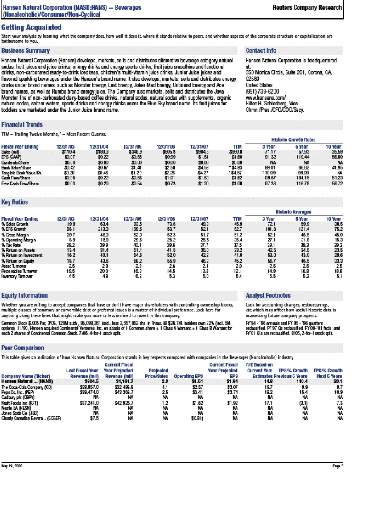
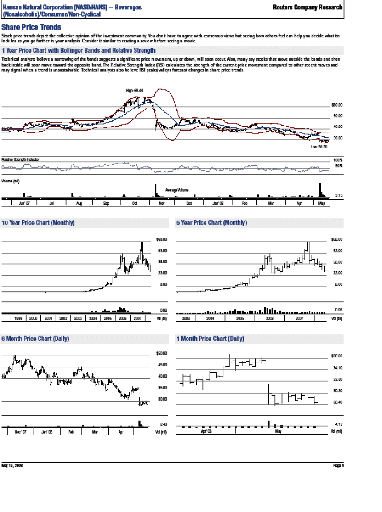
113
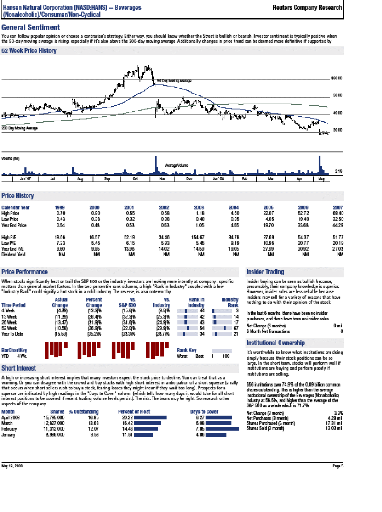
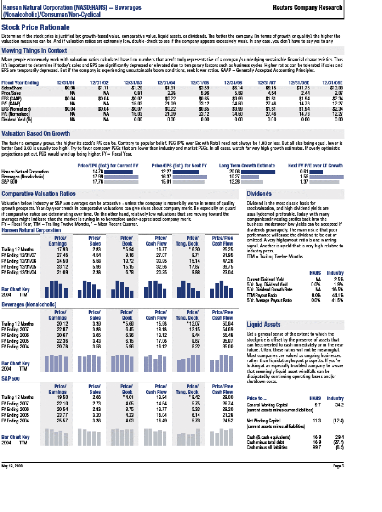
115
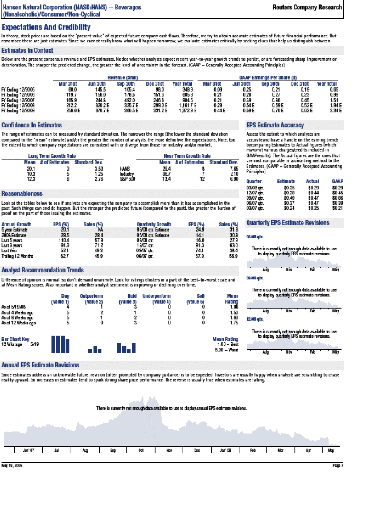
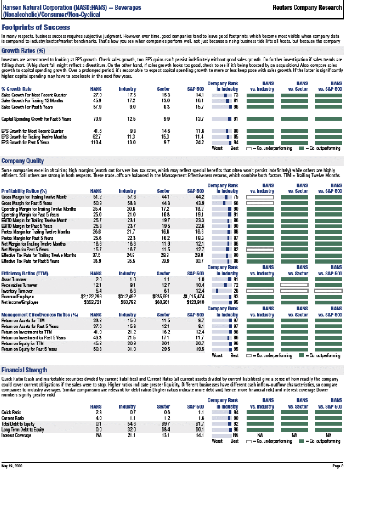
117
| 

