In order to understand quantitative fundamental factors, it
is necessary to understand where they can be found. Most of these factors can
be found in a company's financial statements. However, at the first look, these
can be extremely intimidating due to the extremely large amount of different
numbers and definitions on each. The three most important financial statements
of a company are the income statement, balance sheet, and statement of cash
flows. These can be found in either the investors packet along with the annual
report and can be obtained by calling investors relations, or by simply looking
up the company in a financial website such as Google Finance and looking at
these electronically. Following is a brief description of each statement and
some of its most important sections.
Balance Sheet
The balance sheet is a representation of assets, liabilities
and equity of a company at any given point in time. All balance sheets, at the
beginning say «As Of DATE.» This is important to understand because a
balance sheet is a snapshot of the company's financial situation at that given
point in time. It does not track changes over periods of time, but is rather a
clear picture of one point in time in the day of the company's life. The
premise of the balance sheet is that well, it balances. The businesses
financial structure balances in the following manner:
Assets = Liabilities + Stockholders Equity
Figure 1 - Balance Sheet
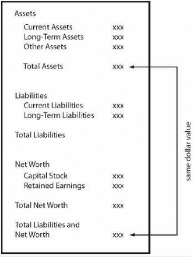
Source: Stock Market Investor's Pocket Calculator (113)
Assets
The resources that business owns or controls at the time
specified on the balance sheet. These can range anywhere from the stapler on
the secretary's desks, to the trucks that transport machinery, to the computers
that the IT department manages, and the building where it's based to the liquid
cash that's available in a company's bank account. They are further broken down
into categories called current assets, long term assets, and other assets.
Current assets
They are either cash, or can be easily converted to cash
within the nearest 12 months. This section of the balance sheet contains three
very important items crucial to company analysis. These include cash,
inventories, and accounts receivable.
Cash
Generally, investors are attracted to companies with a large
amount of cash on their balance sheets, believing that cash offers protection
from hard times and the ability for a company to quickly take advantage of
emerging business opportunities. And a growing cash account over several
business cycles indicates that cash accumulates so quickly that management
doesn't know where to put it. However, if a balance sheet's cash account seems
to hold an abnormally large amount of cash over several business cycles, a
question should pop up in every investor's mind as to why the money is not
being put to good use. Is the management too short sighted to do anything with
it? Has it run out of investment opportunities? These are questions that need
to be asked by every critical investor.
Inventories
Products that the company is keeping in warehouse and is ready
to sell. It is good to know if the company has too much money tied up in
inventory that it cannot move or is hard to move. If the company is not selling
what it has in stock at the warehouse, they cannot make the cash to pay bills
and make a profit. Receivables
Anything that is owed to the company. Finding out the speed
at which a company collects debts owed to it can tell a lot about how efficient
the company is financially. The collection period should not be growing longer
because that would mean that the company could be letting its customers stretch
their credit in order to increase its sales, but is not actually generating
cash. If when it's time to pay back, the customers don't have the cash to pay
because of a bad economy for example, the company could wind up in trouble.
Long term assets or non-current assets
They are capital assets minus accumulated depreciation. These
could be fixed assets such as buildings, machinery, and property. Unless the
company starts liquidating, these are not very important.
Other Assets
That includes any tangible or intangible assets such as
goodwill, prepaid assets such as insurance and
others.
Liabilities
Liabilities and Shareholders' Equity comprise the other side
of the balance sheet equation. They represent the total value of the financing
that the company has used to acquire those assets. If liabilities were used,
then the money to acquire assets came from loans and the company owes money to
banks or other lending agencies. These are also further subdivided into current
liabilities, and non-current liabilities.
Current Liabilities
Current liabilities are debts that the firm must pay off within
the nearest twelve months. These can include payments owed to suppliers and
other immediately payable expenses.
Non-Current Liabilities
Non-Current Liabilities are debts that need to be paid off in
over one year. These are usually debts to banks and bondholders.
Investors should look for a small amount of debt that is
preferably decreasing over the reporting cycles. The company should have more
assets than liabilities in order to be able to pay them all back and not go
bankrupt.
Shareholder's Equity
If the acquisition of assets financed by liabilities means
borrowing money from banks and other lending institutions, the acquisition of
assets financed by shareholder's equity means using the money gained from stock
sales to acquire them. It can be determined by the following formula,
Equity = Total Assets - Total Liabilities
Paid-In Capital
This is the amount that the shares were worth when they were
first sold. As discussed previously, the markets that the average investor
purchases from are secondary, and the prices of the stocks of those markets do
not affect a company's bottom line. Paid-In Capital discloses how much money
was made from the stock sales by the company.
Retained Earnings
They are the amount of money that the company has gained from
selling its stock that the company has used to reinvest in itself instead of
paying it back to shareholders in the form of dividends. An investor should
look how well the company puts this money to use and how it generates return on
this money.
Income Statement
The income statement is where all the juicy numbers are
located that always show up in the news. Figures like revenues, expenses,
profits and earnings per share and expressed on this statement. The main reason
for analyzing the income statement is for an investor to figure out if the
company is making money. Unlike the balance sheet, the Income Statement begins
with «For The Period Ending... Date.» This is to specify that the
income statement is a record of a certain amount of time in the company's life.
If the balance sheet is a picture, then the income statement is a short film.
The main formula that governs the income statement is:
Profits = Revenue - Expenses
Figure 2 - Operating
Statement
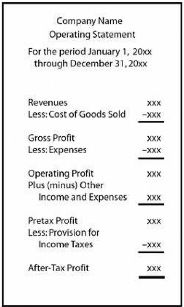
Source: Stock Market Investor's Pocket Calculator (136)
Revenue
Revenue or its synonym, sales, is how much money a company
has made over a certain period of time covered by the income statement. This
number is the main driver for the profitability of a company. However, since
profit, or earnings equal revenues minus expenses, it is good for the expenses
to be going doing while the revenues are going up.
COGS - Cost Of Goods Sold
This can be the sum of several different accounts. These can
include merchandise purchased for sale or manufacture, the cost of shipping,
salaries and wages that are paid out to employees that are in positions
directly related to revenues, and changes in inventory levels from the
beginning to the end of the reporting period. It is important to understand the
difference between costs and expenses. Costs should follow revenues very
closely, as they are essentially the cost of generating those revenues. So when
revenues go up, the costs will most often go up as well.
Gross Profit
This is the number obtained when subtracting costs from
revenues. This number should also vary along with sales. A gross profit that
fluctuates wildly from one period to the next could mean a merger or
acquisition, a new product, a sale of an operating unit, or a change in an
inventory valuation method. Further research should follow such a
phenomenon.
Expenses
Unlike costs, expenses do not vary alongside revenues. This
category includes all the money leaving the company that is not in direct
relation to revenue production. It is very important to note the difference
between costs and expenses. The relationship between costs, expenses, profit
margin and revenues is demonstrated Figure 3.
Figure 3 - Operating Statement with Controlled Expenses
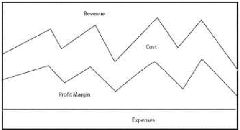
Source: Stock Market Investor's Pocket Calculator (138)
As can be seen from the graph above, as revenue varies, the
costs vary alongside them, while expenses stay relatively unchanged. This
assumes that expenses are controlled. When revenues increase, so does profit
margin, making more money for the company that the expenses are not eating up.
However, consider the following graph with uncontrolled expenses.
Figure 4 - Operating Statement with Uncontrolled Expenses
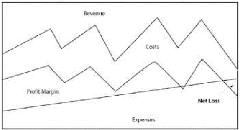
Source: Stock Market Investor's Pocket Calculator (139)
This chart represents a company who is unable to successfully
manage its expenses, one of the usual reasons for this phenomenon being lack of
good internal controls.15 The level of expense rises over time
15 Michael C. Thomsett, Stock Market Investors Pocket
Calculator
eventually turning profit margin into loss. The profit margin
is shrinking when revenues are on the rise and when they are falling, which is
not a good thing for any company. A company with a relationship like this
between profit, revenues and expenses should be avoided at all costs by any
investor.
Expenses can also be further broken down into two categories
called selling expenses and administrative costs or overhead. Selling expenses
are related to the generation of sales but not directly, like costs. Overhead
can include rent for the office, wages of employees not directly related to
revenue generation, office supplies and electricity. These usually recur each
year.
Operating Profit.
This section discloses the profit made from operations which
will be the same or close to core earnings as defined by S&P (Discussed
Later). This number may often not be reliable, because even with GAAP it is
possible for companies to distort this number by creative accounting.
Other Income and Expenses
This is a series of additional adjustments from the non-core
section. For the income part, these can be profits from sale of capital assets,
currency exchange adjustments, or interest income. For the expense part this
could be losses from sale of capital assets, currency exchange losses and
interest expenses.
Pretax Profit
After subtracting expenses and adding income from the other
income and expenses section to operating profit, this is the number that is
determined. This is the value used to report net earnings.
Provision For Income Taxes
This is the amount set aside by companies to pay income taxes.
This value can change based on what country or state the company operates in,
its tax liability changes and other such variables.
After Tax Profit
This is the final net profit or loss, and the value used to
calculate Earnings per Share (Discussed Later). The problem with this measure,
however is that since this bottom line is subject to many nonrecurring and
non-core adjustments and other factors, the investors cannot compare two
different companies on the same level using EPS.
The income statement can provide some valuable knowledge
inside a company. Increasing sales shows a sign of good fundamentals, rising
margins can indicate increasing efficiency and expense control. It's also good
to compare the company with its industry peers and competitors to see how other
companies fare against the one you are researching.
Statement Of Cash Flows
This statement shows how much cash moves in and out of the
company over the quarter or year. This is also calculated for a specific period
like the income statement, but there is a big difference. Accrual accounting
requires companies to record revenues and expenses when the transactions occur,
not when cash is exchanged, and this type of accounting is used on the income
statement. For example, when the company shows a net income of $20 Million on
the income statement, that does not mean that he cash account on the balance
sheet will increase by $20 Million. The cash flow statement is more
straightforward, and when it shows $20 million cash inflow, the cash account on
the balance sheet is exactly what changes. It shows the
company's true cash profit. It shows the investor how the
company is able to pay for its future growth and expansion.
As a matter of fact, every investor should look for a company
that can produce cash. Just because profit shows up on the income statement
does not mean that the company won't get in trouble later because it does not
have enough cash flow.
Figure 5 - Statement Of Cash Flows
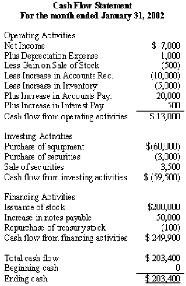
Source: http://financial-education.com/
The cash flow statement is subdivided into three different
sections. The following paragraphs will discuss them in more detail.
Cash flow from Operating Activities
This section provides the investor with information on how
much cash moves in and out of the company from the sales of goods and services
and from the amount needed to make and sell those goods and
services. Net positive cash flow is
always preferred, but high growth companies, such as technology companies will
show negative cash flow in this section during their first several years. Also,
changes in this section offer a forecast of changes in net future income.
Cash Flow from Investing Activities
This section shows how much cash the company spent acquiring
capital and any other equipment necessary in order to keep the business
running. It also includes mergers and acquisitions, and monetary investments.
It's good to see a company reinvest in itself by at least the rate of
depreciation expenses yearly. If that doesn't happen, the next year it could
show artificially inflated cash flows which would be fake.
Cash Flow from Financing Activities
This section describes the moving of cash associated with
outside financing. These can be the sales of stock or bonds or bank borrowings.
Also, paying back debt to a bank or dividend payments and stock repurchases are
all reflected here.
Reliability credibility core earnings
Before further discussing how to analyze the financial
statements presented above, it is necessary to make a distinction between what
is reported on the financial statements and what the real numbers may be. When
financial statements are prepared, they must follow GAAP, or generally accepted
accounting principles which were standardized by the SEC in order to avoid
accounting scams by companies. In addition, the Sarbanes- Oxley Act passed
after the Enron scandal prevents the same accounting firm that does the
auditing of financial statements to do consulting for the company. Discussing
this further is outside the scope of this thesis, but it will suffice to say
that the numbers on the financial statements may not always tell the whole
story, and the investor, in his or her analysis must dig deep and find the true
numbers often by him or herself.
Standard and Poor's Corporation developed the concept of
«core earnings,» or earnings from a primary product or service and
excluding nonrecurring items16, and at the time it was estimated
that the corporations under the S&P 500 index had their earnings overstated
by 30% the first year the adjustment was calculated.17 Therefore, it
stands to reason that using the core net profit and core net worth as a
reliable means for calculating the formulas and ratios that will be described
below will provide a clearer picture of a company's financial situation. Things
that can be excluded from financial statements that are GAAP approved are stock
options granted to executives or employees which can be huge if cashed in.
Contingent liabilities such as lawsuits that have not been lost yet but will
most likely be also escape the financial statements. Core earnings adjustments
account for these and therefore make sure that the financial statements tell
the actual position of the company excluding any one time revenues and
including hidden expenses. This allows the investor to look at the financial
statements and compare trends of how the company is doing and how it may grow
in the
16 S&P Core Earnings FAQ
17 «2002 S&P Core Earnings,» Business Week Online,
October 2002; through June 2002, reported profits for the 500 corporations
totaled $26.74 per share versus a core net profit of only $18.48, a reduction
of 30%.
future. These data can be found in the S&P's stock reports
service, (APPENDIX) which most brokers will provide.
It also stands to reason that a big difference between core
earnings and reported earnings may serve as a big red flag, because companies
with such a large difference could be using shady accounting practices. Well
managed companies tend to have a low core earnings adjustment in most years.
However, in some cases, when a unit has been sold off or an acquisition made,
sometimes the adjustment may be large. Also, companies with low core earnings
adjustments tend to report lower than average volatility in stock price.
Looking At Ratios
A ratio or a percentage tells the investor nothing. It's just
a number. They become much more powerful in comparison with those from previous
years or compared against industry and competitors to judge a company's
strength and growth. The real key to determining value of a company is whether
the key ratios that judge its performance have been growing and if it's
outperforming the industry on average. Furthermore, because of the sheer number
of comparisons that can be made between different factors influencing the
company, it is up to the investor to judge what ratios can be used and when.
Tracking all of these ratios can be impractical and time consuming, and for the
investor who has other things to do is just plain stupid. For example, in
retail intensive industries, it's worth looking at inventory indicators while
the number rarely matters in the financial sector or the software industry.
Think of the following section as a toolkit rather than an analysis sheet for
evaluating companies, and then when planning and researching investments, use
the tools that will provide the best picture.
Return On Equity
ROE answers the question of how well did the company but its
capital to work in order to make money. Since corporations are responsible to
their shareholders, who want to gain a better return on the money they invested
in that specific company rather than investors who invested in its competitor.
Return on equity measures how well the company put the money that investors
gave it to work. The basic formula for return on equity is as follows:
The result is expressed as a number of turns. This shows how
many times the working capital has generated its value in revenues. As part of
a bigger long term trend, it shows how effectively management controls its
funds.
Where It Can Be Found: While most financial websites will not
have it, brokerages a lot of times provide a research report for a stock
compiled by Reuters which will provide this number. If not, it can be
calculated.
20 Michael C. Thomsett, Stock Market Investors Pocket
Calculator
Accounts Receivable Tests
The accounts receivable account is a current asset account
representing the balance of the money owed to the company by its customers.
Since not all customers pay their debts, there is a reserve account for bad
debts. Since in accounting, every credit must be offset by a debit, credits to
the reserve account are offset by a debit to the expense account. In other
words, increasing reserve for bad debts results in a larger expense for bad
debts. When certain accounts receivable are identified as bad debts, they are
removed from the asset and from the reserve. The net asset includes the bad
debt reserve and the asset account.
The company bases how much it wants to place into the reserve by
recent history of bad debts. The reserve is only an estimate.
Bad Debts to Accounts Receivable
This formula tests the corporate policy regarding reserve
requirements and is expressed as a percentage. This should remain fairly level
even when receivable levels grow.
B / A = R
B = Bad Debts Reserve
A = Accounts Receivable
R = Bad Debts to Accounts Receivable Ratio
Where It Can Be Found: Most stock screeners and financial
websites will not include this number and the investor will have to calculate
it himself.
Accounts Receivable Turnover
This is a way to compare receivable levels to credit-based
sales. The relationship between the two accounts should be consistent, and if
accounts receivable is increasing at a greater rate than credit sales, working
capital could be in danger.
S / A = T
S = Credit Sales
A = Accounts Receivable
T = Accounts Receivable Turnover
Where It Can Be Found: While most financial websites will not
have it, brokerages a lot of times provide a research report for a stock
compiled by Reuters which will provide this number. If not, it can be
calculated.
Average Collection Period
This is a very important test of how the company is managing
the money that is owed to it. According to many studies, the longer that the
money is owed to a company, the more chance it has of not getting paid back. In
addition, during times when revenues are expanding, companies sometimes relax
collection efforts and internal controls. If historically, the period for
collection has been 30 days and all of a sudden spikes up to 45, there is a
problem in collection procedures, and even if the company is doing good does
not mean it should relax and stop collecting the money owed to it.
R / (S / 365) = D
R = Accounts Receivable
S = Annual Credit Sales
D = Average Collection Period
Where It Can Be Found: This must be calculated
Inventory Tests
Inventory is a current asset and is the value of the goods
the company holds for sale. When looking at retail organizations or other
organizations with significant inventory levels, inventory turnover is
important to determine how fast the company is selling its products and
effective management is at controlling inventory levels so that storage and
maintenance costs are not running up.
Average Inventory
In order to determine this, average inventory needs to be
calculated. The reason for this is because companies like retail stores or
manufacturing companies may maintain different levels at different times
throughout the year due to customer demand or sales cycles. To calculate
average inventory this is the formula.


