Technical Analysis
While fundamental analysis is focused on looking back at the
financial trends, the focus of fundamental analysis is looking forward and
trying to predict what will happen with the stock price. It is focused on how
the day's price, volume and trading trends will affect the price in the future.
It is important to remember that technical and fundamental analyses are not
exclusive, but are usually used in conjunction with one another by successful
traders. Neither point of view is considered «right» since any
analysis is essential an estimate, but the more information the investor has,
and the more data he or she can gather, the more confident he or she can be in
his decisions. Just like looking at only history data and ignoring price trends
is a mistake, while only looking at price without checking profitability is
similarly misguided.
Furthermore, technical trends are very important for
identifying risk levels. Even a company who has great management, growing
revenues, and growing dividends may have high volatility levels in price. After
all, the shares in the market are priced and move based on supply and demand.
Oftentimes, companies with similar fundamentals may have wildly different
volatility levels which define market risk and any investor would be stupid to
ignore those facts.
In addition, numerous technical signals could predict changes
in fundamentals. For example, a change in the volatility of the stock price can
predict earnings surprises. If a share is bought and sold 50,000 times a day,
the investor can use the combined knowledge of the traders by looking at the
charts to predict his or her own moves.
Introduction to Technical Analysis
Technical analysis is based on one thing: the stock price and
the trends in price movement. Volume is also key to considering the movement of
a stock's price. The main idea of technical analysis is to attempt estimate the
next direction the stock's price will move and to invest either in a short or
short term position. Technical analysis can also be used to estimate hold and
sell decisions as well. To do this more successfully, techniques such as chart
watching, price and volume formulas and observations of trading ranges are
employed by the investor.
Technical analysis originates from the Dow Theory that stock
prices tend to act in concert. Some very specific concepts determine how trend
analysis takes place. The first time frame technicians look at is the tertiary
movement or the daily trend of the market, not reliable for estimating long
term trends. The next is the secondary movement measured on the 20-60 period
and this movement reflects current sentiment. Finally, the primary movement can
go on from several months to several years, which is what is used to determine
if it's a bull market or a bear market.25
Current Price
This is the price the stock is currently trading at.
52 Week High / Low Price
The highest and the lowest price within the last 52 weeks, or
one year.
25 Jack D. Schwager, Getting Started in Technical
Analysis
Daily Dollar Volume
This tells the investor how much money trades in the stock on
a given day, determining how liquid the stock is, or how easily it's bought and
sold. The thing to keep in mind is that most mutual funds won't touch stocks
with low dollar volumes because it may be difficult for them to sell the stock
in the future because they trade in very large lots. The bare minimum trading
volume should be no less than $50,000 a day. Small cap investors will look for
low daily volume, less than $ 3 million so that the mutual funds are not
touching it. When the volume spikes, the mutual funds will go for the stock if
it's a good value, and the price will increase.
Chart Patterns
The whole premise of technical analysis is the study of price
and its patterns. There are several specific price patterns and concepts that
form the basis of technical analysis. In addition, the purpose of computing the
market mood and directions is not just to make good timing decisions, but also
to judge risk and volatility. Viewing price trends demonstrates the risk /
reward relationship. If the price movement is volatile, there is a greater
chance of upward movement, but also a greater chance of lower movement.
Conservative investors would rather accept lower volatility as a trade off for
smaller returns.
Trading Range, Resistance, Support
Volatility is defined by the trading range. Usually, the
prices of stocks establish a range of number of points in which they trade. If
the price breaks through this range, it's a significant event forecasting a new
rally or decline in the price level. Also, technicians will look at the stock's
price level approaching the upper or lower limits two or more consecutive
times, attempting to break through, and event called the breakout. If that
happens, it's usually a signal that the price will move in the opposite
direction.
Figure 7 - Trading Range, Resistance, Support
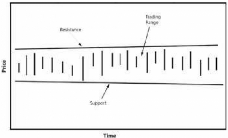
Source: Stock Market Investor's Pocket Calculator (159)
The upper trading limit is called the resistance level and is
the highest price in the current trading range. The lower level is called the
support level which is the lowest price of the stock. Once these have been
crossed, the trading range could become more volatile, until a new range has
been set. It is also necessary to point out that trading range changes may
foreshadow things like earnings surprises or meeting or not meeting earnings
expectations, causing the stock price to go up or down.
Head and Shoulders
A classic charting pattern is named head and shoulders, named
because it involves three high prices with the middle price being higher than
the first and third.
Figure 8 - Head and Shoulders Charting Pattern
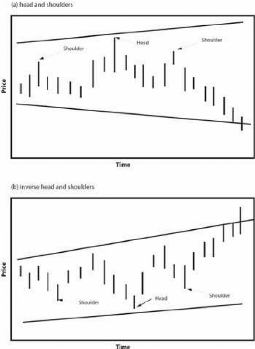
Source: Stock Market Investor's Pocket Calculator (163)
It is seen as an attempt of the price to break through the
resistance, and once the price retreats without breaking through, the pattern
forecasts a price retreat. The inverse head and shoulders pattern indicates the
opposite, and forecasts a pending price rally. 26
26 Michael C. Thomsett, Stock Market Investors Pocket
Calculator
Gaps
Gaps occur when the price closes at one level one business
day, and opens above or below the trading range of the previous day (highest
and lowest price). Gaps are important because they imply major changes in
trading range and interest among buyers or loss of interest among sellers.
Figure 9 - Gaps
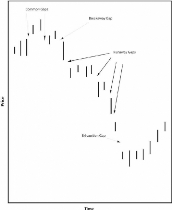
Source: Stock Market Investor's Pocket Calculator (165)
Four kinds of gaps exist that are worth looking at:
· Common gap is part of daily trading and implies
nothing
· Breakaway gap pushes the price into a new territory and
does not fill during further trading
· Runaway Gaps are several gaps over a few days moving the
price in the same direction.
· Exhaustion gap is usually large signaling the end of the
runaway pattern. After this gap, the price usually moves in the opposite
direction. 27
Other Patterns
There are many other patterns that are used by technical
analysts, but these represent the major ones and are the most important for
forecasting. In addition, it is out of scope of this paper to go into full
detail on technical analysis. Trading the range of the stock reveals the degree
of volatility and market risk. The trading range is the best value of risk.
Further Measuring Volatility through Formulas
To the technician, the price volatility is of central issue. A
smaller trading range implies lower volatility. Therefore, even as price levels
change, the trading range may state the same. However, if the trading range
begins to widen or narrow, it is a sign of coming change. Even though it is
possible to calculate the price
27 Jack D. Schwager, Getting Started in Technical
Analysis
volatility by subtracting the 52 week low price from the 52
week high price and dividing it by the low price, this formula is not entirely
accurate. Any investor that has looked at a stock chart measure the performance
over the course of a year knows that spikes in price of a stock are imminent.
Most often, these spikes do not represent the trading range well because they
are abnormal, and therefore, they should be adjusted for. A spike can be
defined as a price that is outside of the trading range substantially and the
price trading immediately returns to normal trading levels, and the spike is
not repeated. The formula proposed for calculating volatility is adjusted
volatility.
|
(H - L) - S = V
H = 52 Week High Price
L = 52 Week Low Price
S = Price Spikes
V = Point Based Spread Volatility
|
Beta
Beta is a measure of systematic risk of a security, as
compared to the market as a whole. A good way to understand beta is how a
return of a security moves with the market. Beta is calculated using regression
analysis and is often used in the Capital Asset Pricing Model, which is out of
the range of this paper. However, it is useful for an investor to know the Beta
of a company in order to understand how risky a security can be. A beta of 1
indicates that the price of the security moves along with the market. If the
market moves up one point, the stock moves up one point. A beta that's greater
than 1 is an indication that the security is more volatile than the market. For
example a lot of stable companies such as utilities will have a beta of less
than one, meaning that the investor can expect less volatily, but he or she
gives up a higher return. However, on the other hand, technology stocks have a
beta greater than one indicating that in order to get the possibility of a
higher return that comes with purchasing a tech stock, the investor needs to
take on additional risk.
Combined Testing
There is a large debate about whether technical analysis is
more reliable or better than fundamental analysis. But the main point is, who
cares? Smart investors will use both to their benefit and succeed in the
market. Both offer useful information to make good decisions as an investor. In
fact, each side is valuable for interpreting trends in the other side. For
example, when there is a lot of difference between reported earnings and core
earnings, stock volatility tends to increase, and when the investor analyzes
the stock from a technical standpoint, his suspicions can be affirmed.
Furthermore, it is necessary to note that technical and
fundamental analysis are compliments to each other, rather than two directly
opposing theories of valuing securities. A long term investor will focus on
fundamentals to make sure he or she is buying a good company. That's great
because in the long run fundamentals are what really determine the market price
of the stock. However, in the short term they do not work, and technical
analysis must be relied on. Therefore a speculator will use those techniques to
make his or her decisions.
Finally, what this section will talk about is factors that
combine fundamental indicators along with technical indicators, and these are
the most watched factors for any security.
P/E Ratio
The major indicator that combines fundamental and technical
information is the P/E ratio. Annual P/E and Quarterly P/E
|
P / E = R
P = Current Stock Price
E = EPS (Annual or Quarterly)
R = P/E Ratio
|
Basically, the ratio determines the multiple of earnings that
the current prices consist of. So for exam ple a P/E of 10 means that the
current price is 10 times greater than that latest EPS. It fol lows that the
P/E that is calculated and shown on most financial websites is based on
unadjusted EPS. What the investor needs to do is to adjust it based on Core
EPS. Therefore instead of calculating P/E as Price / Earnings per Share,
calculate it as Price / Core Earnings Per Share, calculated earlier.
The importance of P/E ratio is important in determining
whether the stock is currently trading at bargain levels. This is critical to
the value investor. When the stock price is driven up, the P/E follows, and the
investor could tell if the stock is overpriced or not. A good way to narrow
down the investments is by using a stock screener and eliminating all stocks
trading above a certain P/E.
Another advantage of the P/E ratio can help the investor set
entry and exit points into position based on this ratio. If the P/E falls too
low, the investor may want to sell, and if it goes very high, he or she may
want to sell at the high point. In addition, comparing P/E to Core P/E can be a
great test of volatility.
It also helps to determine the average P/E Over the past several
(usually 5) years:
Average P/E over N Number Of years
|
(P/E1+ P/E2+ P/En) / N
P = Current Stock Price
E = EPS (Annual or Quarterly)
R = P/E Ratio
|
Comparing this with the current P/E can help to determine if the
stock is overpriced or under priced more than usual.
Problems with P/E
While the P/E is widely used, it is potentially unreliable
when the earnings figures used are quarterly, and that is what one would expect
to find on the financial websites. For example, in the retail industry the
report that comes out December 31 has the highest earnings, because of the
holiday season. If the P/E calculation takes place using those numbers, it
could be very unreliable. However, even when tracking annual P/E reliability
problems come up because the annual P/E could easily become outdated several
months after the annual report.
Overcoming P/E Problems
They key is to measure annual P/E and track its historical
trend, as well as measure quarterly P/E and track its trend as well. Also,
evaluate year-end P/E and price range next to current quarter data. If the
investor discovers that the current P/E is out of range with the year-end
historical P/E, it could be that information is
flawed and a lot has changed since the earnings that the
investor is using. Also, it is necessary to confirm P/E changes by comparing
other ratios such as price to revenue, book value per share, and cash. This is
valuable in improving the reliability of information and determining if the
current price is typical or not by looking at trends.
PEG Ratio
The PEG ratio is popularized by Peter Lynch, but is more of a
rule of thumb than a mathematical ratio. According to Lynch, a P/E of a company
that's fairly priced will equal its growth rate. This usually works better for
growth stocks than it does for value stocks. PEG ratio is calculated as
PE/Projected Earnings Growth Rate over the next 5 years.
Price to Sales or Revenue
Price to Sales is calculated as fol lows
|
P / S = R
P = Current Stock Price
S = Sales Per Share
R = Price To Revenue Ratio
|
The price to sales ratio can also get the investor more
information if for some reason he or she is unable to determine core earnings
of the company. Because this compares sales, which usually tend to be the core
sources of revenue for the company, they may provide a clearer picture. It is
also useful to compare it in situations where earnings are flat as a percentage
of revenue, but grow each year. In this case the P/E may not be very revealing,
but the Price to Sales ratio may provide a better view.
| 

