DEDICATION
This work is dedicated to
The almighty God in whom my life got a meaning
through his
Son Jesus Christ of Nazareth
To my late parents, Mama FOUONDO MOMO
Antoinette and Dr FOUONDO COCKNEY.
Thanks for always standing by me. It is because of your conviction that I got
where I am today, I will never forget you.
To Mr. NGOUANE Martin for all his support and
encouragement
And
To my lovely husband DOUNTSOP KENNE Bruno and
kids KENNE FOUONDO Rolland Martin, KENNE MOMO James Steve and KENNE
KENNE Israel Nathan
ACKNOWLEDGEMENT
A research document like this could not have been realized
without the assistance of certain people to whom I testify my sincere
gratitude.
I wish to acknowledge the assistance of my supervisor
Prof OBEN ENYONG Julius, who inspite of his numerous
responsibilities, corrected and guided me throughout this project. Accept my
sincere gratitude.
I wish to extend my immense appreciation and thanks to my
director Dr FOKUNANG Charles, who designed my research topic
and closely followed up this work to its completion. His critical review has
contributed to the output of my write up.
Many thanks to Pr ETOA François
Xavier, Head of Department of Biochemistry and to all the
lecturers of the Department of Biochemistry, University of Yaounde I,
who provided suitable lectures necessary for my training.
My profound gratitude and appreciation also goes to Dr
NGONDI Judith Laure for her technical and moral support for the
success of this work.
Great appreciation also goes to Dr NGAMENI, Mr. NONO
BORGIA, Mr. NANA Frederick and all the elders and colleagues of the
Laboratories of Natural Product-Phytochemistry and Toxicology (FMBS) who
assisted in the harvest, extraction and phytochemical screening of Ficus
ovata vahl.
My profound gratitude also goes to Miss
NYANGONO Christine for all her devotion, who
welcome me in the field of research and took me through the laboratory set
up.
Many thanks to Pr FOKOU Elie , Pr.
MINKA Samuel, Mrs MBONG Angie and to all the members of the Laboratory
of Food Science and Metabolism especially my close colleagues: BEYEGUE
Eric, ESSOLA Nadine, ESSOUMAN Florine, NGUIMKENG SIGNING Boris, MAPTOUOM Laure,
MECHUM Pamela, NGO NLEND Marguerite, NGUELE Raymond, NKOUGNI Jacob,
for their advice and encouragement.
To my friends of the Masters II promotion for their criticisms
and social interaction.
I wish to extend my love and gratitude to my brothers and
sisters respectively; NDE Robertson, TEITA Daniel, TCHOUPOU
Marie-Sollange, POUFONG Daniel, LONSTIE Alex, MAFFO Lumiere
and my aunt TOUKEM Bertine for their
multiple support and tons of prayer for my success.
I wish to appreciate my family-in-law especially my
mother-in-law Mrs. KENNE SONNA Julienne, brothers and sisters
in-law, especially, Mr. MANE Olivier and miss
KENNE Laure for their support and encouragement.
To my family friends Mr. DUCOS Rogers, Mr. KAMDEM
Olivier, Mr. YMELE Allen, Mr. YAMO Gil, Mr. NDONGBOU Daniel, Mrs. PEKAKOUMCHE
Mariama, LAMYA Glory, FOMEKONG Caroline, ASONGANI Adeline, Joel KAMDEM, NCHE
Eleanor for their advice and friendship.
For those that are not cited here expressis verbis
kindly accept my sincere gratitude.
TABLE OF CONTENT
DEDICATION
i
ACKNOWLEDGEMENT
ii
TABLE OF CONTENTS
iv
ABREVIATION
iii
LIST OF FIGURES
viii
LIST OF TABLES
ix
ABSTRACT
x
RESUME
xi
GENERAL INTRODUCTION
11
PROBLEMATIC AND HYPOTHESIS
2
OBJECTIVES
3
CHAPTER I. LITERATURE REVIEW
4
I.1.Generalities on diabetes mellitus
4
I.1.1. Glucose metabolism
4
I.1.2. Prevalence of diabetes mellitus
5
I.1.3. Definition, classification of diabetes
mellitus and other categories of glucose regulation
6
I.1.4. Signs and symptoms
6
I.1.5. Diagnostic criteria for diabetes
mellitus
7
I.1.6. Aetiological of disorders of glycemia
7
I.1.7. Complications of diabetes mellitus
10
I.1.8. Diabetes mellitus in special groups and
circumstances
10
I.1.9. Prevention and Management of type 2 diabetes
mellitus
13
I.1.10. Experimental diabetes
19
I.1.11. Metabolism of fructose, glucose and type 2
diabetes mellitus
20
I.2. Botanical review of experimental plant:
Ficus ovata
22
I.2.1. Botanical Aspect of Moraceae
22
I.2.2. Botanical Aspect of the genus
Ficus
22
I.2.3. Botanical Aspect of Ficus ovata
22
I.2.4. Uses of some Ficus in traditional
pharmacopoeia to treat diabetes
23
I.2.5. Uses of Ficus ovata in traditional
pharmacopoeia
24
I.2.6. Previous work on biological activities of
some Ficus
24
CHAPTER II. MATERIALS AND METHODS
26
II.1. Collection and identification of plant
materials
26
II.2. In vitro study
27
II.2.1. Phytochemical screening of the extracts
27
II.2.2. Determination of the antioxidant potential
of the plant extracts
28
II.2.3.The anti-á-amylase effect of
Ficus ovata extracts
29
II.3. In vivo study
31
II.3.1. Experimental animals
31
II.3.2. Evaluation of the acute toxicity
effect of hydroethanolic extracts
32
II.3.4. Effect of extracts on glycemia
32
II.3.5. Evaluation of the modulation effects of
hydroethanolic fruits and twigs on some biomarkers of diabetes type 2 on rat
subjected to high fructose-high cholesterol diet
34
II.5. Biochemical experimentation
35
II.5.1. Determination of plasmatic lipid
profile
35
II.5.2. Determination of Markers of hepatic and
renal toxicity
37
II.5.3. Determination of Nitric Oxide level
39
II.6. Statistical analysis
40
CHAPTER III. RESULTS AND DISCUSSION
41
III.1.Results
41
III.1.1. Yield of extraction and phytochemical
screening
41
III.1.2. Result of the antioxidant potential of our
plant extracts
42
III.1.3. The effect of extracts on starch digestion
in vitro.
43
III.1.4. Acute toxicity study of the hydroethanolic
fruits and twigs extracts
43
III.1.5. The effect of extracts on glycemia
45
III.1.6. Modulatory effects of extracts on some
biomarkers of type 2 diabetes
46
REFERENCES
55
APPENDIX
63
ABREVIATION
4-AP: 4-aminophenazone
ACAT: Acyl Co-Enzyme A Cholesterol
Acyl Transferase
ADA: American Diabetes
Association
ADP: Adenosine -5-Diphosphate
AGE: Advanced Glycation End
Products
ALAT: Alanine aminotransferase
ANOVA: Analysis Of Variance
anti-GAD: Glutamic Acid Decarboxylase
ASAT: Aspartate aminitransferase
ATP: Adenosine -5-Triphosphate
BGT: Blood Glucose Test
BMI: Body Mass Index
BW: Body Weight
CDA: Canadian Diabetes
Association
CHD: Coronary Heart Disease
CVD: Cardio Vascular Disease
DAP: Dehydroxyacetone
Phosphate
EDTA: Ethydyl Diamine Tetracetate
FOEF: Ficus Ovata
Ethanolic Fruits;
FOET: Ficus Ovata
Ethanolic Twigs;
FOHF: Ficus Ovata
Hydroethanolic Fruits
FOHT: Ficus Ovata
Hydroethanolic Twigs
G3P: Glycerol-3-Phosphate
GK: Glycerol Kinase
GOT: Glutamate Oxaloacetate
Transaminase
GPO: Glycerol Phosphate
Dehydrogenase
GPT: Glutamate Pyruvate
Transaminase
HDLC: High Density Lipoprotein
Cholesterol
HFCS: High Fructose Corn Syrup
IDL: Intermediate Density
Lipoprotein
IFG: Impaired Fasting
Glucose
IGT: Impaired Glucose
Tolerance
IR: Insulin Receptor
LD: Lethal Dose
LDH: Lactate Dehydrogenase
LDLc: Low Density Lipoprotein
Cholesterol
LDLR: Low Density Lipoprotein
Receptor
LPL: Lipoprotein Lipase
MDH: Malate Dehydrogenase
NADH: Nicotinamide Dinucleotide
Reduced Hydrogen.
NED: N-1-Naphtylethylene
Dichloride Diamine
NEFA: Non Esterified Fatty
Acid
NO: Nitric Oxide
OD: Optical Density
OGTT: Oral Glucose Tolerance
Test
PKC: Phosphokinase C
POD: Peroxidise
SPSS: Statistical Package
for Social Sciences
STZ: Streptozotocin
TC: Total Cholesterol
TG: Triglycerides
TZD: Thiazolidine
VLDLR: Very Low Density
Lipoprotein Receptor
WHO: World Health Organization
WR: Working Reagent
LIST OF FIGURES
Figure 1: The role of
the pancreas in glucose homeostasis
3
Figure 2: Type 1
Diabetes mellitus
7
Figure 3: Type 2
Diabetes mellitus
8
Figure 4: Metabolic
syndrome
11
Figure 5: Lipoprotein
metabolism
12
Figure 6: Hyperglycemia
induced endothelial dysfunction
13
Figure 7: Action site
of western medicine in diabetes treatment
15
Figure 8: Hepatic
fructose metabolism: highly lipogenic pathway
21
Figure 9: Protocol for
the extraction by maceration in ethanol and hydroethanol (1:1)
26
Figure 10: Mechanism of
pancreatic alpha-amylase activity
30
Figure 11: Antiradical
activity of extracts using DPPH method
42
Figure 12: Effect of
extracts on the inhibition of pancreatic á-amylase activity
43
Figure 13: Effect of
extracts on variation of body weight during toxicity
44
Figure 14: Effect of
extracts on fasting blood glucose after experimentation
46
Figure 15: Effect of
extracts on nitric oxide level in the plasma and heart
48
LIST OF TABLES
Table I: Diabetes
classification: etiologic types and stages
3
Table II: Polarity and
chemical profiles of most of the common extraction solvents
19
Table III: Uses of some
Ficus in traditional pharmacopoeia to treat diabetes
23
Table IV:
Previous work on the biological activities of some
Ficus
24
Table V: Preparation of
the working solution of our extracts
28
Table VI: Methodology of
á-amylase inhibition
31
Table VII: Repartition of
animals for acute toxicity study of extracts
32
Table VIII: Repartition of
animals for the hypoglycemic test
33
Table IX: Repartition
of animals for the antihyperglycemic test
33
Table X: Slightly
modify food composition as proposed by Dhandapani (2007)
34
Table XI: Repartition
of animals for the preventive treatment with extracts
34
Table XII: Yield of
extraction
41
Table XIII: The
phytochemical screening results.
41
Table XIV: Polyphenols
content results
42
Table XV: Behaviour of
rats during acute toxicity study (48hours)
43
Table XVI: Effect of
extracts on markers of toxicity (ASAT, ALAT and Creatinine)
44
Table XVII: Hypoglycemic effects
of extracts on hyperglycemic rats
45
Table XVIII:
Antihyperglycemic effect of extracts on normal rats
45
Table XIX: Effect of
extracts on the variation of body weight
46
Table XX: Effect of
extracts on the markers of lipid profile after experimentation
47
Table XXI: Effect of
extracts on the activity of transaminases (ASAT, ALAT), creatinine and total
protein levels
48
ABSTRACT
The phytochemical components of many medicinal plants
have most often been linked to the modulation of biomarkers associated to
diabetes type 2. This study was aimed at evaluating the anti á-amylase,
antihyperglycemic, hypoglycemic and antihyperlipidemic activities of twigs and
fruits extracts of Ficus ovata.
Hydroethanolic and ethanolic extracts of twigs and fruits of
F. ovata were prepared and used for the phytochemical analysis and
antioxidant potential screening in vitro. The most active extracts
were selected for the evaluation of in vitro antiamylase activity,
acute toxicity study as well as their effects on fasting (hypoglycemic test)
and postprandial (antihyperglycemic test) blood glucose levels. In addition,
the preventive effects of the extracts against some biomarkers of diabetes
(body weight, fasting blood glucose, lipid profile, endothelia dysfunction,
hepatic and renal toxicities) were evaluated at dose of 300mg/kg of body weight
in rats fed on high fructose-high cholesterol diet for 14 days.
Phytochemical screening revealed the presence of alkaloids,
tannins, saponins, glycosides, phenols and flavanoids in all extracts except
phlobatannin that was absent in the fruit extracts. Fruits extracts had the
highest polyphenol content (EF= 718.142 #177; 12.910 mg CatEq vs HF= 486.876
#177; 8.606 mg CatEq; P< 0.05) and the best DPPH antiradical scavenging
effect (IC50; EF= 2.7mg/ml, HF=0.70mg/ml) compared to twigs (P<
0.05). Hydroethanolic twigs and fruits (FOHT and FOHF) extracts selected were
the most active for each plant part. FOHF had significantly high (p=0.05)
antiamylase effects as compared to FOHT and both FOHT and FOHF were weakly
toxic since no dead was recorded at LD50>5000mg/Kg of BW. In addition, both
extracts had hypoglycemic and antihyperglycemic effects (percentage decrease
8.908% vs 5.747% and 21.566% vs 8.208% respectively) with FOHT being more
active than FOHF(p=0.05). Finally, the preventive study results show that,
co-administration of extracts especially FOHF was observed to significantly
reduce fasting blood glucose (p<0.05), Triglyceride (p<0.05), Total &
LDL-Cholesterol (p<0.05), creatinine and total protein levels, and
significantly increase HDL-Cholesterol (p<0.05) and Nitric oxide (plasma;
P< 0.05) levels. Thus the extracts enable us to maintain or ameliorate these
changes to nearly normal levels and reveal its preventive effects.
These results suggest that FOHF and FOHT could be of interest
in the prevention of hyperlipidemia and hyperglycemia associated with type 2
diabetes.
Key words: antihyperglycemia,
antihyperlipidemia, diabetes, Ficus ovata, hypoglycemia.
RESUME
Les
composés bioactifs de plusieurs plantes médicinales sont de plus
en plus considérés comme des facteurs de choix dans la
stratégie de prévention du diabète de type 2. Le but de
cette étude était donc d'évaluer les activités
antihyperglycémiante, hypoglycémiante et
antihyperlipidémiante des extraits de fruits et de tiges de Ficus
ovata.
Les extraits éthanoliques et hydroethanoliques des
fruits et tiges de F. ovata ont été
préparés et les screenings phytochimiques et antioxydant in
vitro évalués. A l'issue des tests précédents,
les extraits les plus actifs ont été sélectionnés
pour la suite des expériences à savoir ; l'activité
antiamylasique in vitro, la toxicité aiguë, les tests
aigus d'évaluation des activités hypoglycémiantes et
antihyperglycémiantes. Enfin, l'effet préventif des extraits
sélectionnés sur quelques biomarqueurs du diabète de type
2 (le poids corporel, la glycémie a jeun, les marqueurs du profil
lipidique, de la dysfonction endothéliale, toxicité
hépatique et toxicité rénale) a été
évalué à la dose 300mg/kg de poids corporel chez des rats
nourris à base d'une alimentation enrichie en fructose et graisses
pendant 14 jours.
Le criblage phytochimique a révélé la
présence des alcaloïdes, tannins, saponines, glycosides,
phénols et flavonoïdes à l'excepté
phlobatannin qui était absent dans les fruits. La teneur en
polyphénols (FOEF=718.142 #177; 12.910 mg EqCat vs FOHF= 486.876 #177;
8.606 mg EqCat; P< 0.05) et l'effect inhibitrice du radical DPPH des
extraits de fruits (IC50; FOEF= 2.7mg/ml, FOHF=0.70mg/ml)
était significativement plus élevée comparativement aux
extraits de tiges. Les extraits hydroéthanoliques des fruits et des
tiges (FOHF et FOHT) étaient les plus actives pour chaque partie du
plant. FOHF avait une activité antiamylasique significativement
élevés (p=0,05) par rapport à l'extrait FOHT et ces deux
extraits étaient faiblement toxiques car aucun décès n'a
été enregistré à la dose administrée (LD50=
5000mg/kg PC). En outre, bien que ces deux extraits aient
présenté un effet hypoglycémiant et
antihyperglycémiant (pourcentage de baisse 8.908% vs 5.747% et 21.566%
vs 8.208% respectivement), l'extrait FOHT était plus efficace (p=0.05).
Par ailleurs, les résultats de l'étude préventive ont
montré que l'administration concomitante des traitements,
particulièrement FOHF a entrainé une diminution significative
(P< 0,05) de la glycémie, le taux de triglycerides, cholesterol
total, cholestérol LDL, créatinine et protéine total
(P< 0,05), et augmentais le taux de cholestérol HDL (P<0,05) et
Oxyde Nitrique (plasma; P< 0.05) donc révèle les effets
préventives.
Ces résultats suggèrent que les extraits
hydroéthanoliques de tiges et fruits de F. ovata pourraient
prévenir l'hyperglycémie et l'hyperlipidémie
associées au diabète de type 2.
Mot clés: antihyperglycémiant,
antihyperlipidemiant, diabète, Ficus ovata,
hypoglycémiant.
GENERAL INTRODUCTION
INTRODUCTION
Diabetes mellitus is one of the most common non communicable
diseases, and its epidemic proportion has placed it at the forefront of public
health challenges currently facing the world (Craig et al.,
2009). The increasing prevalence of diabetes mellitus, the emergence
of diabetes complications as a cause of early morbidity and mortality, and the
enormous and mounting burden on health care systems make diabetes a priority
health concern (Craig et al., 2009).
The world prevalence of diabetes among adults (aged 20-79
years) was estimated to rise from 6.4%, affecting 285 million adults, in 2010,
to 7.7%, affecting 439 million adults by 2030. Between 2010 and 2030, there was
to be a 69% increase in numbers of adults with diabetes in developing countries
and 20% increase in developed countries (Shaw et al.,
2010). In Cameroon, recent estimations situate the prevalence rate at
4.3%, with an increased prevision of 4.7 % by the year 2025 (Shaw
et al., 2010)
This epidemic has been attributed to high fat and high sugar
intakes in modern diets, correlating with the increased use of fructose as a
sweetener including lack of physical activity and sedentary life style
(Jatin et al., 2011). Diabetes can be managed by
exercise and diet which in case of failure, pharmaceutical drugs such as
insulin, insulin secretagogues, insulin sensitizers and á-glucosidase
can be use. These drugs are either too expensive or have undesirable sides
effects or contraindications. The search for more effective and safer
hypoglycemic agents therefore has continued to be an area of research of
interest (Krishna et al., 2004). Alternative
strategies to the current modern pharmacotherapy of diabetes mellitus are
urgently needed, because of the inability of existing modern therapies to
control all the pathological aspects of the disorder, as well as the enormous
cost and poor availability of the modern therapies for many rural populations
in developing countries (Krishna et al., 2004). The
World Health Organization (WHO) has recommended and encouraged the use of
alternative therapy especially in countries where access to the conventional
treatment of diabetes is not adequate (Claudia et
al., 2006).
Plants used in traditional medicine to treat diabetes mellitus
represent a valuable alternative for the control of this disease (Paul
et al., 2006). The use of medicinal plant is quasi-general
throughout the continent; however some of the plants reputed in the indigenous
system of medicine are not scientifically established for their activities
(Kuete et al., 2009). In this context, a number of
medicinal plants and herbs have been studied and validated for their
hypoglycaemic potential using experimental animal models of diabetes as well
clinical studies involving diabetic patients.The plants used include the
members of the Moraceae family and within this family, the genus Ficus
is well documented for its biological activities such as hypoglycemia and
antihyperglycemia (Vivek et al., 2010),
antidiabetes (Mohana et al., 2010),
antioxidant and antimicrobial (Al-Fatimi et al.,
2007 ; Changwei et al ., 2008), anticancer
( Al-Fatimi et al., 2007), antidiarhoeal,
antiplasmodial, anti-pyretic, antiulcer, gastroprotective (Rao et
al., 2008), etc. Ficus ovata, another plant of the Ficus
specie found in the savanna woodland, forest edges, river side forest and
secondary forest, up to an altitude of 2100 m is distributed in the subtropical
Africa. Ficus species is known as elephant tree and Punjab in English
(Tchinda, 2010). Ficus ovata is use widely for street
ornament in Dakar (Kuete et al., 2009). Traditionally
the decoction of the stem bark and leaves of this plant is used for the
treatment of infectious diseases, gastrointestinal infections, diarrhea,
anti-poison and as lactation stimulant (Kuete et al.,
2009).
PROBLEMATIC AND HYPOTHESIS
Formulation of problem
Even though there is no specific cure for diabetes mellitus,
there exist ways of reducing the blood sugar level and to prevent long-term
complications such as stroke and cardio vascular diseases (CVD). Numerous
curative effects of F. ovata have been discovered, but no scientific
investigation was focused on the antidiabetic activity. This work is therefore
orientated towards the research of the ability of F. ovata to inhibit
reaction favoring the digestion, absorption of glucose and fat and its presence
in blood leading to the hypoglycemic and hypolipidemic in laboratory rats.
Study interest
· To confirm the well found antioxidant activity of
F. ovata;
· To recognize and valorize resources that our African
environment has offered to us;
· To arouse a true complementary collaboration between
biochemist, microbiologist, phytochemist, pharmacists and traditional
pharmacopoeia, so that it can be beneficial to the society.
Hypothesis
From the previous study of the antidiabetic activities of
other plants such as Tournefortia hartwegiana, compound isolation
enables the identification of some metabolites with their anti-diabetic
activities. Other studies have identified some of these metabolites in our
plant of interest such that F. ovata extract, being our dependent
variable and antidiabetic activity, our independent variable, our hypothesis is
that Ficus ovata has hypoglycemic and hypolipidemic effects on
rats.
OBJECTIVES
General objective
This study is aimed at evaluating the antihyperglycemic,
hypoglycemic antihyperlipidemic and in vitro anti á- amylase
effects of the twigs and fruits extracts of F. ovata
Specific objectives
· To conduct Phytochemical and antioxidant potential
screenings of ethanolic and hydroethanolic extracts of F. ovata in
order to select the most active extracts.
· To evaluate the antiamylase, hypoglycemic and
antihyperglycemic activities of the most active extracts
· To evaluate the acute toxicity of these selected
extracts
· To assess the preventive effects of the selected
extracts on some biomarkers of diabetes (hyperglycemia, hyperlipidemia and
endothelial dysfunction) on rats fed on high fructose-high cholesterol diet.
CHAPTER I. LITERATURE REVIEW
I.1.Generalities on diabetes mellitus
I.1.1. Glucose
metabolism
I.1.1.1. Digestion and absorption of carbohydrates
Dietary polysaccharides are hydrolysed in the
gastrointestinal tract by the enzyme alpha amylase to produce oligosaccharides
and disaccharides. The resulting disaccharides are further hydrolysed by alpha
glucosidase enzymes to produce glucose and other monosaccharides as shown
below
Fig. 2.1. Digestion of polysaccharides by
á-amylase and á-glucosidases
Dietary (polysaccharide)
á-glucosidases
Glucose, fructose and galactose
Oligosaccharides
and disaccharides
á-Amylase
Glucose and other monosaccharides (fructose and galactose)
resulting from digestion of carbohydrates are absorbed through the small
intestine into the hepatic portal vein. This results in elevation of the
postprandial blood glucose level (Hannan et al.,
2007).
I.1.1.2. Role of the pancreas in
glucose metabolism
The pancreas plays a primary role in the metabolism of glucose
by secreting the hormones, insulin and glucagon (Figure 1.). Elevated
postprandial blood glucose level stimulates pancreatic beta cells to secrete
insulin which then facilitates the entry of glucose into the muscle and adipose
tissues, thereby clearing excess glucose from the circulation. Insulin also
stimulates the processes of glycolysis (catabolism of glucose) and glycogenesis
(synthesis of glycogen from glucose) and inhibits both hepatic gluconeogenesis
and glycogenolysis thereby reducing the hepatic glucose output (kimber
et al., 2006). The actions of insulin are opposed by
glucagon, a hormone produced by the pancreatic alpha cells when the blood
glucose level tends to be low. Glucagon inhibits glycogenesis and stimulates
both gluconeogenesis and glycogenolysis which releases blood glucose into the
blood circulation thereby raising the blood glucose level (kimber
et al., 2006).
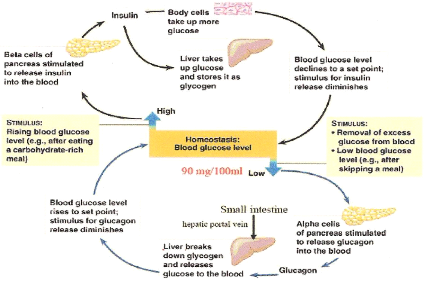 Figure
1: The role of the pancreas in glucose homeostasis (Cheng and Fantus,
2005) Figure
1: The role of the pancreas in glucose homeostasis (Cheng and Fantus,
2005)
I.1.1.3. Metabolic actions
of insulin
Metabolic actions of insulin result from its interaction with
the insulin receptor (IR) found in all insulin responsive target cells (liver,
muscle and adipose tissue). Insulin binds to the alpha-subunit of IR and
activates the intrinsic tyrosine kinase activity of the beta-subunit of the
receptor. Activated IR results in the subsequent phosphorylation of
intracellular substrates including insulin receptor substrates,
phosphatidylinositol (PI) 3-kinase, and protein kinase B (PKB). Normal insulin
action leads to increased glycogen synthesis, glucose transport, and
lipogenesis, and decreased gluconeogenesis, glycogenolysis, and lipolysis
(Cheng and Fantus, 2005).
I.1.2. Prevalence of
diabetes mellitus
Chronic non transmissible diseases are diseases that have
evolved for many years and they require long term management. These diseases
include diabetes, cardiovascular diseases, high blood pressure and cancer. They
are the direct consequences of our daily behavioral activities such as lack of
physical activities, obesity, malnutrition, cigarette smoking and alcoholism
(Craig et al., 2009). Diabetes mellitus an example of
such disease whose prevalence among adults (aged 20-79 years) was estimated to
rise from 6.4%, affecting 285 million adults, in 2010, to 7.7%, affecting 439
million adults by 2030. Between 2010 and 2030, there was to be a 69% increase
in numbers of adults with diabetes in developing countries and a 20% increase
in developed countries (Shaw et al., 2010). In
Cameroon, recent estimations situated the prevalence rate at 4,3%, with an
increased prevision of 4,7% by the year 2025 (Shaw et al.,
2010). This epidemic has been attributed to high fat/ high sugar
intake in modern diet including sedentary lifestyle and lack of physical
activity (Jatin et al., 2011).
I.1.3. Definition, classification
of diabetes mellitus and other categories of glucose regulation
Diabetes mellitus is a group of metabolic diseases of multiple
etiology characterized by hyperglycemia resulting from defects in insulin
secretion, insulin action, or both (Craig et al.,
2009).The chronic hyperglycemia of diabetes is associated with
long-term damage, dysfunction, and failure of various organs, especially the
eyes, kidneys, nerves, heart, and blood vessels (Craig et al.,
2009).
Assigning a type of diabetes to an individual often depends on
the circumstances present at the time of diagnosis, and many diabetic
individuals do not easily fit into a single class. Thus, for the clinician and
patient, it is less important to label the particular type of diabetes than it
is to understand the pathogenesis of the hyperglycemia and to treat it
effectively (ADA, 2009, Rasilainen et al., 2004).
Table I : Diabetes classification:
etiologic types and stages
|
Stages (WHO, 1999)
Types
|
Normoglycemia
|
Hyperglycemia
|
|
Normal glucose tolerance
|
Impaired Glucose regulation
IGT and/or IFG
|
Diabetes mellitus
|
|
Not insulin requiring
|
Insulin requiring for control
|
Insulin requiring for survival
|
|
Type 1
· Autoimmune
· Idiopathy
Type 2
· Predominantly insulin resistance
· Predominantly insulin secretary defects
Other specific types
|
|
|
|
|
|
|
Gestational diabetes
|
|
|
|
|
|
I.1.4. Signs and symptoms
The classical symptoms of diabetes are polyuria (frequent
urination), polydipsia (increased thirst) and polyphagia (increased hunger)
weight loss, and blurred vision. Impairment of growth and susceptibility to
certain infections may also accompany chronic hyperglycemia (Cooke
et al., 2008). Symptoms may develop rapidly (weeks or months)
in type 1 diabetes while in type 2 diabetes they usually develop much
more slowly and may be subtle or absent. Type 1 should always be suspected
in cases of rapid vision change, whereas with type 2 changes are generally
more gradual, but should still be suspected (Cooke et al.,
2008).
I.1.5. Diagnostic criteria for
diabetes mellitus
Three ways to diagnose diabetes are possible, and each, in the
absence of unequivocal hyperglycemia, must be confirmed, on a subsequent day,
by any one of the three methods.
Criteria for the diagnosis of diabetes mellitus
1. Symptoms of diabetes plus casual plasma glucose
concentration =11.1 mmol/l (200 mg/dl).Casual are defined as any time of day
without regard to time since last meal.
2. Fasting plasma glucose =7.0 mmol/l (=126 mg/dl).
Fasting is defined as no caloric intake for at least 8 h.
3. 2-hour postload glucose =11.1 mmol/l (=200 mg/dl) during an
OGTT
The test should be performed as described by WHO,
1999, using a glucose load containing the equivalent of 75 g anhydrous
glucose dissolved in water or 1.75 g/kg of body weight to a maximum of 75 g
(Rasilainen et al., 2004).
Corresponding values (mmol/L) are =10.0 for venous whole blood
=11.1 for capillary whole blood and =6.3 for both venous and capillary whole
blood.
I.1.6. Etiological of disorders of
glycemia
Etiological types designate defects, disorders or processes
that often result in diabetes
I.1.6.1. Type 1
diabetes
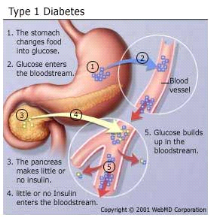 fi fi
Figure 2 : Type 1 Diabetes mellitus
(Harris et al., 2003)
Type 1 indicates the processes of ß-cell destruction
that may ultimately lead to diabetes mellitus in which insulin is required for
survival to prevent the development of ketoacidosis, coma and death. Type 1 is
usually characterized by the presence of anti-glutamic acid decarboxylase
(anti-GAD) antibodies, islet cell or insulin antibodies which identify the
autoimmune processes that lead to ß-cell destruction. Consequently, the
pancreas secretes little or no insulin (Thunander et al.,
2008). Most cases are primarily due to T-cell mediated pancreatic
islet â-cell destruction, which occurs at a variable rate, and becomes
clinically symptomatic when approximately 90% of pancreatic beta cells are
destroyed (Craig et al., 2009). When the clinical
presentation is typical of type 1 diabetes but antibodies are absent, then the
diabetes is classified as Type 1B (idiopathic). Most idiopathic cases are of
African or Asian ancestry; however other forms of diabetes should also be
considered (Dunger et al., 2004).
I.1.6.2. Type 2 diabetes
mellitus
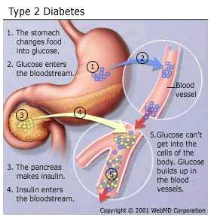
Figure 3 : Type 2 Diabetes mellitus
(Harris et al., 2003)
This form of diabetes, which accounts for 90-95% of those with
diabetes, previously referred to as non-insulin-dependent diabetes, type II
diabetes, or adult-onset diabetes, encompasses individuals who have insulin
resistance and usually have relative (rather than absolute) insulin deficiency
(Harris et al., 2003). Patients with type 2 diabetes
generally are older, although there is an alarming increase in the incidence of
type 2 diabetes in children and adolescents." Patients with type 2 diabetes
have insulin resistance syndrome (e.g., central obesity, hypertension,
hyperlipidemia) for many years (Harris et al., 2003).
There are three major pathophysiological abnormalities in patients with type 2
diabetes, that include early loss of first-phase insulin production associated
with defective beta cell secretion, peripheral resistance to insulin action
primarily in muscle tissue and the liver, and excessive hepatic
glucose production as disease progresses. Normally, first-phase insulin
secretion exerts an inhibitory effect on hepatic glucose production and output.
When a patient has beta cell defects, first-phase insulin secretion is impaired
and eventually lost, which results in fasting hyperglycemia (Hadi
et al., 2007).The body's attempt to moderate blood glucose
levels results in enhanced second-phase insulin secretion, and hyperinsulinism
occurs. Beta cells may secrete high levels of insulin to normalize blood
glucose levels and successfully maintain normoglycemia for many years.
Gradually, however, the beta cells may begin to falter, and insulin secretion
decreases. As hepatic glucose production increases, both fasting and
postprandial glucose levels become elevated (Hadi et al.,
2007).
Insulin resistance implies that the body's cells (insulin
receptors) are less sensitive to the action of insulin. Insulin
resistance, defined as the decreased ability of insulin to promote glucose
uptake in skeletal muscle and adipose tissue and to suppress hepatic glucose
output, may be present for many years before the development of any abnormality
in plasma glucose levels (Haffner, 2003). Consequently, blood
glucose levels rise, even though the beta cells produce more insulin. In
patients with insulin resistance, however, hyperinsulinemia does not suppress
gluconeogenesis, and chronic hyperglycemia develops. Insulin sensitivity can
decline by at least 70% before fasting plasma glucose concentrations become
abnormal, and it may take up to 20 years to reach that point (Haffner,
2003). Experts are not certain yet about the mechanism underlying
insulin resistance, but they know that obesity, particularly central obesity,
increases insulin resistance. They further speculate that defects in
intracellular signalling prevent glucose from entering cells
(Mukhyaprana et al., 2004).
Major risk factors for type 2 diabetes
mellitus
- Family history of diabetes (i.e., parents or siblings with
diabetes)
- Body Mass Index (BMI) (BMI > 27 kg per m')
- Radethnicity (e.g., African American, Hispanic, Native
American, Asian American, Pacific Islander) Age 45 years
- Previously identified impaired fasting glucose or impaired
glucose tolerance
- Hypertension (i.e. = 140/90 mm Hg)
- High-density lipoprotein cholesterol level I < 35 mg per
dL (0.9 mmol per L) or a triglyceride level = 250 mg per dL (2.83 mmol per
L)
- History of gestational diabetes mellitus or delivery of
babies above 4.032 g (Mukhyaprana et al.,
2004).
I.1.6.3. Other specific
types
Other specific types are currently less common causes of
diabetes mellitus, but are conditions in which the underlying defect or disease
process can be identified in a relative specific manner (WHO,
1999). They include:
- Genetic defects in ß-cells, such as maturity-onset
diabetes of the young;
- Genetic defects in insulin action,
- Diseases of the exocrine pancreas, such as cancer of the
pancreas, cystic fibrosis and fibrocalculous pancreatopathy (a form of diabetes
that was formerly classified as one type of malnutrition-related diabetes
mellitus) and many others.
I.1.7. Complications of
diabetes mellitus
Uncontrolled hyperglycemia in both type 1 and type 2 diabetes
lead to the development of both acute and long term complications (Weiss and
Sumpio, 2006).1(*) Acute
complications of diabetes mellitus include ketoacidocis (type 1) or nonketotic
hyperosmolar coma (type 2). Long term complications include cardiovascular
diseases, hypertension, chronic renal failure, retinal damage, nerve damage,
erectile dysfunction and macrovascular damage which may cause poor healing of
wounds particularly of the feet and can lead to gangrene which may require
amputation (WHO, 1999). Chronically elevated blood glucose
levels lead to increase production of mitochondrial reactive oxygen species
(ROS), which activate a number of metabolic pathways whose end products
contribute to the development of long term complication of diabetes
(Weiss et al., 2006).
I.1.8. Diabetes mellitus in
special groups and circumstances
I.1.8.1. Metabolic syndrome
and type 2 diabetes mellitus
Often a person with abnormal glucose tolerance (IGT or
diabetes) will be found to have at least one or more of the other
cardiovascular disease risk factors such as hypertension, central (upper body)
obesity, and dyslipidemia. This clustering has been labelled diversely as the
metabolic syndrome, syndrome X, or the insulin resistance syndrome
(WHO, 2006). Alone, each component of the cluster conveys
increased cardiovascular disease risk, but as a combination they become much
more powerful. This means that the management of persons with hyperglycemia and
other features of the metabolic syndrome should focus not only on blood glucose
control but also include strategies to reduce the impact of other
cardiovascular disease risk factors (WHO, 2006). The metabolic
syndrome with normal glucose tolerance identifies the subject as a member of a
group at very high risk of future diabetes. Thus, vigorous early
management of the syndrome may have a significant impact on the prevention of
both diabetes and cardiovascular disease, especially as it is well documented
that the features of the metabolic syndrome can be present for up to 10 years
before glycemia disorder is detected (Miller et al.,
2010).
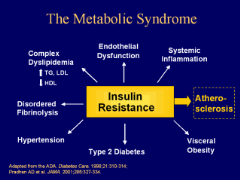
Figure 4 : Metabolic
syndrome (Miller et al., 2010)
I.1.8.2. Hyperlipidemia and
type 2 diabetes mellitus
Hyperlipidemia refers to elevated levels of lipids and
cholesterol in the blood, and is also identified as dyslipidemia, to describe
the manifestations of different disorders of lipoprotein metabolism. Lipids in
blood are either free or bound to other molecules. They are either provided by
diet or are endogenously synthesized. Lipids, such as cholesterol and
triglycerides, are insoluble in plasma. Circulating lipid is carried in
lipoproteins that transport lipid to various tissues for energy use, lipid
deposition, steroid hormone production and bile acid formation. The lipoprotein
consists of esteri?ed and unesteri?ed cholesterol, triglycerides,
phospholipids, and proteins. Abnormalities in lipoprotein metabolism are a
major predisposing factor to atherosclerosis, increasing risk for CHD
(Cromwell et al., 2006).
Five major lipoproteins exist, each with a di?erent function:
chylomicrons carry triglycerides from the intestine to the liver, skeletal
muscles and to adipose tissues; very low density lipoproteins (VLDLs) carry
(newly synthesized) triglycerides from the liver to adipose tissue;
intermediate density lipoproteins (IDLs) are intermediate between VLDL and low
density lipoprotein (LDL). LDL is the main carrier of circulating cholesterol
within the body. It is used by extra hepatic cells for cell membrane and
steroid hormone synthesis. Once the LDL is taken up by LDL receptors, free
cholesterol is released and accumulates within the cells. High density
lipoprotein (HDLs) collects cholesterol from body tissues and brings it back to
the liver. The protein components of the lipoprotein are known as
apolipoproteins or apoproteins. The different apolipoproteins serve as
cofactors for enzymes, and ligands for receptors. Defects in apolipoprotein
metabolism lead to abnormalities in lipid handling (Lucy et
al, 2005).
Three main pathways are responsible for the generation and
transport of lipids within the body: exogenous, endogenous, and reverse
cholesterol transport (Nicole et al., 2008). Although
elevated low density lipoprotein cholesterol (LDLc) is thought to be the best
indicator of atherosclerosis risk, dyslipidemia can also describe elevated
total cholesterol (TC) or triglycerides (TG), or low levels of high density
lipoprotein cholesterol (HDLc) (Cromwell et al.,
2006). The most common lipid pattern in type 2 diabetes consists of
hypertriglyceridemia, low high-density lipoprotein cholesterol (HDLc) and
normal plasma concentrations of low-density lipoprotein cholesterol (LDLc).
However, in the presence of even mild hyper-TG, LDLc particles are typically
small and dense and may be more susceptible to oxidation (Grundy,
2006). Chronic hyperglycaemia promotes the glycation of LDLc and both
these processes are believed to increase the atherogenicity of LDLc.
Under normal circumstances, insulin activates the enzyme
lipoprotein lipase and hydrolyses triglycerides. However, in insulin deficient
subjects, it fails to activate the enzyme and causes hypertriglyceridemia. In
insulin deficient diabetics, the plasma free fatty acid concentration is
elevated as a result of increased free fatty acid outflow from fat depots,
where the balance of the free fatty acid esterification-triglyceride lipolysis
circle is displaced in favour of lipolysis (Jie et al.,
2007). Excess plasma NEFA can inhibit insulin-stimulated glucose
utilization in muscle and promote hepatic production of glucose. Whereas,
reduction of plasma NEFA concentration improves glucose utilization, enhances
the suppression of hepatic glucose production by insulin (Jie et
al., 2007).
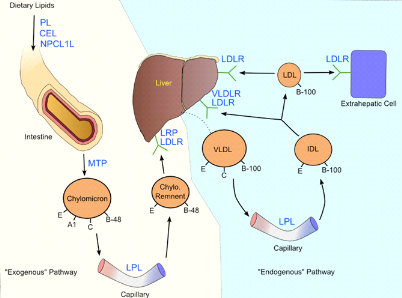
Figure 5 : Lipoprotein
metabolism (Cromwell et al., 2006)
I.1.8.3. Oxidative stress,
endothelia dysfunction and diabetes
Oxidative stress is caused by a relative overload of oxidants,
i.e., reactive oxygen species especially from glycation or lipoxidation
processes and decreased enzymatic and non enzymatic antioxidant defence system.
Evidence has accumulated suggesting that diabetic patients are under oxidative
stress and that complications of diabetes seem to be partially mediated by
oxidative stress (Hadi et al., 2007). Several
mechanisms seem to be involved in the development of an oxidative stress in the
presence of elevated glucose concentrations, namely glucose autoxidation,
protein glycation, AGE formation and the polyol pathway (Hadi et
al., 2007). Thus, it has been shown that oxygenated free radicals
are able to alter vascular function (endothelia dysfunction), especially by
inhibiting synthesis and action of nitric oxide (NO
·). Endothelia
dysfunction comprises a number of functional alterations such as impaired
vasodilatation, inflammation activation and increase plasma level of endothelia
products all of which are usually associated to cardiovascular disease. A key
feature of endothelial dysfunction is the inability of arteries and arterioles
to dilate appropriately in response to stimuli. This limits the delivery of
nutrients and hormones to the distal tissues (Wineke et al.,
2009). Insulin resistance may be associated with intracellular
production of free radicals which in turn could be responsible for
deterioration of insulin action thus leading to a vicious cycle
(Ghufran et al., 2011).
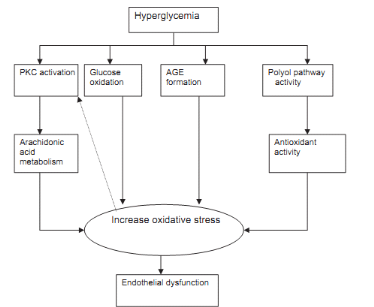
Figure 6 : Hyperglycemia induced
endothelial dysfunction (Hadi et al., 2007)
I.1.9. Prevention and Management
of type 2 diabetes mellitus
I.1.9.1. Strategies for
treatment and control of diabetes
There exist a primary, secondary and tertiary prevention of
diabetes mellitus. Primary prevention of type 2 diabetes is possible and
includes Lifestyle changes aimed at weight control and increased physical
activity. The benefits of reducing body weight and increasing physical activity
are not confined to type 2 diabetes, they also play a role in reducing heart
disease and high blood pressure.
Secondary and tertiary preventions are keys to reducing the
risk of costly diabetic complications, as well as their associated disabilities
(Craig et al., 2009). The primary purpose of
secondary prevention activities such as screening is to identify individuals
without symptoms who already have the disease, who are at high risk of
developing complications related to the primary disease, and where intervention
could have a beneficial effect.
Tertiary prevention of diabetes includes every action taken to
prevent or delay the consequences of diabetic complications, such as blindness,
foot amputation and adverse pregnancy outcomes. Strategies for tertiary
prevention involve prevention of the development of complications by strict
metabolic control, education and effective treatment. They also involve
screening for early stages of complications, when intervention and treatment
are generally more effective (Craig et al., 2009).
Diabetes mellitus type 2 should not be managed based on symptoms alone.
The goal of treatment of diabetes mellitus is to control blood
glucose and ultimately prevent long-term complications. Provided hyperglycemia
is mild in type 2 diabetes, patients may be given at least a one month trial of
diet, exercise and weight management in order to control hyperglycemia. If this
regimen does not lead to adequate blood glucose control, the physician will
need to prescribe oral anti-hyperglycaemic agents and/or insulin
(Reaven et al., 2009). It is now well established
that multiple metabolic abnormalities associated with insulin resistance and
increased cardiovascular risk, such as dyslipidemia, obesity and hypertension,
are already present at diagnosis. Results of many intervention studies have
demonstrated marked benefit from antihypertensive, lipid-lowering and
anti-platelet therapy (Reaven et al., 2009).
Exercise is extremely important in the management of diabetes
because of its effect on blood glucose and free fatty acids. Exercise burns
calories and helps to control weight, eases stress and tension, and maintains a
feeling of well-being. In addition, regular exercise improves the body's
response to insulin and may make oral anti-diabetic drugs and insulin more
effective. It also promotes circulation, and lowers cholesterol and
triglyceride levels, thus reducing the risk of cardiovascular disease
(Eldor et al., 2009).
I.1.9.2. Mechanism of
action of conventional oral hypoglycemic drugs
Oral hypoglycemia agents exert their glucose lowering effects
via a variety of mechanisms (Figure 6). These mechanisms of action include:
reduction of hepatic glucose production, (metformin, a biguanide), enhancement
of insulin secretion by pancreatic beta cells, (insulin secretagoges)
improvement of insulin sensitivity (metformin) and inhibition of intestinal
glucose digestion and absorption (alpha glucosidase inhibitors) (Baby
et al., 2011). The use of these drugs is however, limited by
the fact that they have adverse side effects, such as potential hypoglycemia
(e.g. sulfonylurea), weight gain, (meglitinides, sulfonylurea and
thiazolidinesdiones), gastro-intestinal discomforts (alpha glucosidase
inhibitors, and alpha amylase inhibitors) and lactoacidosis (TZDs and
metformin) (Cheng and Fantus, 2005). In addition to their
potential side effects, many of the oral anti-diabetic agents have higher
secondary failure rates.
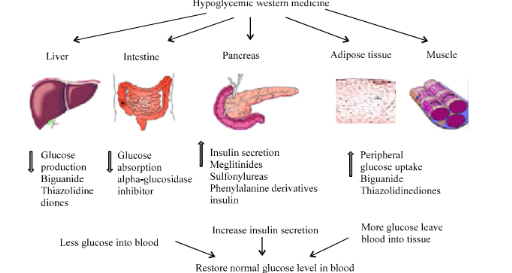
Figure 7 :
Action site of western medicine in diabetes treatment (Baby et al.,
2011)
Oral agents may counteract insulin resistance, improve
ß-cell glucose sensing and insulin secretion, or control the rate of
intestinal glucose absorption. Combinations of oral agents, in particular
sulfonylureas plus metformin or thiazolidinediones plus metformin, have
improved the care of diabetic patients, and may be used when monotherapy is
ineffective (Craig et al., 2009).
I.1.9.2 Medicinal plants and herbs for diabetes
As it's the case with other diseases, medicinal plants have
been used since ancient times to treat and manage diabetes mellitus in
traditional medical systems of many cultures throughout the world
(Jung et al., 2006). Currently, medicinal plants
continue to play an important role in the management of diabetes mellitus,
especially in developing countries, where many people do not have access to
conventional antidiabetic therapies (Acharya and Shrivastava,
2008). In developed countries the use of antidiabetic herbal remedies
is reported to have been declining since the introduction of insulin and
synthetic oral hypoglycemic agents during the early part of the twentieth
century. However, in recent years, there has been a resurgence of interest in
medicinal plants with hypoglycemic potential in these countries (Paul
et al., 2006). This renewed interest in herbal antidiabetic
remedies in developed countries is believed to be motivated by several factors,
including, the side effects, high secondary failure rates and the cost of
conventional synthetic antidiabetic remedies (Paul et al.,
2006).
I.1.9.3. Bioactive ingredients (principles) of antidiabetic
medicinal plants
Ivorra et al (1989) studied the
structure of 78 different compounds isolated from plants with attributed
hypoglycemic activity. They classified these compounds according to the
following chemical groups:
i) polysaccharides and proteins (59 compounds)
ii) steroids and terpenoids (7 compounds)
iii) alkaloids (7 compounds)
iv) flavonoids and related compounds (5 compounds)
Similarly, Bailey and Day (1989) listed 29
compounds that contained 14 polysaccharides, 5 alkaloids, 4 glycosides and 6
other compounds. Grover, (2002) reviewed 45 medicinal plants
of India with confirmed antidiabetic potential. Of the 17 hypoglycemic
principles isolated and identified in this review 5 compounds are amino acids
and related compounds, 5 compounds are glycosides, and 3 compounds are phenolic
(flavonoids) compounds. The remaining compounds are alkaloids (2 compouds),
terpenoids (1 compound) and polysaccharides (1 compound). Bnouham
et al., (2006) also reviewed 178 medicinal plants with potential
antidiabetic activity.
I.1.9.4. Mechanism of action of antidiabetic medicinal plants
and their components
There are several possible mechanisms through which these
herbs can act to control the blood glucose level (Tanira,
1994). The mechanisms of action can be related, generally, to the
ability of the plant in question (or its active principle) to lower plasma
glucose level by interfering with one or more of the processes involved in
glucose homeostasis. The reported mechanisms whereby herbal antidiabetic
remedies reduce blood glucose levels are more or less similar to those of the
synthetic oral hypoglycemic drugs and are summarized as follows
(Tanira, 1994; Bastaki, 2005; Bnouham et
al ., 2006):
i) stimulation of insulin synthesis and/or secretion from
pancreatic beta-cells
ii) regeneration/revitalization of damaged pancreatic beta
cells
iii) improvement of insulin sensitivity (enhanced glucose
uptake by fat and muscle cells)
iv) mimicking the action of insulin (acting like insulin)
iv) alteration of the activity of some enzymes that are
involved in glucose metabolism
vi) slowing down the absorption of carbohydrates from the
gut.
I.1.9.5. Investigation of
some mechanism of action of antidiabetic plant extracts
Below is a brief description of some procedures used to
investigate the in vivo effects of plant materials on insulin
secretion, digestion and absorption of glucose, activation of the insulin
receptor and the activity of some carbohydrate metabolizing enzymes.
· Effect on
insulin secretion
In most published studies, investigation of the effect of
medicinal plant extract on insulin secretion in vivo has involved the
use of streptozotocin or alloxan induced animal models of diabetes
(Eidi et al., 2006). Both alloxan and streptozotocin
causes destruction of pancreatic beta cells resulting in reduced insulin
secretion (Fröde and Medeiros, 2008). In streptozotocin
and alloxan induced animal models of diabetes, insulin is markedly depleted but
not absent (Fröde and Medeiros, 2008). For this reasons
these animal models have been widely used to study the effect of antidiabetic
remedies on insulin secretion in vivo.
· Intestinal
digestion and absorption of carbohydrates
In order to investigate the effect of an antidiabetic plant
extract on intestinal digestion and/or absorption of carbohydrates, study
animals are usually divided into experimental and control groups. Experimental
animals are given a plant extract under investigation while control animals are
given a vehicle. An hour later, both groups of animals are given a fixed amount
of glucose, sucrose or starch. Thereafter, blood glucose levels are measured at
0.5, 1, 1.5, 2 and 3 hrs after administration of the carbohydrate. Areas below
the oral glucose tolerance curves of experimental groups are then calculated
and compared with those of control groups (Hannan et al.,
2007). Alternatively, a glucose tolerance test can be determined
in the same group of animals before and after oral administration of the plant
extract (Karato et al., 2006). A comparison of the
glucose tolerance curve before and after oral administration of the plant
extract will indicate whether or not the plant extract contribute to the delay
in carbohydrate digestion and subsequent lowering of the blood glucose level
glucose.
· Inhibition or
activation of carbohydrate metabolizing enzymes
It has been establish that some antidiabetic remedies, for
example, metformin exert its blood glucose effects by inhibiting endogenous
glucose production by the liver through the process of gluconeogenesis and
glycogenolysis (Bastaki, 2005). For this reason, as part of
efforts to find out the possible mode of action of antidiabetic remedies,
several researchers have investigated the effect of plant extracts on the
activities of gluconeogenic enzymes: glucose 6-phosphatase, fructose
1,6-bisphosphatase; the glycogenolytic enzyme; glycogen phosphorylase and
hepatic glucokinase. In order to investigate the effect of medicinal plant
extract on key enzymes involved in glucose homeostasis in vivo, the
study design used are similar to the one describe above for the study of the
effect of plant extract on stimulation of insulin except that at the end of the
feeding period blood and selected tissues are also collected for the
measurement of the activity of selected enzymes in plasma or tissue homogenates
in vitro.
I.1.9.6 Extraction of plant
material
The choice of the extraction solvent depends mainly on the
polarity and hence the solubility of the bioactive compound(s) of interest.
Although water is generally used as an extractant in many traditional
protocols, organic solvents of varying polarities are often used (either alone
or in different combinations) in modern methods of extraction to exploit the
various solubilities of plant constituents. The polarity and chemical profiles
of most of the common extraction solvents have been determined (Eloff
et al., 1998) and are summarized in Table II.
Thus, if the polarity or the solubility of the compound(s) of
interest is known, information such as the one in the table below can be used
to select a suitable extractant solvent or a mixture of two or more solvents of
different polarity. Alternatively, a solvent such as acetone, which has the
capacity to extract both polar and non-polar substances, and has been
recommended by Eloff (1998) for the extraction of most polar
and non-polar compound.
If the polarity of the compounds of interest is not known, the
powdered plant material can be extracted simultaneously with a mixture of
different proportions of two or more solvents of different polarity.
Alternatively, the powdered plant material can be extracted sequentially with
solvent of different polarity in what is known as a sequential extraction
procedure (Bruneton, 1999).
The choice of the extraction procedure depends on the nature
of the source material and the compound to be isolated. Solvent extraction
procedures applied to plant natural products include but not limited to
maceration, percolation, soxhlet extraction, steam distillation and sequential
solvent extraction (Jones and Kinghorn, 2005).
Table II : Polarity and chemical
profiles of most of the common extraction solvents

I.1.10. Experimental diabetes
They are used for many decades. The can either be spontaneous
or provoked. This constitutes laboratory rodents and mammals. Small ruminants
are objects for many medical researches but are not used in diabetology because
their herbivoral metabolism is very different from that of omnivores.
Spontaneous model are rare in animals and the type of diabetes is not always
the same as the one found on man. Certain species of animals were created for
medical use.
Induced methods are obtained by administration of the toxic
agent on the endocrine pancreas or by pancreatectomy.
I.1.10.1. Chemical
induction model
· Diabetes induced by streptozotocin
Streptozotocin (STZ) is an antibiotic, anti-tumoral of
synthesis use in anticancerous chemotherapy in man. In animals, streptozotocin
selectively destroys the pancreatic insulin-secreting â-cells, leaving
less active cells. STZ diabetic mice are one of the animal models of human
insulin-dependent diabetes mellitus characterized by high fasting blood glucose
levels and drastic reduction in plasma insulin concentration (Jie
et al., 2007).
· Diabetes induced by alloxan
Alloxan is one of the usual substances used for the induction
of diabetes mellitus apart from streptozotocin. Alloxan has a destructive
effect on the beta cells of the pancreas (Vivek et al.,
2010). Alloxan causes a massive reduction in insulin
release by the destruction of â-cells of the islets of langerhans,
thereby inducing hyperglycemia. Insulin deficiency leads to various metabolic
alterations in the animals via increased blood glucose, increased cholesterol,
increased levels of alkaline phosphate and transaminases (Vivek et
al., 2010).
I.1.10.2. Diet induction
model
Experimental cardiovascular risk factors of diabetes
complications are usually induced by the consumption of high fat diet, high
sucrose diet, and high cholesterol diet depending on the pathological state
that is to be induced. For instance, it has been shown that rats fed on high
fructose diet mimic the progression of type 2 diabetes seen in humans including
glucose intolerance, increased oxidative stress, hypertension, and reduced
myocardial and vascular compliance (Jatin et al.,
2011).
I.1.11. Metabolism of fructose, glucose and type 2 diabetes
mellitus
Dietary fructose undergoes rapid metabolism by the liver since
most cells lack glut-5 transporter which transport fructose into cells. In
contrast, hepatic glucose metabolism is limited by the capacity to store
glucose as glycogen and, more importantly, by the inhibition of glycolysis and
further glucose uptake resulting from the effects of citrate and ATP to inhibit
phosphofructokinase. Because fructose uptake by the liver is not inhibited at
the level of phosphofructokinase, fructose consumption results in larger
increases of circulating lactate than does consumption of a comparable amount
of glucose (Angela et al., 2007). Low-dose fructose
has also been found to restore the ability of hyperglycaemia to regulate
hepatic glucose production. In addition, fructose ingestion results in smaller
postprandial glycemic excursions compared to glucose and glucose-containing
carbohydrates (starches) that are rapidly absorbed as glucose. However,
increased blood fructose concentrations could also contribute to glycation and
diabetic complications (Angela et al., 2007).
In contrast to low doses of fructose, when much larger amounts
of fructose are consumed (e.g., in sucrose- and HFCS- sweetened beverages),
fructose continues to enter the glycolytic pathway distal to
phosphofructokinase and hepatic triacylglycerol production is facilitated.
Thus, unlike glucose metabolism, in which the uptake of glucose is negatively
regulated at the level of phosphofructokinase, high concentrations of fructose,
can serve as a relatively unregulated source of acetyl-CoA (George
et al., 2007). Thus, fructose is more lipogenic than glucose,
an effect that might be exacerbated in subjects with existing hyperlipidemia or
insulin resistance or type 2 diabetes (Heather et al.,
2005). In contrast to glucose, dietary fructose does not stimulate
insulin or leptin (which are both important regulators of energy intake and
body adiposity). Therefore, the decrease in insulin responses to meals and
leptin production associated with chronic consumption of diets high in fructose
may have deleterious long-term effects on the regulation of energy intake and
body adiposity (Jatin et al., 2011). Another recent
report has proposed a hypothesis relating fructose intake to the long-known
relation between uric acid and heart disease. The ADP formed from ATP after
phosphorylation of fructose on the 1-position can be further metabolized to
uric acid. The metabolism of fructose in the liver drives the production of
uric acid, which utilizes nitric oxide, a key modulator of vascular function
(George et al., 2007).
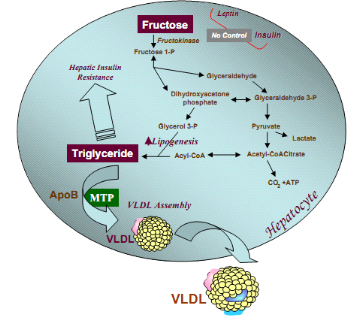
Figure 8 : Hepatic fructose metabolism:
highly lipogenic pathway (Heather et al., 2005)
Stimulated triglyceride synthesis is likely to lead to hepatic
accumulation of triglyceride, which has been shown to reduce hepatic insulin
sensitivity, hepatic insulin resistance, glucose intolerance as well as
increased formation of VLDL particles due to higher substrate availability,
increased apoB stability, and higher MTP, the critical factor in VLDL assembly
(Kimber et al., 2008).
I.2. Botanical review of experimental plant: Ficus ovata
I.2.1. Botanical Aspect of
Moraceae
The family of Moraceae belongs to plant kingdom, branch of
phanerogames, sub-branch of angiosperm, class of dicotyledonous, sub-class of
monochlamides and order of urticals. It takes its name from the genus Murier or
Morus in Latin and in Greek it is called Moreas. Moraceae are constituted of
trees, sub-trees or herbs which can be dioic or monoic with or without a latex
(Mensbruge, 1966). The leaves are disposed in a spiral form;
their nervation is palmated, pinnated or radial. The young ones of Moraceae
plants are characterised by their first leaves which is simple opposite or
sub-opposite (Human et al., 1985). Their unisexual
flowers are dioic or monoic and it is fixed on the plant directly. The fruits
are dehiscent; the grains which are with or without endosperms have equal or
unequal cotyledons. This family of Moraceae counts about 50 genus and 900 to
1000 species. In Cameroon, about 13 genus and 99 species, are represented and
amongst the most spread genus we have; Morus, Artocapus, Ficus and Dorstenia
(Chang et al., 1998).
I.2.2. Botanical Aspect of the
genus Ficus
Ficus or fig tree is the name of some shrubs or trees of the
family Moraceae producing a milky juice and best known for their fleshy and
edible fruits. Leaf shape is very variable. The shape may be whole or lobed and
the edges rough or smooth. In some tropical species, leaf shape changes during
growth of the tree. The flowers are minute and unisexual (male or female), they
cluster on flat or hollow receptacle. Male flowers have one or two stamens,
rarely more. In female flowers, the stamens are numerous and pedicellate. In
fact, the shape of fruit that develops from inflorescences is varied. The
seeds, embedded in the fruit are very numerous. The ovary of Ficus has a
lateral style. The branches are covered with a fluffy greenish grey bark. The
Ficus is found mainly in tropical forests, but they also exist in temperate
regions, especially around Mediterranean (Tchinda et al.,
2010). The genus Ficus includes 850 species of which about 60 are
present in Cameroon (Sabatie, 1985).
I.2.3. Botanical Aspect of Ficus
ovata
Ficus ovata, another plant of the Ficus
specie found in the savanna woodland, forest edges, river side forest and
secondary forest, up to an altitude of 2100 m is distributed in the subtropical
Africa. Ficus species is known as elephant tree and Punjab in English
(Hanelt et al., 2001), Ficus ovata is use
widely for street ornament in Dakar in Senegal (Kuete et al.,
2009). In Africa, Ficus ovata is found in Senegal, southern
Ethiopia, Kenya, North of Angola, Zambia, Malawi, Mozambique, and Cameroon.
|
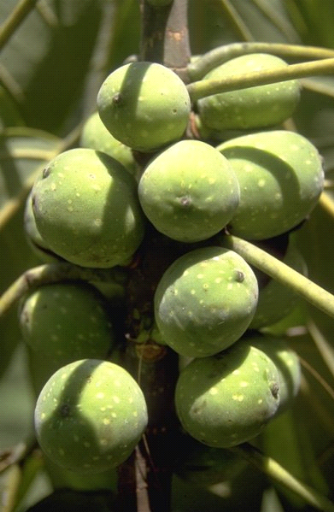
Figure 8 : Ficus ovata (Tchinda et
al., 2010)
|
· Life;embryophyta(plant);angiospermae
(flowering plant);eudicotyledons
· Order;Rosales
· Family.Moraceae
· Genus;Ficus
· Subgenus;Urogstigma
· Section;Galoglychia
· Subsection;Caulocarpae
· Specie; ovata
· Botanique name; Ficus ovata
Common name; punjab
|
The
sites of Ficus ovata in Cameroon (Aubreville,
1964) include Dschang, Bafang , Limbe, Bayangam,
Nkongsamba, Meiganga, Maroua, Bipindi, Yaounde.
I.2.4. Uses of some Ficus in
traditional pharmacopoeia to treat diabetes
Table III: Uses
of some Ficus in traditional pharmacopoeia to treat diabetes
|
Plants
|
Parts used
|
Indigenous use (Kiran et al.,
2011)
|
|
Ficus bengalensis L
|
Aerial roots,
bark
|
1. The stem bark is extracted in hot water and
extract is given orally to the patient.
2. By eating fruits to reduce blood glucose.
3. Regular chewing of fresh root tips can reduce blood glucose
level.
|
|
Ficus racemosa Roxb
|
Bark, Fruit
|
1. Decoction of ripe fruits use in diabetes.
2. Decoction of stem bark reduces blood glucose.
|
|
Ficus lacor Ham
|
Fruit
|
Powder of dried ripe fruits is used to treat diabetes
|
|
Ficus religiosa L.
|
Bark
|
The bark boiled in hot water and the extract given
orally to the diabetic person
|
|
Ficus microcarpa L.f.
|
Fruit, leaves
|
Fresh leaves and fruits taken in equal quantity, grind
them, and taken orally is best remedy to treat diabetes
|
|
Ficus virens Dryand
|
Leaves
|
Leaves are used to treat diabetes
|
|
Ficus carica L.
|
Leaves
|
The decoction of leaves used to cure diabetes.
|
|
Ficus hispida L.f.
|
Bark
|
Infusion of bark used as remedy to treat diabetes
|
The multiple and diverse uses of Ficus species in
traditional pharmacopoeias were definitely the starting point of several
scientific studies carried out until today.
I.2.5. Uses of Ficus ovata in traditional pharmacopoeia
The decoction of leaves of Ficus ovata Vahl is used
to treat infectious diseases and facilitate childbirth. The decoction of the
bark stems is used in the treatment of gastrointestinal infections, diarrhea
and as antipoison. In Benin, the leaves of Ficus ovata are used
against external hemorrhoids, sprains and jaundice (yellowing) (Kuete
et al., 2009) and its leaves are used in Ivory Coast against
the psychoneuroses. For this, we must drink a glass of the decoction of the
leaves, morning, noon and night, wash your body with this and make a decoction
enema decoction of roots (Assi et al., 1990). Fruits
are used to stimulate milk production in cows and stem back use as food for
mastication (Hanelt et al., 2001).
I.2.6. Previous work on biological activities of some Ficus
We have put together some previous phytochemical and
biological work on the genus Ficus, which has lead to the isolation of
a number of secondary metabolites belonging to several classes of compounds and
responsible in one way or the other for their biological activities.
Table
IV : Previous work on the biological activities of
some Ficus
|
Plants
|
Research goal
|
Extract
|
Activity
|
|
Ficus ovata
|
Test of antimicrobian activity of a crude extracts, fractions
and compounds
|
Methanol bark and trunk extract
|
The crude extract and certain compounds inhibited the activity
of steptococus faecalis, candida albicans, microsporum audouini, staphylococus
aureus (Kuate et al., 2009).
|
|
Ficus Glomerata
|
-Hypoglycemic activity in alloxan induced diabetic
-Antihyperglycemic activity in streptozotocin induced diabetic
rats
|
Ethanolic leaves
bark and aqueous extract
|
It has significant antihyperglycemic effect in experimental
model of diabetes (Vivek et al., 2010).
antihyperglycemic activity in experimental animals
(Faiyaz et al., 2008).
|
|
Ficus hispida Linn.
|
Hypoglycemic activity in normal and diabetic rats and probable
mechanism
|
Ethanolic bark extract
|
Hypoglycemic activity. Increased glycogenesis and enhanced
peripheral uptake of glucose are the probable mechanisms (Ghosh et
al., 2004).
|
|
Ficus exasperata
|
Glycemic effect in fructose induce glucose intolerance in
Sprague-Dawley rats
|
aqueous leaves extract
|
The extract ameliorated glucose intolerance induced by fructose
feeding in rats (Idowu et al., 2010).
|
|
Ficus racemosa Linn.
|
hypoglycemic and in vitro antioxidant activity
|
ethanolic Fruits extract
|
It was suggested that it has both hypoglycaemic and
antioxidant potential (Abu et al.,
2011).
|
|
Ficus Carica
|
Hypoglycemic Effect In normal and Streptozotocin Induced
Diabetic Rat
|
Water Leaves extract
|
Oral consumption of aromatic water leaves of Ficus carica
decreased blood glucose level in normal and diabetic rats (Rashidi
et al., 2011).
|
|
Ficus
krishnae L.
|
Anti-Diabetic and Antihyperlipidemic Activity in alloxan
Induced Diabetic Rats
|
leaves
|
Ficus krishnae have an anti-diabetic effect in alloxan induced
diabetic rats and their effect was equivalent to that of reference drug
glibenclamide (Mohana et al., 2010).
|
Herbal extracts contain different phytochemicals with
biological activity that can be of valuable therapeutic index. Much of the
protective effect of fruits and vegetables has been attributed by
phytochemicals, which are the non-nutrient plant compounds. Different
phytochemicals have been found to possess a wide range of activities, which may
help in protection against chronic diseases. For example, glycosides, saponins,
flavonoids, tannins and alkaloids have hypoglycemic activities; anti-
inflammatory. Reports show that saponins possess hypocholesterolemic and
antidiabetic properties. (Poongothai et al.,
2011)
Flavanoids are reported to regenerate damaged pancreatic beta
cells and glycosides stimulate the secretion of insulin in beta cells of
pancreas. Glycoside of leucopelargonidin isolated from the bark of F.
bengalensis demonstrated significant hypoglycemic, hypolipidemic and serum
insulin raising effects. Phenolic compounds including quercetin and luteolin
are effective in diabetic treatment where they present capacity to scavenge
superoxide radical. Reports suggest that Quercetin and tannins
treatment has protective effect in diabetes by decreasing oxidative stress and
preservation of pancreatic beta cell integrity. Also Plant polyphenols have
been known to exert anti-diabetic action and promote insulin action
(Abu et al., 2011). Findings indicated that quercetin
improved insulin signalling and sensitivity and thereby promoted the cellular
actions of insulin in an acquired model of insulin resistance.
In previous pharmacological investigations, Ivorra
et al. (1989) reported that â-sitosterol induced the
uptake of insulin from â-cells and produced an anti-hyperglycemic effect.
On the other hand, stigmasterol, lupeol, ursolic and oleanolic acids showed to
have hypoglycemic activity. Oleanolic acid and semi-synthetic derivatives were
described as â-glucosidase inhibitors. Finally, triterpenoids induced an
anti-diabetic effect by different pathways, and their combination could provoke
a synergic effect.
CHAPTER II. MATERIALS AND METHODS
II.1. Collection and identification of plant materials
The fruits and twigs of Ficus ovata were collected
from Mount Kala, Centre region of Cameroon. The plant was identified at the
Cameroon National Herbarium, Yaounde, where a voucher specimen was conserved
under the reference number 26996SRF/Cam. The collected plant parts
were separated from undesirable materials. They were dried under the
shade separately. The plant parts were ground into tiny debris with
the help of a suitable grinder, kept in a cool and dry place until analysis
commenced.
Preparation of extracts
We weight 125g of each plant part and macerated separately in
1L of ethanol 95% or 1L of ethanol: water solution in the ratio 1:1 for
48hours. The whole mixture was successively filtered through a piece of clean,
white cotton material. The filtrates (ethanolic and hydroethanolic extracts of
the twigs and fruits) obtained were evaporated to dryness in a drying room. We
obtained four extracts as shown below (figure 9).
Grinding and drying under the shade
Maceration with ethanol or hydroethanolic (1:1) solvents for
48H,
Filtration
Residue
Filtrate
Solvent
Evaporation
FOHF (1:1) Extract
FOEF
Extract
Twigs and Fruits of Ficus ovata (moraceae)
FOHT Extract
FOET
Extract
37°C
Figure 9 :
protocol for the extraction by maceration in ethanol and
hydroethanol (1:1)
FOHT: Ficus Ovata Hydroethanolic Twigs
FOHF: Ficus Ovata Hydroethanolic Fruits
FOET: Ficus Ovata Ethanolic Twigs
FOHF: Ficus Ovata Ethanolic Fruits
II.2. In vitro study
II.2.1. Phytochemical screening of the extracts
In view of determining the different secondary metabolites
responsible for the biological activity of the plant, extracts underwent
phytochemical screening as follows;
1- Test for Phenol was done by dissolving 250
mg of each extracts in 4 ml of distilled water and the content heated for 15
minutes. After cooling and filtration 2 drops of freshly prepared ferric
cyanate solution (1 ml FeCl3 1% and 1ml KFe (CN)6) was
added to 1 ml of each filtrate. The presence of a greenish-blue coloration
indicated the presence of polyphenols (Harbone, 1976).
2- Test for Alkaloids (Mayer test)
was done by heating 100 mg of the each extracts in 2 ml of
H2SO4 2% for 2 minutes after which the content was
filtered. Few drops of the Mayer reagent (1.358g HgCl2+500 ml
H2O and 0.8g KI +200 ml H2O) were added in 1ml of the
filtrate and the presence of a white precipitate or turbid solution was an
indicator of the presence of alkaloids (Odebeyi and Sofowora,
1978).
3- Test for Saponines was done by
adding 250 mg of the extract in 5 ml of distilled water. After vigorous
homogenisation the mixture was heated to boil, the appearence of foam that
persisted 20 minutes after cooling was an indicative of the presence of
saponines (Wall et al., 1954).
4- Test for Tannins was done by adding 100 mg
of each extracts in 2 ml of distilled water followed by heating in a water bath
and then filtering. Few drops of 3% ferric chloride were added in 1 ml of
filtrate and the observation of a blue-black or greenish-dark coloration
indicated the presence of tannins (Trease and Evans, 1989).
5- Test for phlobatannins was done by
dissolving 100 mg of each extract in 2 ml of distilled water. After filtration,
to 0.5 ml of each filtrate was added 1 ml of hydrochloric acid 1% and the
deposit of a red precipitate was an indicator of the presence of phlobatannins
(Trease and Evans, 1989).
6- Test for glycosides was done by dissolving
100mg of each extract in 5 ml of HCl then neutralised by 5 ml of 5% caustic
soda (soude). Drops of Fehling's solution [A (40 g of CuSO4 5
H2O per litre) + B (160 g of tartrate double of sodium and potassium
+ 130 g of NaOH per litre)] were added one after another and the appearance of
a red precipitate was an indicative of the presence of glycosides
(Trease and Evans, 1978).
7- Test for flavonoids was done by dissolving
250 mg of each extract in 5 ml of sodium hydroxide 1N.The observation of a
yellow solution is a preliminary evidence of the presence of
flavonoids and the decolourisation of the yellow colour observe on the addition
of a few drops of concentrated HCl confirms its presence (Trease and
Evans, 1978).
Preparation of variable concentration of
extracts
The mother solution (5 mg/ml) was prepared by dissolving 100
mg of the pure extract with 20 ml of water. After vigorous homogenising, the
following daughter solutions were prepared. It is from this working solution
that the test below was carried on.
Table V: Preparation of working
solution of our extract
|
Tubes
|
1
|
2
|
3
|
4
|
5
|
6
|
7
|
8
|
9
|
|
Concentration (mg/ml)
|
5
|
2.5
|
1.5
|
0.75
|
0.5
|
0.25
|
0.05
|
0.025
|
0.012
|
|
Volume of extract (ml)
|
5
|
2.5
|
1.5
|
0.75
|
0.5
|
0.25
|
0.05
|
0.025
|
0.012
|
|
Volume of solvent (ml)
|
0
|
2.5
|
3.5
|
4.25
|
4.5
|
4.75
|
4.95
|
4.975
|
0.980
|
|
Final volume (ml)
|
5
|
5
|
5
|
5
|
5
|
5
|
5
|
5
|
5
|
II.2.2. Determination of the antioxidant potential of the
plant extracts
II.2.2.1. Determination of polyphenol content using Folin
ciocalteu method
Principle: This method is based on the
reduction of a phosphomolibdic-tungstinic chromogene by an antioxidant and a
change of colour with the absorbance measured at 750nm using a
spectrophotometer. This reagent constitute of a mixture of tungstinic and
phosphomolybdic acids. In alkali medium (sodium carbonate), it developed a blue
colouration of which the absorbance is measured at 750nm. Ethanol (0.3
ml) in the place of extract is used as the blank. The antioxidant activity is
expressed as the number of equivalents of catechin (Singleton and
Rossi, 1965).
- Preparation of the reagent
Folin-ciocalteu:
A stock solution Folin reagent of (10 ml) of concentration 2 N
was introduced in a conical flask of 100 ml and the volume adjusted with water
to 100ml so as to obtain a solution of 0.2 N.
- Preparation of catechine
standard:
Catechin (2 mg) was dissolved in 10 ml of methanol to obtain a
solution of concentration 1mM from which other solutions with diverse
concentration were prepared.
Procedure: The polyphenolic
concentration of the extracts was determined using folin-ciocalteu reagent
(sigma chemical Co St Louis, MO) diluted 10 times before use. To determine the
total polyphenol concentration, 10 ul of the hydrolyse extract was added in 1ml
of Folin solution diluted 10 times , after 30 minutes of incubation the
absorbance was measured at 750 nm using the spectrophotometer. Catechine was
used as a standard.
II.2.2.2. DPPH (1, 1-diphenyl-2-picrihydrazyl) antiradical
activity
Principle: DPPH is relatively stable nitrogen
centered free radical that easily accepts an electron or hydrogen radical to
become a stable diamagnetic molecule. DPPH antioxidant assay is based on the
ability of 1, 1-diphenyl-2-picryl-hydrazyl (DPPH), a stable free radical, to
decolorize in the presence of antioxidants. The DPPH radical contains an odd
electron, which is responsible for the absorbance at 517 nm and also for a
visible deep purple colour. When DPPH accepts an electron donated by an
antioxidant, the DPPH is decolorized, and can be quantitatively measured due to
the changes in absorbance (Katalinie et al.,
2003).
Procedure: 20 ul of none hydrolysed aqueous
extract was introduced in 2 ml of methanolic solution of DPPH (0.3 mM). After
30 minutes of incubation in the dark, the absorbance was measured with a
spectrophotometer at 517nm. A control was also made (DPPH with water only). The
percentage of inhibition of the DPPH radical by the specimen was calculated
using the formular of Yen and Duh, (1994) as follows:
% of inhibition =  
Where Ac is absorbance at time = 0 min and Ae is the
absorbance after 30 minutes of incubation.
II.2.3.The anti-á-amylase effect of Ficus ovata
extracts
Principle: The enzymatic activity was
measured by the colorimetric technique base on the disappearance of the
substrate in the reaction medium. This involved the inhibitory effect of
extract on pancreatic alpha-amylase ability to hydrolyse starch (starches
exists in the form of granules, composed of millions of molecules of
amylopectin and a higher number of molecules of amylose) into products
principally maltose that is colourless as seen in the reaction below. The
remaining substrate was thus quantified by adding iodine solution (iodine and
potassium iodide) in the reaction medium and the presence of a blue colour is
an indicator of the quantity of substrate remaining (Komaki et
al., 2003).
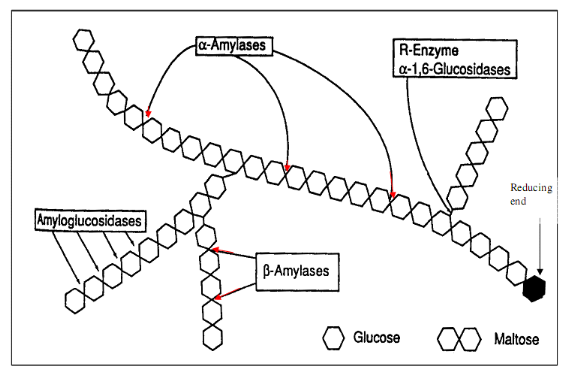
Figure 10 :
Mechanism of pancreatic alpha-amylase activity (Tormo et al,
2004)
Preparation of solutions
· Starch solution 10g/l (1%)
Irish (sigma) starch (5g) was introduced in a beaker
containing 100 ml of distilled water after which it was heated for 30 minutes
on a hot plate. The volume was completed to 500ml with distilled water
· Tris -HCl buffer pH 6.9 ;
0.05M
CaCl20.(56 g) of and 3.04 g of Tris was introduced
in a beaker containing 490 ml of distilled water, after complete
solubilisation, the pH was adjusted to 6.9 with dilute HCl.
· Iodine and Potassium Iodide
solution
One gram (1g) of potassium iodide and 100 mg of iodine are put
in a beaker containing about 490ml of distilled water. After complete
dissolution the solution was acidified to a pH of 1 with non title dilute HCl
and the volume was adjusted to 500 ml with distilled water.
· Preparation of a pig pancreatic
alpha-amylase
This was prepared to a concentration of 30ug/ml from the pure
pancreatic alpha-amylase of pig type V1-A (sigma).
· Evaluation of the activity of alpha-amylase
For each daughter solution there was an essay and a blank (no
substrate). A standard was also prepared where enzyme and substrate were
absent. 20 ul of á-amylase solution (30ug/ml) and the corresponding
volumes of Tris-HCl (0.05M, pH 6.9) and extract was introduced in each tube.
The mixture was pre-incubated at 37°C for 15 minutes and a fixed volume of
starch (1%) was then added in essay tubes followed by incubation at 37°C
for 15 minutes. The reaction was stopped by adding 2 ml of acidified iodine
solution and potassium iodide (pH 1). The intensity of colour of each tube was
determined against the blank through a spectrophotometer at an absorbance of
580nm. Methodology can be presented in a table as shown below.
Table VI: Methodology of á-amylase
inhibition
|
Tubes
|
standard
|
E0
|
BE0
|
E1
|
BE1
|
E2
|
BE2
|
E3
|
BE3...
|
E9
|
BE9
|
|
Enzyme (ul)
|
0
|
20
|
20
|
20
|
20
|
20
|
20
|
20
|
20
|
20
|
20
|
|
Extract (ul)
|
0
|
0
|
0
|
20
|
20
|
30
|
30
|
30
|
30
|
30
|
30
|
|
Buffer (ul)
|
1400
|
1380
|
1480
|
1350
|
1450
|
1350
|
1450
|
1350
|
1450
|
1350
|
1450
|
|
PREINCUBATION AT 37°C FOR 15 MINUTES
|
|
Starch (ul)
|
100
|
100
|
0
|
100
|
0
|
100
|
0
|
100
|
0
|
100
|
0
|
|
INCUBATION AT 37°C FOR 15 MINUTES
|
|
Iodine+KI(ml)
|
2
|
2
|
2
|
2
|
2
|
2
|
2
|
2
|
2
|
2
|
2
|
|
Final vol (ml)
|
3.5
|
3.5
|
3.5
|
3.5
|
3.5
|
3.5
|
3.5
|
3.5
|
3.5
|
3.5
|
3.5
|
The optical density OD for the final solutions was measured
using a spectrophotometer. The intensity of the colour of each tube is
determined against the blank.
Calculations of á- amylase
inhibition
- To get the quantity of the substrate
transformed
OD of the initial substrate (standard) - OD of the remaining
substrate (essay and blank)
This enables the elimination of non specific reaction between
the enzyme and the extract.
- Concentration of the transformed substrate
is gotten as follows
Concentration =  
- Enzyme activity
This concentration was gotten after15 minutes
Therefore, Activity =  
- Percentage inhibition
%inhibition =  
Where A is the decrease of absorbance in the absence of
extracts and B is the decrease of absorbance in the presence of extracts.
II.3. In vivo study
II.3.1. Experimental animals
Three month old male Wistar Albino rats weighing
175-225g were obtained from the animal house of the laboratory of Biochemistry,
Department of Biochemistry, University of Yaoundé I, Cameroon. All
animals were kept in an environmentally controlled room with a 12h light/12h
dark cycle .The animals had free access to water and standard rat diet. These
rats were used for the BGT, OGTT and the acute preventive treatment. Small male
Wistar rats of age 2 months with average weight 100-120 g was use for
acute toxicity study.
Experimental food: The animals where fed on
standard laboratory diet made up of corn flour (60%), wheat (10%), fish (12%),
soya beans (15%), palm oil (2%), vitamin complex (0.5%), and minerals
(1.5%).
II.3.2. Evaluation of the acute toxicity effect of
hydroethanolic extracts
This was aimed at evaluating the toxic effect of a single dose
of a product administrated once. The protocol use was that of test limit
proposed by OECD (2004). It recommended the administration of
a single dose (=5000 mg/kg of the body weight) of a substance to experimental
animals (rats) after which an intensive observation of the physiological
changes was done for 48 hours. The animals were observed for 2 weeks and their
physiological parameters registered. After two weeks those that survived were
sacrificed and their blood collected for appropriate analysis (markers of
toxicity). The rats were treated as follows; 3 groups of 5 rats were
constituted as seen below (table VII)
Table VII: Repartition of animals for acute
toxicity study of extracts
|
Groups
|
Treatment
|
|
Control
|
Distilled water
|
|
FOHF 5000mg/kg
|
Single dose of 5000mg/kg body weight of hydroethanolic fruit
extract of F ovata
|
|
FOHT 5000mg/kg
|
Single dose of 5000mg/kg body weight of hydroethanolic twig
extract of F ovata
|
II.3.4. Effect of extracts on glycemia
Glycemia was evaluated using a glucose meter
(SD-check) and blood glucose test strips. The principle includes quantifying
the blood glucose based on the enzymatic conversion of glucose into gluconic
acid in the presence of glucose oxydase (300unites/100strip) and potassium
ferrocyanide (mediator 9.0mg/100strip). The strip is made up of electrodes that
measure the level of glycemia. Glucose in blood mixed with reagent on the test
strip creates a small electric current. The intensity of the current created
depends on the quantity of glucose in blood. The quantity of gluconic acid
formed, measured by electric impedance is directly proportional to the quantity
of glucose contained in the test zone (Ellen et al.,
2003).
Procedure: A drop of fresh blood placed on
the microplate will migrate by capillarity and filled the test zone. Few
seconds after, the quantity of glucose appears on the screen of the apparatus
in mg/dl.
II.3.4.1. Evaluation of hypoglycemic activity in hyperglycemic
rats
For this, 3 groups of 5 hyperglycemic rats where constituted
and treated as follows:
Table VIII: Repartition of animals for the
hypoglycemic test
|
Groups
|
Treatment
|
|
Control
|
Distilled water (control)
|
|
FOHF 300mg/kg BW
|
300mg/kg body weight of hydroethanolic fruits extract
|
|
FOHT 300mg/kg BW
|
300 mg/kg body weight of hydroethanolic twigs extract
|
All the rats being at fasted state throughout the experiment,
the fasting blood glucose test of the various rats was done before
administration of our extracts (0h). The extracts were administrated orally by
intra-gastric route using an oesophageal probe followed by successive glucose
test measurement determined at instants of 2h, 5h, by incision of the tail and
placing a drop of blood on the glucose strips and the glucose meter reading
registered.
II.3.4.2. Evaluation of the antihyperglycemic activity in
normoglycemic rats
Test of antihyperglycemia provoked by oral route in normal
rats (oral glucose tolerance test): To evaluate the capacity of the organism to
manage glucose, 3 groups of 5 rats were constituted and treated as shown in
table IX below:
Table IX: Repartition of animals for the
antihyperglycemic test
|
Groups
|
Treatment
|
|
Negative Control
|
Distilled water (control)
|
|
Positive Control
|
2g/kg body weight of glucose
|
|
FOHF 300mg/kg BW
|
2g/kg BW of glucose + 300mg/kg body weight of hydroethanolic
fruit extract
|
|
FOHT 300mg/kg BW
|
2g/kg BW of glucose + 300mg/kg body weight of hydroethanolic
twigs extract
|
All the rats being at fasted state throughout the experiment,
the fasting blood glucose test of the various rats was done before
administration of our extracts (0h). The extracts were administrated orally by
intra-gastric route using an oesophageal probe, 30mins after, 2g/kg body weight
of glucose (test 1 and 2) was administration followed by successive glucose
test measurement determined at instants of 0.5h, 1h, 2h. Glucose measurement
was done by incision of the tail, a drop of blood placed on the glucose strip
and the glucose meter reading registered.
II.3.5. Evaluation of the
modulation effects of hydroethanolic fruits and twigs on some biomarkers of
diabetes type 2 on rat subjected to high fructose-high cholesterol diet
Table X: Slightly
modify food composition as proposed by Dhandapani (2007)
|
Composition
|
Control (%)
|
Atherogenic diet + fructose
|
|
Proteins (powder milk)
|
22
|
20
|
|
Carbohydrates (peel corn flour and wheat flour
(3:2)
|
55
|
50
|
|
Fructose
|
0
|
5
|
|
Lipids (hydrogenated fats and margarine)
|
15
|
17
|
|
Mineral salts (bone flour and NaCl (3:1)
|
4
|
4
|
|
Vitamins
|
1
|
1
|
|
Fibres (Cellulose)
|
3
|
3
|
For the preventive treatment, 4
groups of 5 rats were constituted as follows;
Table XI:
Repartition of animals for the preventive treatment with extracts
|
Groups
|
Treatment
|
|
Negative control
|
Non atherogenic diet and distilled water
|
|
Positive control
|
Atheregenic diet and gavages with 2ml of fructose(10%) + 2ml of
cholesterol (1.5%) 3 times a week
|
|
FOHF 300mg/Kg BW
|
Same as positive control and gavages with 300mg of FOHF/Kg of
BW everyday
|
|
FOHT 300mg/Kg BW
|
Same as positive control and gavages with 300mg of FOHT/Kg of
BW everyday
|
Experimental procedure
Male Wistar rats (175-225g) were divided into four
groups of rats. Food and water was provided ad libitum. The body
weights of rats were measured after 12 hours fasting period before
experimentation begins. The control group received just distilled water while
the three other groups received fructose and cholesterol by the intra-gastric
route. Test groups received FOHT and FOHF. The positive control received no
treatment. Fructose was administrated one hour before the administration of the
various extracts. The weights were taken again on day 7 and day 14
(Dhandapani et al., 2007, Idowu et al.,
2010).
At the end of the experimental period (14 days), animals were
kept 12 hours without food and water and their blood glucose taken. Fasting
rats were sacrificed under light anaesthesia with ether vapour. Blood collected
in EDTA tubes from the jugular artery was centrifuged for 10min at 3400 rpm and
the supernatant constituting the plasma was collected into dry eppendorf tubes
and stored at -20°C for some biochemical analysis. Tissue homogenate was
done by collecting the heart free from fat, and blood by rinsing in a solution
of 0.9% (w/v) NaCl. After anatomical, macroscopical, and comparative
observation, 1g of the organ was grinded in a mortar and homogenized in 10 ml
of 0.9% (w/v) NaCl. The resulting homogenate was put in a centrifuge tube,
allowed to sediment for about 1 hour before centrifuging at 3400 rpm for 10
minutes. The resulting supernatant which constitutes the homogenate was kept in
eppendorf tubes and conserve -20°C for later use in biochemical assay.
II.5. Biochemical experimentation
II.5.1. Determination of plasmatic lipid profile
II.5.1.1. Quantitative determination of cholesterol (chronolab
kits).
Fatty acid
HO
Cholesterol
+
Cholesterol ester
R - C - O
= O
Cholesterol esterase
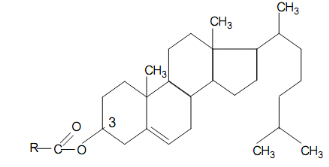
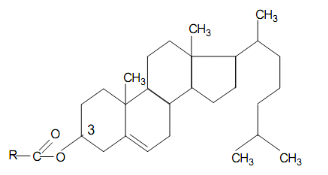
Principle The cholesterol present in the
sample generates a coloured complex as shown.
Cholesterol + O2
cholesterol oxidase
4-cholestenona + H2O2
2H2O2 + Phenol + 4-Aminophenazone
peroxidase Quinoneimine + 4H2O
The intensity of the colour formed is proportional to the
cholesterol level (Naito, 1984).
Reagents (see annex 2)
Procedure: Total cholesterol was determined
by first preparing the working reagent (mixture of 2 reagents). The blank (1mL
WR), standard (1 mL WR and 10 uL standard) and the samples (1 mL WR and 10 uL
sample) were prepared. The solution was mixed and incubated for 10 min at room
temperature. The spectrometer was adjusted to zero with distilled water. The
absorbance (A) of samples and standard were read against the blank at 500nm.
The colour was stable for at least 60 minutes.
Calculation: cholesterol in the sample mg/dL =
II.5.1.2- Quantitative determination of Triglycerides
(chronolab kits).
Principle Sample triglycerides incubated with
lipoprotein lipase (LPL) liberate glycerol and free fatty acids. Glycerol is
converted to glycerol- 3-phosphate (G3P) and adenosine -5-diphosphate (ADP) by
glycerol kinase and ATP. Glycerol-3-phosphate (G3P) is then converted by
glycerol phosphate dehydrogenase (GPO) to dehydroxyacetone phosphate (DAP) and
hydrogen peroxide (H2O2). In the last reaction, hydrogen
peroxide (H2O2) reacts with 4-aminophenazone (4-AP) and
p-chlorophenol in the presence of peroxidise (POD) to give a red colour dye:
The intensity of the colour formed is proportional to the Triglycerides
concentration in the sample (Fossati et al.,
1982).
Glycerol + ATP Mg2+
glycerol-3-phosphate + ADP
GK
Glycerol-3-phosphate + O2
dihydroxyacetone phosphate + H2O2
GPO
2H2O2 + 4- aminoantipyrine + 4-
chlorophenol quinoneimine + HCl +
4H2O
POD
R, R1, R2 et R3 = variable
radicals
+
CH2 - OH
CH2 - OH
CH - OH
Glycérol
Lipoprotein lipase
CH2 - O - C - R1
CH2 - O - C - R3
R2 - C - O - CH
= O
= O
= O
Triglycerides
R - C - OH
= O
Fatty acids
.
Reagents (see annex 3)
Procedure: Triglycerides were determined by
first preparing the working reagent (mixture of 2 reagents). The blank (1mL
WR), standard (1 mL WR and 10 uL standard) and the samples (1mL WR and 10 uL
sample) were prepared. The solutions were mixed and incubated for 10 min at
room temperature. The spectrometer was adjusted to zero with distilled water.
The absorbance (A) of the samples and standard were read against the blank at
500nm. The colour was stable for at least 60 minutes.
Calculation: Triglycerides in the sample mg/dL
=  
II.5.1.3- Quantitative determination of HDL Cholesterol
(chronolab kits)
Principle: The very low density (VLDL) and
low density (LDL) lipoproteins from serum or plasma are precipitated by
phosphotungstate in the presence of magnesium ions. After removed by
centrifugation the clear supernatant containing high density lipoproteins (HDL)
is used for the determination of HDL cholesterol (Young,
2001).
Reagents (see annex 4)
Procedure: Precipitation was done by pipeting
100 uL of the reagent and 1mL of sample into the centrifuge tube. The solution
was well mixed and allowed to stand for 10 minutes at room temperature followed
by centrifuge at 4000 rpm for 10 minutes. The supernatant was collected and
tested for HDL cholesterol (HDLc).
Calculations: HDLc in the sample mg/dL =  
II.5.1.4- Quantitative determination of VLDL and LDL
Cholesterol
Calculation
According to the Friedwald formula (Friedwald et
al., 1972):
VLDL Cholesterol = 
LDL Cholesterol (mg/dL) = Total Cholesterol - HDL Cholesterol -
 
II.5.2. Determination of Markers of hepatic and renal
toxicity
II.5.2.1. Determination of total protein (Biuret method)
Principle: Copper ions react in alkali
solution, with protein peptide bonds to give a purple coloured Biuret complex.
The amount of complex formed is directly proportional to the amount of protein
in the specimen (Henry et al., 1974).
Reagents (see annexe 5)
Procedure: Total protein (TP) content was
measured by preparing reagent blank (20 ul distilled water and 1000 ul Biuret
reagent), standard (1000 uL Biuret reagent and 20 uL calibrator) and the sample
(1000uL Biuret reagent and 20 uL sample). After mixing and incubating for 30
min at 20-25°C the absorbance (A) of the samples and standard were read
against the blank at 550nm.
Calculation: Total protein concentration
(g/l) = 190 × Sample absorbance
II.5.2.2. Determination of creatinine level (chronolab
kits)
Principle: The assay is based on the reaction
of creatinine with sodium picrate as described by Jaffe. Creatinine reacts with
alkali picrate forming a red complex. The time interval chosen for measurement
avoids interference from other serum constituents (Murray et al.,
1984a).
+
+ H2O
NaOH
Creatinine
Picric acid
Red complex


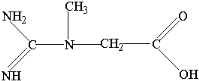
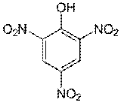
.
The intensity of the colour formed is proportional to the
creatinine level in the sample.
Reagents (see annexe 6)
Procedure: The blank (1 ml WR), standard (1
ml WR and 100 uL standard) and sample (1 ml WR and 100 ul sample) were pipette
into cuvettes. After mixing, the stop watch was started and the absorbance (A
1) read after 30 seconds and 90 seconds (A 2) at
500nm.
Calculation: ?A =A2 -
A1
Creatinine in the sample (mg/dl) =  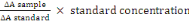
II.5.2.3. Determination of transaminase activities (aspartate
aminotransferase ASAT and alanine aminotransferase ALAT). (chronolab kits)
Principle: Aspartate aminitransferase (ASAT)
or Glutamate oxaloacetate (GOT) catalyses the reversible transfer of an amino
group from aspartate to á-ketoglutarate forming glutamate and
oxaloacetate. The oxaloacetate produced is reduced to malate by malate
dehydrogenase (MDH) and NADH (Murray et al.,
1984b).
CH2 - COOH
H2N - CH - COOH
Aspartate
Glutamate
CH2 - COOH
CH2
H2N - CH - COOH
á -ketoglutarate
CH2 - COOH
CH2
C = O
COOH
CH2 - COOH
C = O
COOH
Oxaloacetate
+
+
ASAT
Oxaloacetate + NADH + H? MDH
Malate + NAD?
Alanine aminotransferase (ALAT) or Glutamate pyruvate
transaminase (GPT) catalyses the reversible transfer of an amino group from
alanine to á-ketoglutarate forming glutamate and pyruvate. The pyruvate
produced is reduced to lactate by lactate dehydrogenase (LDH) and NADH.
Alanine
CH3
H2N - CH - COOH
Pyruvate
CH3
O = C - COOH
á -ketoglutamate
CH2 - COOH
CH2
C = O
COOH
+
+
Glutamate
CH2 - COOH
CH2
H2N - CH - COOH
Pyruvate + NADH + H? LDH
Lactate + NAD?
The rate of decrease in concentration of NADH, measured
photometrically is proportional to the catalytic concentration of ASAT and ALAT
respectively.
Reagents (see annex 7)
Procedure: The same procedure was use both
for ASAT and ALAT where after pipetting 1mL of the WR and 100 uL of sample into
a cuvette it was mixed and incubates for 1 minute. The spectrometer was
adjusted to zero with distilled water. The initial absorbance (A) of the sample
was read, stopwatch started and the absorbance at 1 minute intervals read
thereafter for 3 minutes at 340nm. The difference between absorbance and the
average absorbance differences per minutes (?A/min) were calculated.
Calculation: ?A/min x 1746 =U/L of ASAT or
ALAT respectively
Units: one international unit (IU) is the amount of enzyme
that transforms 1umol of substrate per minute, in standard conditions. The
activity is expressed in units per litre of sample (U/L).
II.5.3. Determination of Nitric Oxide level
Principle: This is based on the reaction of
diazotization described by Griess in 1879. It describes the
chemical reaction between sulphanilamide and naphtylethylenediamine
dihydrochloride (NED) under acidic conditions (phosphoric acid). Sulphanilamide
and NED compete for nitrite in the Griess reaction. This reagent detects
NO2- in a variety of biological and experimental liquid
samples such as plasma, serum, urine and tissue culture. This system detects
the nitrite formed which is one of the primary stable and non volatile
compounds from degradation of nitric oxide in biological mediums
(Manish et al., 2006).
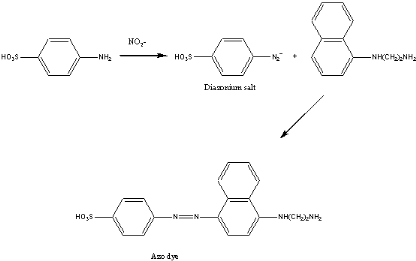
Reagents: N-1-naphtylethylene dichloride
diamine (NED)
· Sulphanilamide: 1% sulphanilamide in 5% orthophosphoric
acid
· Standard nitrite: 0.1M of sodium nitrite in distilled
water.
A solution of sulphanilamide and dichloro N-1-naphtylethylene
diamine was prepared and allowed for 15-30 minutes at room temperature.
Procedure: In 100 uL of sample, 100 uL of
sulphanilamide solution was added and pre-incubated for 5-10 minutes at room
temperature while protected from light. After pre-incubation, 100 uL of
dichloro N-1-naphtylethylene diamine was added and incubated for 5-10 minutes
at room temperature and protected from light.
The presence of a purple/mangenta colour is an indicator of
the presence of nitrite formed.
The absorbance was read at 540nm. (å (reactivity) =
39500M-1CM-1)
II.6. Statistical analysis
SPSS program: version 10.0 for Windows was used and
the results presented as mean #177; SEM. Differences between means were done by
a one-way analysis of variance (ANOVA) followed by post hoc test using Tamhane
and LSD. Values of p< 0.05 were taken to imply statistical significance.
CHAPTER III. RESULTS AND DISCUSSION
III.1.Results
III.1.1. Yield of extraction and phytochemical screening
The results of the extraction are represented on the table XII
below.
Table XII: Yield
of extraction
|
Twigs
|
Twigs
|
Fruit
|
Fruit
|
|
solvent
|
Ethanol:water(1:1)
|
Ethanol
|
Ethanol
|
Ethanol:water(1:1)
|
|
% yield
|
7.28
|
5.66
|
2.78
|
7.21
|
Two solvent system were used for the extraction of the fruits
and twigs of F. ovata which where ethanolic and hydroethanolic solvent
systems. The above results show that the hydroethanolic solvent gave higher
yield than the ethanolic solvent for extraction of the fruits and twigs.
The result of phytochemical screening are represented on table
XIII below
Table XIII: The
phytochemical screening results.
|
Alkaloids
|
Saponins
|
Flavonoids
|
Tannins
|
Phlobatannins
|
Glycosides
|
Phenols
|
|
FOEF
|
+
|
+
|
+
|
+
|
-
|
+
|
+
|
|
FOET
|
-
|
+
|
+
|
+
|
+
|
+
|
+
|
|
FOHF
|
+
|
+
|
+
|
+
|
-
|
+
|
+
|
|
FOHT
|
+
|
+
|
+
|
+
|
+
|
+
|
+
|
FOEF= Ficus ovata ethanolic fruits; FOET= Ficus ovata
ethanolic twigs; FOHF= Ficus ovata hydroethanolic fruits; FOHT= Ficus
ovata hydroethanolic twigs
Generally, extracts of fruits and twigs of Ficus
ovata contain groups of bioactive compounds such as alkaloids, glycosides,
saponins, and polyphenols such as flavonoids, tannins and phenols.
Phlobatannins were absent in the fruit extracts of Ficus ovata and
alkaloids where absent in ethanolic fruits.
III.1.2. Result of the antioxidant potential of our plant
extracts
III.1.2.1. Polyphenol
content of our extracts
The polyphenol content of our extracts is represented on table
XIV below.
Table XIV :
Polyphenols content results
|
FOEF
|
FOHF
|
FOET
|
FOHT
|
|
Concentration (mg catechin Eq)
|
718.142 #177; 12.910a
|
486.876 #177; 8.606b
|
149.105 #177; 38.730c
|
207.922 #177; 4.303d
|
Table XIV above shows that all extracts had polyphenols with
FOEF having a higher content (718.142 mg catechin Eq). We also note a
significant difference (P<0.05) in polyphenols content for all the
extracts.
III.1.2.2. DPPH (1,
1-Diphenyl-2-Picrilhydrazyl) antiradical activity of extracts
Figure 11 below represent the inhibition percentages obtain
after an evaluation of antiradical activity of the ethanolic and hydroethanolic
fruits and twigs extracts respectively.
Antiradical activity of twigs extracts
Antiradical activity of fruits extracts
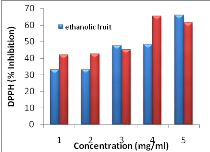 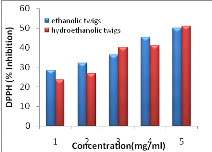
Figure 11 :
Antiradical activity of extracts using the DPPH method
Figure 11 above shows that for both plant parts, the
hydroethanolic solvent was the best system with a high antiradical activity
compared to ethanolic solvent system (p<0.05) and
the scavenging activity increases as concentration increases. Moreover the
inhibition profile of the hydroethanolic fruits was the best with an IC 50 of
0.701 mg/ml as compared to the others and this IC 50 was significantly
different (p<0.05) from all the other extracts.
III.1.3. The effect of extracts on starch digestion in vitro.
Figure 12 below represents the variation of the inhibition of
activity of á-amylase (digestive enzyme) activity in the
presence of different concentrations of extracts.
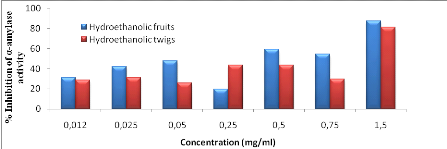
Figure 12 :
Effect of extracts on the inhibition of pancreatic á-amylase
activity
From figure 12 above, we observed that the percentage
inhibition of the alpha amylase activity increased with increase in
concentration for both extracts with that of hydroethanolic fruits being
significantly higher compared to that of hydroethanolic twigs. Also, when the
concept of IC50 values was used, hydroethanolic fruit extract showed the best
result with an IC50 of 0.4727 mg/ml as compared to that of the twigs having an
IC50 of 0.7473mg/ml. á-Amylase inhibitory activity was measured at
various concentrations and the inhibition was observed at all doses (Fig. 12).
When comparing the total water soluble phenolic concentration of hydroethanolic
extracts with the á-amylase inhibitory activity, a correlation was
observed.
III.1.4. Acute toxicity study of the hydroethanolic fruits and
twigs extracts
III.1.4.1. Effect of extracts on the behaviour of experimental
animals
The behavioural reactions of rats under acute toxicity are
represented in table XV.
Table XV: Behaviour of rats during acute
toxicity study (48hours)
|
Observations
|
Negative control
|
FOHT
|
FOHF
|
|
General mobility
|
Normal
|
Normal 30min after
|
Normal 4hrs after
|
|
sleep
|
Normal
|
Normal
|
Normal
|
|
feeding
|
Normal
|
Normal 1hr after
|
Normal 6hrs after
|
|
faeces
|
Normal
|
Normal
|
Normal
|
|
Sensibility to sound
|
Jump immediately
|
Jump immediately
|
Jump immediately
|
|
death
|
No dead
|
No dead
|
No dead
|
From the above result we observe that these extracts at
5000mg/Kg of BW taken at a single dose do not lead to death. The other
parameters remain comparable to the negative control.
III.1.4.2. Effect of extracts on the variation of body
weight
We also evaluate the effects of the dose 5000mg/Kg BW of our
extract on the variation of body weight and the results are presented as
follows.
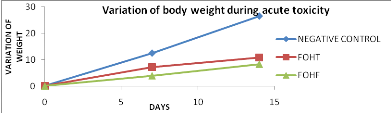
Figure 13 : Effect of extracts on
variation of body weight during toxicity
From the above figure (figure 13), we observe that, the weight
gain of the test groups was reduced as compared to that of the negative control
and the difference was significant (p<0.05).
III.1.4.3. Effect of extracts on transaminases activities and
creatinine
Table XVI below represent the result of markers of toxicity
after acute toxicity.
Table XVI: Effect of extracts on markers of
toxicity (ASAT, ALAT and Creatinine)
|
Groups
|
ASAT (U/L)
|
ALAT (U/L)
|
Creatinine (mg/dl)
|
|
Control
|
8.632 #177; 0.052
|
91.956 #177; 0.262
|
31.913 #177; 0.770
|
|
FOHT (5000mg/Kg BW)
|
5.652 #177; 0.354*
|
85.651 #177; 1.097*
|
24.880 #177; 0.919*
|
|
FOHF (5000mg/Kg BW)
|
6.867 #177; 0.420*
|
80.704 #177; 0.196*
|
37.248 #177; 2.688*
|
*: significant difference between the control and the test
groups at the threshold of 0. 05;
From the above results we
notice a significant decrease in the concentration of ALT and AST in the test
groups and equally a decrease in the concentration of creatinine for the
extract FOHT. We also observe an increase in the concentration of creatinine
for the FOHF extract.
III.1.5. The effect of extracts on glycemia
III.1.5.1 Hypoglycemic effect of extracts on hyperglycemic
rats
The evaluation of hypoglycemic effect of FOHT and FOHF on
hyperglycemic rats revealed the following
results.
Table XVII:
Hypoglycemic effects of extracts on hyperglycemic rats
|
Glycemia (mg/dl)
|
|
Time
|
0 Hour
|
2 Hours
|
5 Hours
|
|
Control
|
121.200 #177;1.162
|
102.800 #177; 2.991
|
79.000 #177; 6.380
|
|
FOHT
|
116.600 #177; 1.275
|
107.200 #177; 4.615
|
89.400 #177; 0.266
|
|
FOHF
|
115.600 #177; 5.568
|
106.800 #177; 1.554
|
105.600 #177; 5.140 *
|
*: significant difference between the control and the test
groups at the threshold of 0. 05;
There was a decrease in glycemia for all groups after the
administration of extracts from time 0 hour to the 5th hour. This
decrease was not significantly different from the 0 to 2nd hour
between the control and the test groups. From the 2nd to the
5th hour, the decrease was still not significant between the control
and the FOHT group but there was a significant increase between the control and
the FOHF group. The percentage decrease for the extract FOHT was significantly
higher (8.908%) than that of the extract FOHF (5.747%).
III.1.5.2. Antihyperglycemia effects of extracts on normal
rats
The evaluation of the effect of FOHT and FOHF extracts in the
regulation of glucose intolerance in rats revealed the following results (table
XVIII).
Table XVIII: Antihyperglycemic effect of
extracts on normal rats
|
Glycemia (mg/dl)
|
|
0 min
|
30 min
|
60 min
|
120 min
|
|
Negative control
|
88.000#177;3.705
|
105.600 #177; 2.970
|
100.900 #177; 2.770
|
93.300#177;1.164
|
|
Positive control
|
82.400#177;3.173*a
|
175.400#177;3.809*a
|
111.300#177;2.958*a
|
91.100#177;2.642*a
|
|
FOHT
|
99.300 #177; 1.685b
|
124.700 #177; 2.905 b
|
141.800 #177; 5.495 b
|
98.300#177;1.824 a
|
|
FOHF
|
89.300 #177; 1.271 b
|
171.700 #177; 7.256 b
|
182.200 #177; 10.914 b
|
143.000#177;3.977 b
|
*: significant difference between the positive control and
the negative control
a and b : significant difference between the control
and the groups FOHT and FOHF at the threshold of 0,05;
The variation of glycemia during the glucose tolerance test
was significantly higher in the positive control as compared to the negative
control. Glucose level increased significantly 30 minutes after administration
in the positive control as compared to the treated groups but this glucose
level decreased significantly from 30 minutes up to 120 minutes. The percentage
of decrease was higher with the FOHT extract (21.566%) as compared to the FOHF
extract (8.208%).
III.1.6. Modulatory effects of extracts on some biomarkers of
type 2 diabetes
After 14 days of experimentation, the results of the
biochemical parameters and the body weight evaluated between the control groups
revealed the importance of the implication of diet (atherogenic diet, high
fructose and high cholesterol) in the pathology of our animals.
III.1.6.1. Effect of
extracts on the body weight of experimental rats
Concerning body weight parameters, it was notice that the
negative control had a significant increase of about 31.448 g (16.24%) from the
first to the fourteenth day of experimentation as compared to 18.146 g (9.27%)
observed in rats of the positive control group. The FOHT and FOHF extracts
showed a significant decrease in the variation of body weight as compared to
the positive control (XIX).
Table XIX: Effect of extracts on the
variation of body weight
|
Weight
T0 (day 1)
|
Weight
T2 (day 7)
|
Weight
T3 (day 14)
|
|
Negative control
|
193.614 #177; 5.780
|
214.284 #177; 2.206
|
225.062 #177; 2.924
|
|
Positive control
|
195.672 #177; 7.495
|
207.506 #177; 7.551*a
|
213.818 #177; 7.291*a
|
|
Treated groups
|
|
FOHT(300mg/Kg)
|
195.942 #177; 10.866
|
177.912 #177; 9.405b
|
182.546 #177; 12.375b
|
|
FOHF(300mg/Kg)
|
194.214 #177; 10.329
|
186.784 #177; 12.715b
|
191.372 #177; 12.973b
|
*: significant difference between the positive control and
the negative control
a and b : significant difference between the positive
control and the groups FOHT and FOHF at p< 0,05.
III.1.6.2.Effect of extracts on fasting blood glucose after
experimentation
The fasting blood glucose at the end of experimentation was
not significantly different (p<0.05) between the negative and the positive
control group. The fasting blood glucose was significantly suppressed by the
hydroethanolic fruits extract of F. Ovata as compared to the positive
control but the FOHT extract shows no significant (figure 14).
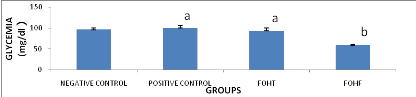
Figure 14 : Effect of extracts on
fasting blood glucose after experimentation
*: significant difference between the positive control and
the negative control
a and b : significant difference between the control
and the groups FOHT and FOHF at the threshold of 0,05;
III.1.6.3. Effect of
extracts on markers of lipid profil after experimentation
A significant increase (p<0.05) in plasmatic concentration
of total cholesterol (TC),triglycerides (TG), LDL-cholesterol and the
atherogenic index TC/ HDL-cholesterol and LDL-cholesterol/ HDL- cholesterol in
the positive control was observed as compared to the negative control (table
XX).
Table XX:
Effect of extracts on the markers of lipid profile
after experimentation
|
Groupes
|
Total cholesterol (mg/dl)
|
Triglycerides (mg/dl)
|
HDL-cholesterol (mg/dl)
|
LDL-cholesterol (mg/dl)
|
VLDL- cholesterol (mg/dl)
|
|
Negative control
|
56.732#177;7.943
|
19.500#177;4.184
|
34.928#177;1.069
|
17.903#177;6.817
|
3.900#177;0.836
|
|
Positive control
|
86.169#177;2,053*a
|
37.000#177;4,728*a
|
28.026#177;2,857*a
|
50.743#177;4,789*a
|
7.400#177;0.945*a
|
|
Treated groups
|
|
FOHT(300mg/Kg)
|
69.751#177;4.380b
|
30.791#177;7.783a
|
26.823#177;6.507a
|
36.769#177;4.938a
|
6.153#177;1.556a
|
|
FOHF(300mg/Kg)
|
65.830#177;5.256b
|
11.333#177;0.825b
|
45.542#177;6.329b
|
18.020#177;5.922b
|
2.266#177;0.165b
|
*: significant difference between the positive control and
the negative control. Chol: Cholesterol
a and b : significant difference between the control
and the test groups at the threshold of 0,05;
The consumption of this atherogenic diet and high
fructose-high cholesterol, lead to a significant increase (p<0.05) in the
concentration of total cholesterol which is contrary to the normal food. Also,
we also observed a significant (p<0.05) decrease of this parameter in the
test groups as compared to the negative control (table XX).
Equally, we observed a significant increase (p<0.05) in the
concentration of triglyceride, LDL-cholesterol and VLDL-cholesterol in the
positive control as compared to the negative control. Only the extract FOHF
significantly reduced (p<0.05) the concentration of triglyceride, LDL- and
VLDL- cholesterol.
Furthermore, we observed a significant increase (p<0.05) in
the plasmatic concentration of HDL- cholesterol in the test group FOHF as
compared to the positive control.
The atherogenic index CT/HDL- chol and LDL-chol/HDL-chol
reduced significantly (p<0, 05) for the FOHF extract as compared to the
positive control. There was no significant difference between the test group
that receives the FOHT extract and the positive control.
III.1.6.4. Effect of
extracts on the activity of transaminases (ASAT, ALAT), creatinine and total
protein levels
A significant increase (p<0.05) in, the creatinine and
protein levels were observed in the positive control as compared to the
negative control. This translates abnormality in the functions of the kidney.
The activity of transaminase ASAT/ALAT was not significantly different between
negative and the positive control.
Table XXI: Effect of extracts on the activity of
transaminases (ASAT, ALAT), creatinine and total protein levels
|
Groups
|
ASAT (U/L)
|
ALAT (U/L)
|
Creatinine (mg/dl)
|
Proteins (g/l)
|
|
Negative control
|
87.532#177;0,977
|
33.406 #177;0.977
|
1.202#177;0,442
|
68.476#177;3.041
|
|
Positive control
|
91.529#177;3,316a
|
37.674#177;2,048a
|
2.877#177;0,468*a
|
83.258#177;3.419*a
|
|
Treated groups
|
|
FOHT(300mg/Kg)
|
80.025#177;2.419b
|
32.941#177;2.907a
|
0.647#177;0.576b
|
72.181#177;4.754b
|
|
FOHF(300mg/Kg)
|
90.598#177;2.882a
|
31.777#177;0.553a
|
1.017#177;0.379c
|
79.040#177;1.837a
|
*: significant difference between the positive control and
the negative control
a, b and c : significant difference at the threshold
0,05 between positive control and the test groups.
There was a significant decrease (p<0, 05) in the
concentration of creatinine in the test groups as compare to the positive
control. The concentration of ALAT and ASAT of the test groups was not
significantly different (p<0, 05) from that of the positive control.
In addition, the concentration of protein was significantly
(p<0,05) reduced in the test group FOHT as compared to the positive control
but there was no significant difference between the test group FOHF and the
positive control.
The above results enable us to suggest that our atherogenic
diet and high fructose-high cholesterol intake has a positive effect on the
induction of hyperlipidemia and CVD.
III.1.6.7. Effect of
extracts on nitric oxide level
From the figure below, we observed that nitric oxide level was
significantly (p<0, 05) reduced in the positive control as compared to the
negative control in the plasma but not the heart. This implies that the diet
has produced a positive effect in the endothelia dysfunction.
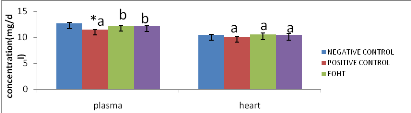
Figure 15 : Effect of extracts on nitric
oxide level in the plasma and heart
*: significant difference between the positive control and
the negative control
a and b : significant difference at the threshold 0,05
between positive control and the test groups
We also observed that at the level of the plasma, the positive
control was significant lower (p<0, 05) than in the test groups whereas at
the level of the heart the concentration of nitric oxide was not significantly
different between the positive control and the test groups
III.2.Discussion
The present study deals with two dimensions of the
antidiabetogenic effects of the plant extracts of F. ovata. In one
dimension, the hypoglycemic effect was measured. In the other dimension
hypolipidemic potential of this plant extracts was studied as there is a close
correlation between hyperglycemia and hyperlipidemia.
Preliminary, all four extracts screened for phytochemical,
revealed the presence of groups of bioactive compounds such as alcaloids,
glycosides, saponins, and polyphenolic compounds such as flavonoids, tannins
and phenols. Phlobatannins were absent in the fruit extracts of F.
ovata. These results correlate with that of Poongothai
(2011) whose investigation on the preliminary phytochemical screening
of Ficus racemosa linn bark reveal the presence of the above compound
and stated that they possess a variety of biological activity including
hypoglycaemia. Previous studies done on methanolic bark of F. ovata
extract reveal the presence of certain triterpenoids such as â
sitosterol, lupeol, and oleanolic acid (Kuate et al.,
2009) which are known to possess some antidiabetic activities..
Generally the polyphenolic content test and the DPPH
antiradical activity test showed that hydroethanolic extracts of fruits and
twigs had the best solvent system as compared to the ethanolic extracts for
each plant part. When comparing the total water soluble phenolic concentration
with the DPPH radical scavenging antioxidant activity of the fruits and twigs
extracts (table XIII and figure11), no positive correlation was observed. This
goes to support the hypothesis of Brand Williams et al.
(1995) that the DPPH kinetic is proportional to the amount of OH
group present on the phenolic compound (Claudia et al.,
2008). Thus, the hydroethanolic extracts may be rich in phenolic
coumpounds that have many OH groups leading to it high DPPH scavenging
activity. These compounds act as hydrogen donors to free radicals by stopping
lipid peroxidation at the stage of initiation (Claudia et al.,
2008).
Concerning acute toxicity, the extracts administsrated at a
unique dose of 5000mg/Kg lead to no deaths. Following the classification of
OECD (2001), which states that substances administstared at a
dose =5000mg/Kg of BW and that does not lead to a lethal effect, can be
presented as weakly toxic. This suggests that our extracts could be considered
as being weakly toxic.
In this study, we observed the inhibition of alpha amylase
activity by the hydroethanolic extracts with the fruits showing a high
inhibition profile as compared to the twigs. Also, concerning the hypoglycemic
test (BGT) in hyperglycemic rats, we did not observe a significant reduction of
glycemia between the control and the test groups throughout the 5 hours of
experiment. The percentage decrease on the blood glucose level of the
hydroethanolic twigs (8.908%) was higher than that of hydroethanolic fruits
(5.747%). The antihyperglycemia test done on normal rats showed that our
extracts have high lowering effect on glycemia 30 minutes after glucose loads
as compared to the positive control. From the 60th minutes to the
120th minutes, the glucose level was higher in the test groups than
the positive control. This may be due to the slow metabolism of glycosides
present in our plant that increases the blood glucose level. The percentage
decrease on the blood glucose level of the hydroethanolic twigs (21.566%) was
higher than that of hydroethanolic fruits (8.208%). This percentage decrease in
blood glucose in the hypoglycemic test and the improved glucose tolerance may
be due to various phytochemicals found to possess a wide range of activities,
which may help in protection against chronic diseases. For example, glycosides,
saponins, flavonoids, tannins and alkaloids have hypoglycemic activities; anti-
inflammatory activities. The terpenoids have also been shown to decrease blood
sugar level in animal studies (Poongothai, 2011). This made us
think that the hydroethanolic extract may act by stimulating the secretion of
insulin in beta cells of pancreas, increasing insulin sensitivity in addition
to inhibition of the alpha amylase activity and many other enzymes involved in
the transformation of dietary carbohydrate or glycogen to glucose. This
correlate with the study done by Tormo et al. (2004)
where after the administration of the polyphenolic extracts of fruits which had
presented a high inhibition of the alpha amylase activity in rats, showed a
lowering effect on the blood glucose of treated rats. This also correlates with
the work by Ortiz-Andrade et al. (2006) on
Glucosidase inhibitory activity of the methanolic extract from Tournefortia
hartwegiana where Pharmacological investigations, reported that
â-sitosterol induced the uptake of insulin from â-cells and
produced an anti-hyperglycemic effect. On the other hand, stigmasterol, lupeol,
ursolic and oleanolic acids showed to have hypoglycemic activity. Oleanolic
acid and semi-synthetic derivatives were described as â -glucosidase
inhibitors.
It is now well established that fructose feeding causes
insulin resistance in experimental animals. For this study the fasting blood
glucose at the end of experimentation was not significantly different between
the control groups and FOHT extract but that of the FOHF extract was
significantly lower than that of the positive control group. This could be
explained by the fact that the time of experimentation was not long enough to
result to insulin resistance or glucose intolerance as the glycemia after
experimentation for the positive control was less than 110mg/dl. This result is
contrary to that of Idowu et al. (2010) whose work on
the glycemic effect of Ficus exasperata in fructose induced
glucose intolerance and found that the extract ameliorated glucose intolerance.
Inspite of the absent of glucose intolerance, FOHF extract showed a blood
glucose lowering activity in vivo and this could be due to the fact that the
extracts may stimulate insulin secretion by the pancreas or/and enhance insulin
sensitivity in various organs especially the muscle and the live in a manner
similar to sulfonylureas.
The consumption of high fat diet by rats associated with
cholesterol and fructose throughout the sub acute experiment resulted in a
group of metabolic disorders which was felt at the level of some plasma
biochemical parameters in the absence of treatment. During the experimental
period, an increase in body weight variation was observed in the negative
control compared to positive control. This is contrary to the result obtained
by Raneva and Shimasaki (2005) who obtained the increase of
body weight in mice using high-fat diet during their study on the effects of
green tea catechins on lipid peroxidation on the organs of mice. In the treated
groups, the extracts FOHT and FOHF showed a significantly low weight variation.
Phytochemical Screening of the extracts revealed significant (p <0.05)
presence of polyphenols which could be involved in various mechanisms leading
to reduced energy reserves and thus reducing the variation of BW. They may
stimulate hepatic lipid metabolism and low accumulation of fatty acids in the
liver and visceral organs as shown by Murase et al.
(2002).
The results of lipid profile showed that the atherogenic diet,
high fructose-high cholesterols significantly increased (p<0.05) plasma
concentrations of total cholesterol, triglycerides and LDL cholesterol in the
positive control compared to negative control (Table XIX). These results are
comparable to those of Czerwinski et al. (2004) who
show increased consumption of dietary cholesterol resulted in a high
cholesterol, high triglyceride levels, high plasma lipid peroxides and
atherogenic index chol-LDL/chol-HDL. These high levels of LDL cholesterol in
the positive control could be attributed to their lack of recognition by their
receptors on the cell membrane. If LDL is not recognized by it receptors could
cause oxidation and endothelial dysfunction promoting leukocyte and platelet
adhesion and release of growth factors necessary for atherogenesis
(Lavoie, 2003). The treatment with the extract FOHF resulted
in a significant decrease (p <0.05) in plasma TC, triglycerides, VLDL and
LDL-cholesterol. But this decrease was not significant with the extract FOHT.
HDL-cholesterol concentration increased significantly with the administration
of the extract FOHF (Table XX). This improvement in lipid profile can be
explained by the presence of saponins in the extracts FOHF as shown by
Dhandapani (2007), working on the hypolipidemic activity of
extracts of Eclipta prostrata leaves in male albino rats of Wistar
strain. Reports show that saponins possess hypocholesterolemic and antidiabetic
properties. Increased atherogenicity indices TC / HDL-chol and
chol-LDL/chol-HDL was observed in rats of untreated group receiving the
atherogenic diet (positive control), which corroborates Dhandapani
(2007) which showed that consumption of high fat diet increased the
atherogenic index. The administration of the extract FOHF resulted in a
significant decrease (p <0.05) of these index with increase in the
protection against the development of atherosclerosis. Hyperlipidemia is
attributable to excess mobilization of fat from the adipose tissue due to the
under utilization of glucose (Mohana et al., 2010).
Regarding the mechanism of action saponins found in F ovata may
enhance the activity of enzymes involved in bile acid synthesis and its
excretion by precipitating cholesterol from micelles and interfere with
enterohepatic circulation of bile acids making it unavailable for intestinal
absorption (Santosh et al., 2009). Moreover, a
significant decline in plasma LDL-cholesterol in treated groups could be
correlated with saponin content of F. ovata, saponins may enhance the
hepatic LDL-receptor levels, increase hepatic uptake of LDL-cholesterol and aid
its catabolism to bile acids. Also saponins may lower TG by inhibiting
pancreatic lipase activity (Santosh et al., 2009).
Furthermore, the decline in VLDL cholesterol levels in treated groups could be
directly correlated to a decline in TG levels of these groups, as it is well
established that VLDL particles are the main transporters of TG in plasma
(Santosh et al., 2009). Thus, a simultaneous decline
in both TG and VLDL-cholesterol in treated groups indicates the possible effect
of saponins (Mohana et al., 2010).
The concentrations of total protein, creatinine and activity
of the transaminases ASAT and ALAT, reflect the degree of renal and hepatic
damage generated upon exposure to risk factors of cardiovascular disease
(Wasan et al., 2001) and can lead to various
complications. In this study, there was no significant difference (p
<0.05) in the markers of hepatic toxicity (ASAT and ALAT activities) as
compared to the positive control after the sub acute experiment. There was a
significant decrease (p=0.05) in the markers of renal toxicity (total protein
and creatinine levels) as compared to the positive control. These could be
attributed to polyphenols in the extracts of F. ovata that may act in
the regeneration of reduced glutathione as a proton donor to counteract the
action of free radicals.
The low concentration of nitric oxide in the positive control
as compared to the test groups at the level of the plasma could be due to
increased concentration of reactive oxygen species which lead to endothelia
dysfunction especially by inhibiting the synthesis and action of nitric oxide.
This correlates with the work done by Hadi et al.
(2007). The concentration of Nitric oxide was high in the extract FOHT
than in the extract FOHF.
CONCLUSION
In conclusion, the results from this study whose objective was
to evaluate the antihyperglycemic, hypoglycemic, antihyperlipidemic and in
vitro anti á-amylase properties of twigs and fruits extracts of
Ficus ovata showed that, firstly
hydroethanolic fruits and twigs were the most active extracts due to their high
antioxidant and antiamylase activities. Moreover, the acute toxicity study
showed that FOHT and FOHF were weakly toxic since no death was recorded at the
experimental dosage of 5000mg/kg BW. In addition, acute hypoglycemic and
antihyperglycemic studies revealed that hydroethanolic twigs extract was most
active compared to the fruits extracts. Finally the sub acute preventive study
showed that the hydroethanolic fruit extract was most active in ameliorating
the rise in blood lipids and glucose levels induced by the high fructose high
cholesterol diet.
These results suggest that
hydroethanolic extracts of Ficus ovata twigs and fruits could be of
interest in the prevention of hyperlipidemia and hyperglycemia associated to
type 2 diabetes
PESPECTIVES
To pursue these studies on F. ovata, we are proposing
the following:
· Repeat this preventive study for a long period of about
3 months;
· determination of precise active substance(s), site(s)
and mechanism(s) of its pharmacological effect;
· Evaluation of antidiabetic activity on streptozotocin
induced diabetic models;
· Evaluation of the sub acute, Chronic and theragenic
toxicity of our plant.
REFERENCES
Abu H. Z., Moni R. S., Shammy S., Laizuman N.
K. H., and S. R., 2011. Hypoglycemic and in vitro antioxidant activity of
ethanolic extracts of Ficus racemosa Linn. fruits. Am.
J. Sci. Ind. Res., 2(3): 391-400.
Acharya D., and Shrivastava K., 2008.
Indigenous Herbal Medicines: Activity of Opuntia Ficus indica
(L.) Mill. (Cactaceae): ultrastructural study.J of Ethnopharmacol: 76,
1-9. p 440
ADA 2009. Diagnosis and Classification of
Diabetes Mellitus. Diabetes Care 32: S62-S67.
Al-Fatimi M., Wurster M., Schröder G.,
and Lindequist U., 2007. Antioxidant, antimicrobial
and cytotoxicity of selected medicinal plants from Yemen.
J of Ethnopharmacol 111, 657-666.
Angela C., Rutledge and Khosrow A., 2007.
Fructose and the Metabolic Syndrome: Pathophysiology and Molecular Mechanisms.
Nutr Rev, Vol. 65, No. 6. (II): S13-S23.
Assi, A. L. 1990 Utilisation des diverses
espèces de Ficus (Moraceae) dans la pharmacopée
traditionnelle africaine de Cote D'ivoire » Mitt.inst. All.
Bot.Hamburg. 23b, pp1039-1046
Baby J. and Jini D., 2011. Insight into the
hypoglycaemic of traditional India herbs use in the treatment of Diabetes;
Res. J. med. Plant, 5(4):352-376.
Bailey C. J., Day C., 1989. Traditional plant
medicine as treatments for diabetes. Diabetes Care 12: 553-564.
Bastaki S., 2005. Diabetes mellitus and its
treatment. Int. J. Diabet & Metabol 13: 111-134
Berhaut J. « Flore illustré du
Sénégal Dicotylédons ; Tome IV, Linacées
à Nympheacées», Gouvernement du
Sénégal ; Ministère du développement rural et
de l'hydraulique. Direction des eaux et des forets ; Dakar
1979 ; pp422-482.
Bnouham, M., Ziyyat A.,
Mekhfi H., Tahri A., and Legssyer A., 2006. Medicinal plants with potential
antidiabetic activity-A review of ten years of herbal medicine research (1990 -
2000), Int J Diabetes & Metabol 14:1-25.
Bruneton J., 1999. Pharmacognosy,
Phytochemistry and Medicinal Plants. Intercept. Ltd. England, U.K.
Canadian Diabetes Association (CDA), 2006.
Clinical Practice Guidelines Expert Committee; Dyslipidemia in Adults with
Diabetes. Canadian J. of Diabetes; 30(3):230-240.
Chang S. Wu C. C. Z., 1998. Moroidea. In
Chang siushih Wu Chengyih, eds., F1. Reipublo Popularis Sin 23 (1): 12-19.
Changwei A., Anping L., Abdelnaser A.,
Elzaawely T.D., Xuan S.T., 2008. Evaluation of antioxidant and antibacterial
activities of Ficus microcarpa L. fil. Food Control:19, 940-94.
Cheng, A. Y. Y., and Fantus, I. G., 2005.
Oral antihyperglycemic therapy for type 2 diabetes mellitus. Canadian Med
Association J, 172: 213-226
Claudia E. N. M., Ngwa A. F., Gilles I. D.
F., Julius E. O., 2008. Invitro antioxidant activities and pancreatic
á-amylase inhibition of some Cameroonian Medicinal Plants. Int J of
Biomedl and pharmaceu sci, 2(2), 94-97.
Cooke D.W., and Plotnick., 2008. "Type 1
diabetes mellitus in pediatrics". Pediatr Rev 29 (11): 374-84.
Craig M. E., Hattersley A., Donaghue K. C.,
2009. Definition, epidemiology and classification of diabetes in children and
adolescents. Pediatr Diabetes: 10 (Suppl. 12): 3-12.
Cromwell W. C., Otvos J. D., 2006.
Heterogeneity of low-density lipoprotein particle number in patients with type
2 diabetes mellitus and low-density lipoprotein cholesterol,100 mg/dl. Am J
Cardiol; 98:1599-1602.
Czerwinski J., Barlnikowsko E., Leotowicz H.,
Lange E., Leontowicz M., Kotmch E., Trakhtenberg S. and Gorimstein S., 2004.
Dat (Avena sotiva L) and amaranth (Amaranthus hypochondriacus). Meals
positively affect plasma lipid profile in rats fed cholesterol containing
diets. J. Nutr. Biochem., 15, 622-629.
Dhanpani R, 2007. Hypolipidemic activity of
Eclipta prostrate (L.) leaf extract in atherogenic diet induced hyperlipidemic
rats. Indian J. Exp. Biol 45: 617-619.
Dunger D. B., Sperling M. A., Acerini C. L.,
Bohn D. J., Daneman. D., Danne. TP., Glaser N. S., Hanas R., Hintz R. L.,
Levitsky L. L., Savage M. O., Tasker R. C., Wolfsdorf J. I., 2004. European
Society for Paediatric Endocrinology/Lawson Wilkins Pediatric Endocrine Society
consensus statement on diabetic ketoacidosis in children and adolescents.
Pediatrics: 113: e133-e140.
Eidi M., and Esmaeili E., 2006. Antidiabetic
effect of garlic (Allium sativum L.) in normal and
streptozotocin-induced diabetic rats, Phytomedicine: Intern J of Phytothera
and Phytopharmacol 13 624-629.
Eldor R., and Raz I., 2009. The
individualized target HbA1c: a new method for improving macrovascular risk and
glycemia without hypoglycemia and weight gain. Rev Diabet Stud;
6:6-12.
Ellen T. C., James H. N., Show-Hong D., and
Glen H., 2003. Technology and therapeutics, Performance evaluation of
blood. Guidelines Diabetes care, Vol. 26 Supplement 1.
P.222
Eloff J. N., 1998. Which extractant should be
used for screening and isolation of antimicrobial components from plants? J
of Ethnopharmacol 60:1-8
Faiyaz A., and Asna U., 2008.
Antihyperglycemic activity of Ficus glomerata sterm bark in
streptozotozin induced diabetic rats. Global J of pharmacol 2(3):
41-45.
Fossati P et al. Clin. Chem 1982; 28(10):
2077-2080 (chemical reference)
Friedwald W.T., Levy R.I. and Fredrickson
D.S., 1972. Estimation of concentration of low density lipoprotein cholesterol
in plasma without use of Ultracentrifuge. Clin. Chem.18: 449-502.
Fröde T. S., and Medeiros Y. S., 2008.
Animal models to test drugs with potential antidiabetic activity.
J of
Ethnopharmacol
115:
(2) 173-183
George A. B., 2007. How bad is fructose?
Am J Clin Nutr 2007; 86:895- 6.
Ghosh R., Sharatchandra K., Rita S., Thokchom
I. S. 2004. Hypoglycemic activity of Ficus hispida (bark) in normal and
diabetic albino rats: Ind J Pharmacol Vol 36, Issue 4, 222-225
Ghufran S. B. A., Hanaa Z., Michael E. W.,
Emon. D., Ramond G. H., Marwan D., Ramin A. H., 2011. Impaired Endothelial
Function in Preadolescent Children With
Type 1 Diabetes. Diabetes Care, volume34,
march2011.
Grover J. K., Yadav S., and Vats V., 2002.
Medicinal plants of India with antidiabetic potential. J. Ethnopharmacology
81:81-10.
Grundy S. M., 2006. Diabetes and coronary
risk equivalency. What does it mean? Diabetes Care; 29:457-460.
Hanelt P., Kilian, R. and Kilian W., 2001.
Mansfeld's Encyclopedia of Agricultural and Horticultural Crops (except
ornementals).
http://books.google.fr/books?id=10IMFSavIMsC
Hadi A. H., and Jassim A. S., 2007.
Endothelia dysfunction of diabetes mellitus. Vascular Health and Risk
Management: 3(6) 853-876.
Haffner S. M. 2003. Pre-diabetes, insulin
resistance, in?ammation and CVD risk. Diabetes Res Clinic Pract,
61(Suppl 1):S9-18.
Hannan J. M. A., Ali L., Rokeya B., Khaleque
J., Akhter M., Flatt P. R., and Addel-Wahab Y.H.A. 2007. Soluble dietary fibre
fraction of Trigonella foenum-gracecum (fenugreek) seed improves
glucose homeostasis in animal models of type 1 and type 2 diabetes by delaying
carbohydrate digestion and absorption and enhancing insulin action.Brit J
of Nut 97:514-521.
Harbone J. B., 1976. Phytochemical methods: a
guide to modern techniques of plants analysis, Eds chapman and Hall, Londres p
279.
Harris R., Donahue K., Rathore S. S., Frame
P., Woolf S. H., Lohr KN., 2003. Screening adults for type 2 diabetes: a review
of the evidence for the U.S. Preventive Services Task Force. Ann Intern Med:
138: 215-229.
Heather B., Lisa F., and Khosrow A., 2005.
Fructose, insulin resistance, and metabolic dyslipidemia; Nutr&
Metabo, 2:5 doi:10.1186/1743-7075-2-5.
Henry RJ et al., 1974. Clinical Chemistry
Principles and techniques Harper and Row 2nd Edition.
Hoerger T. J., Harris R., Hicks K. A.,
Donahue K., Sorensen S. and Engelgau M. 2004. Screening for type 2 diabetes
mellitus: a cost-effectiveness analysis. Ann Intern Med: 140:
689-699.
Human M. E. E., et Weerdenburg J.
D.,1985. « Flore du Cameroun» No , MERES Yaounde.
Idowu A. T., Olumide A. A., Amdalat F. S.,
Rukiat I. L., Peter G. C. O., 2010. Glycaemic Activity of Ficus exasperata in
Fructose-Induced Glucose Intolerance in Rats; Researcher.2010;
2(1):80-83]
Ivorra, M. D., Paya M., and Villar A., 1989.
A review of natural products and plants as potential antidiabetic drugs, J
of Ethnopharmacol 27: 243-275.
Jatin P., Nur A. M., Abishe K., and Lindsay
B., 2011. A Regenerative antioxidant Protocol of vitamin E and á-lipoic
acid ameliorates cardiovascular and metabolic changes in fructose-fed rats.
Evidence-Based Complementary and Alternative Med, Article ID 120801, 8
pages
Jie Z., Jiguo H., Baoping J. Y. L., and
Xiaofeng Z., 2007. Antihyperglycemic activity of Prunella vulgaris L. in
streptozotocin-induced diabetic mice. Asia Pac J Clin Nutr; 16 (Suppl
1):427-431.
Jones, W. P., and Kinghorn, A. D., 2005. Natural
product isolation: Extraction of Plant Secondary Metabolites.
Methods in Biotech 20:323-351.
Jung M., Park M., Lee H. C., Kang Y. H., Kang
E. S., and Kim S. K., 2006. Antidiabetic agents from medicinal plants. Curr
Med Chem. 13:1203-1218.
Karato M., Yamaguchi K., Takei S., Kino T.,
and Yazawa K., 2006. Inhibitory Effects of Pasuchaca (Geranium
dielsiaum) Extract on á-Glucosidase in Mouse. Biosci.
Biotechnol. Biochem. 70: 1482-1484.
Karato M., Yamaguchi K., Takei S., Kino T.,
and Yazawa K., 2006. Inhibitory Effects of Pasuchaca (Geranium
dielsiaum) Extract on á-Glucosidase in Mouse. Biosci.
Biotechnol. Biochem. 70: 1482-1484
Katalinié V., Milos M., Modun D., Musi
I. et Boban M., 2003. Antioxidant effectiveness of selected wines in comparison
with (+) - catechin. Food Chemis. 86. 593 - 600.
Kimber L S. and Peter J H. 2008. Endocrine
and metabolic effects of consuming beverages sweetened with fructose, glucose,
sucrose, or high-fructose corn syrup1-5. Am J Clin Nutr 2008;
88(suppl):1733S-7S.
Kiran Y. K., Mir A. K., Mushtaq A., Paras M.,
Imran H., Barkat A., Hina F., and Ibtesaam Z. K., 2011. Ethno-medicinal Species
of genus Ficus L. Used to Treat Diabetes in Pakistan. J of Applied
Pharmaceu Sci 01 (06); 209-211.
Komaki E., Yamaguchi S., Maru I., Kinoshita
M., Kakehi K., Ohta Y. and Tsukada Y. 2003. Identification of
anti-á-amylase components from olive leaf extracts. Food sci and
tech Res 9: 35-39.
Krishna B., Nammi S., Kota M. K., and Krishna
Rao R. V., 2004. Evaluation of hypoglycaemic and antihyperglycemic effects of
Datura metel Linn seeds in normal and alloxan-induced diabetic rats. J. of
Ethnopharmacol, 9: 95-98.
Kuete v., Nana F., Ngameni B., Mbaveng T.,
Keumedjio F., Ngadjui T., 2009. Antimicrobial activity of the crude extract,
fractions and compounds from stem bark of Ficus ovata (Moraceae). J of
Ethnopharmacol, 124 (3): pp556-561.
Lavoie L'Allier P
2003.L'athérosclérose: quelles sont les nouvelles
stratégies d'intervention? Le clinicien, 113-120.
Lucy B. Adams., Stang J., Story M., 2005.
Guidelines for Adolescent Nutrition Services.
http://www.epi.umn.edu/let/pubs/adol_book.shtm
Manish M., Tiwari., Kurt J., Messer and Mayau
PR., 2006. Inducible nitric oxide synthase and opoptosis in murine proximal
tubule epithelial cells. Toxicology Sci. 91(2): 493-500.
Osinubi O.G., Ajayi A.E., Adesiyun., 2006. Evaluation of the
anti-diabetic effect of aqueous leaf extract of Tapinanthus butungi
II in male sprague-dawley rats. Med J of Islamic world academy of sci
16:1, 41-47.
Mensbruge G., 1966. « Germination
et Plantules des Essences Arborées dela foret dense et humide de la cote
d'Ivoire » Seine, Paris, 101p.
Miller R. G., Costacou T., Orchard T. J.,
2010. Lipoprotein-associated phospholipase A2, C-reactive protein, and coronary
artery disease in individuals with type 1 diabetes and macroalbuminuria.
Diab Vasc Dis Res;7:47-55.
Mohana L. S., Saravana K. A., Srikanth S.,
Tejo K V., Jyothi G., Mounica C. D., Lavanya O., 2010. Anti-Diabetic and
Antihyperlipidemic Activity of Ficus krishnae L. in Alloxan Induced
Diabetic Rats;Vol 1, Issue 1, Jul -Dec, 14-18.
Mukhyaprana M. P., Vidyasagar S., Shashikiran
U., 2004. Clinical Profile of Type 2 Diabetes Mellitus and Body Mass Index- Is
There any Correlation? Calicut Medic J.; 2(4):e3.
Murase T., Nagasawa A., Suzuki J., Hase T.,
et Tokimitsu I., 2002. Beneficial effect of tea catechins on diet induced
obesity: stimulation of lipid catabolism in the liver. Int. J. Obes. Relat.
Metab. Disord., 26, 1459-1464.
Murray 1 R. L., Creatinine.
Kaplan A et al., 1984. Clin Chem the C.V. Mosby Co.
St Louis. Toronto. Pinceton; 1261-1266 and 418.
Murray 2 R. Aspartate amino transferase and
alanine aminitransferase. Kaplan A et al., 1984. Clin Chem
The C.V. Mosby Co. St Louis. Toronto. Pinceton; 1112-116 and
1088-1090.
Naito H.K. 1984 cholesterol. Kaplan A et al.
Clin Chem The C.V. Mosby Co. St Louis. Toronto. Pinceton; 1194-11206 and 437.
Nicole D., Rani R., 2008. Hyperlipidemia in
the Elderly. Clin Geriatr Med 24:471-487.
Odebeyi O. O., and Sofowara E. A., 1978.
Phytochemical screening of Nigerian medicinal plants-part II, Lloydia,
41: 234p.
OECD 2004 . OECD guidelines for testing of
chemicals. Proposal for a new DRAFT GUIDELINE 434: Acute Dermal Toxicity -
Fixed Dose Procedure (1st version) 14 p.
Ortiz-andrade R.R., Garcýa-Jimenez S.,
Castillo-Espana P., Ramýrez-Avila G., Villalobos-Molinad R., Estradasoto
S., 2007. Glucosidase inhibitory activity of the methanolic extract from
Tournefortia hartwegiana: An antihyperglycemic agent. J of
Ethnopharmacol: 109 48-53.
Paul D. D. D., Léonard T., Emmanuel A.
A., Théophile D., Selestin D. S., Pierre K., 2006. Hypoglycaemic and
antidiabetic effect of root extracts of Ceiba pentandra in normal and
diabetic rats. Afr. J. Trad. CAM 3 (1): 129 - 136.
Poongothai A., Sreena K. P., Sreejith K.,
Uthiralingam M., and Annapoorani S., 2011. Preliminary phytochemicals screening
of Ficus racemosa Linn bark. Intern J of Pharma and Bio Sci;
vol 2: issue 2: Apr-Jun.
Raneva V. G., and Shimasaki H.,
2005. Green tea catechins decrease lipid peroxidation in plasma and
organs of C57BL/6J mice fed atherogenic diet. J. Oleo Sci., 54 (12),
641-648.
Rao C.V., Verma A.R., Vijayakumar M., Rastogi
S., 2008. Gastroprotective effect of standardized extract Ficus glomerata fruit
on experimental gastric ulcers in rats. J of Ethnopharmacol 115,
323-326.
Rashidi A. A., and Noureddini M., 2011.
Hypoglycemic Effect of the Aromatic Water of Leaves of Ficus carica in
normal and Streptozotocin Induced Diabetic Rats; Pharmacol online 1:
372-379.
Rasilainen S., Ylipaasto P., Roivainen M.,
Bouwens L., Lapatto R., Hovi T., Otonkoski T., 2004. Mechanisms of beta cell
death during restricted and unrestricted enterovirus infection. J Med Virol:
72: 451-461.
Reaven P. D., Moritz T. E., Schwenke D. C.,
2009. Intensive glucose-lowering therapy reduces cardiovascular disease events
in veteran's affairs diabetes trial participants with lower calcified coronary
atherosclerosis. Diabetes; 58:2642-2648.
Sabatie B., 1985 «Flore du Cameroun
Moraceae. (Inc cecropiaceae)». Ministère de l'enseignement
Supérieur et de la rech sc. (MESRES) Ed Yaoundé-Cameroun,
pp154-158.
Santosh K. M., Kanwal R., and Arvind K S.,
2009. Antidyslipidaemic activity of glycyrrhiza glabra in high fructose diet
induced dsyslipidaemic syrian golden hamsters. Indian J of Clinical
Biochem, 24 (4) 404-409
Shaw J. E., Sicree R. A., Zimmet P. Z., 2010.
Global estimates of the prevalence of diabetesfor 2010 and 2030. Diab Res
and Clinical Practice, 87; 4-14
Singleton V. and Rossi J., 1965. Colorimetry
of total phenolics with phosphomolydic-phosphotungstic acid reagents. Am.
J. Enol. Vitic. 16: 144-158.
Tanira, M.O.M., 1994.
Antidiabetic medicinal plants: A review of the present status and
future directions. Int. J. Diab 2(1):15-22.
Tchinda Isabelle, 2010. Etude phytochimique
et pharmacologique de Ficus ovata vahl. thesis
Thunander M., Petersson C., Jonzon K.,
Fornander J., Ossiansson B., Torn C., Edvardsson S., Landin-olsson M., 2008.
Incidence of type 1 and type 2 diabetes in adults and children in Kronoberg,
Sweden. Diab Res Clin Pract: 82: 247-255. 11.
Tormo M.A., Gil-Exojo I., Romerode A.,
Tejadaand et Campillo J. E. 2004.hypoglycemic and anorexigenic activities of an
á-amylase inhibitor from white kidney beans (Phaseolus vulgaris) in
Wistar rats. British J of Nutr.92:785-790.
Trease G. E. and Evans W.
E., 1978. A text book of pharmacognosy: 12e edition, Baillère Tindall
Ltd., Londres.
Trease G. E., and Evans W. E., 1989. A text
book of pharmacognosy: 13e edition, Baillère Tindall Ltd., Londres.
Vivek K. S., Suresh K., Hitesh J. P., and
Shivakumar H., 2010. Hypoglycemic activity of Ficus glomerata in
alloxan induced diabetic rats. Int. J. of Pharmac Sc Rev and
Res: Vol 1, Issue 2,18-22.
Wall M. E., Eddy C. R., McCClenna M. L., and
Klump M. E., 1954. Detection and estimation of steroids sapogenins VII.
Agr. Res Service Circ. Aic., 363, 17p.
Wasan K. M., Najafi S., Wong J. and Kwong M.,
2001. Assessing plasma lipid levels body weight and hepatic and renal toxicity
following chronic oral administration of water soluble phytostanol compound
FM-VP4, to gerbils. J. Pharm. Sci. 4, 228-234.
WHO Consultation 1999. Definition, diagnosis
and classification of diabetes mellitus and its complications. Part 1:
diagnosis and classification of diabetes mellitus. Report no. 99.2. Geneva:
World Health Organisation.
WHO, 2006. Guidelines for the prevention,
management and care of diabetes mellitus. WHO Regional Office for the Eastern
Mediterranean, (EMRO Technical Publications Series ; 32)
Wineke B., Etto C. E., Pieter S., Victor W.
M., Van H. B., 2009. Endothelial dysfunction and diabetes: roles of
hyperglycemia, impaired insulin signalling and obesity. Cell Tissue
Res, 335:165-189.
Weiss J. and Sumpio B., 2006. Review of
prevalence and outcome of vascular disease in patients with diabetes mellitus,
Eur J Endovasc surg, 31 (2): 143-150.
Young D. S. 2001. Effects
of disease on Clinical Lab. Tests, 44th ed. AACC.
APPENDIX
APPENDIX 1: Composition of
polyvitamin and amino acids in hydrosoluble powder
Vitamin A 20.000.000 UI
Vitamin D3 4.000.000 UI
Vitamin E 10.000 mg
Vitamin B1 2.000 mg
Vitamin B2 2.500 mg
Vitamin B6 2.000 mg
Vitamin B12 5 mg
Vitamin C 10.000 mg
Vitamin K3 2.000 mg
Nicotinic acid 10.000 mg
Folic acid 500 mg
Methionine 20.000 mg
Lysine 30.000 mg
Calcium panthotenate 5.000 mg
APPENDIX 2: Reagents for the
determination of total cholesterol
1 Reagent 1 (buffer)
PIPES pH 6.9 90mmol/L
Phenol 26mmol/L
2 Reagent 2(enzymes)
Cholesterol esterase (CHE) 300U/L
Cholesterol oxidase (CHOD) 300U/L
Peroxidase (POD) 1250U/L
4-Aminophenazone (4-AP) 0.4mmol/L
3 Cholesterol CAL 200mg/dl
PREPARATION
Working reagent (WR): The content of the reagent 2 was
dissolved with the corresponding volume of reagent 1 followed by capping and
mixing gently to dissolve contents. Stability of the WR: 4 months at +2 to
+8°C or 40 days at room temperature.
APPENDIX 3: Reagents for the determination of
Triglycerides
· Reagent 1 (buffer)
GOOD pH 7.5 50mmol/L
p-Chlorophenol 2mmol/L
· Reagent 2(enzymes)
Lipoprotein lipase (LPL) 150000U/L
Glycerol kinase (GK) 300U/L
Glycerol-3-phosphate (GPO) 2500U/L
Peroxidase (POD) 440U/L
4-Aminophenazone (4-AP) 0.1mmol/L
ATP 0.1mmol/L
· Triglycerides CAL 200mg/dl
PREPARATION
Working reagent (WR): The content of the reagent 2 was
dissolved with the corresponding volume of reagent 1 followed by capping and
mixing gently to dissolve contents. Stability of the WR: 6 weeks at +2 to
+8°C or 1 week at room temperature.
APPENDIX 4: Reagents for the determination of HDL cholesterol
Reagent 1 (precipitating reagent)
Phosphotungstic acid 14mmol/L
Magnesium chloride 2mmol/L
The reagent is ready to be used
APPENDIX 5: Reagents for the determination of Total protein
Biuret reagent
NaOH 100mmol/l
Potassium Iodide 16mmol/l
Copper sulphate 6mmol/l
Sodium potassium tartrate 16mmol/l
Blank reagent
Sodium potassium tartrate 16mmol/l
NaOH 100mmol/l
Standard
Protein 60g/l (6.0g/dl)
Reagent handling and preparation
Buiret reagent: add 100mls of distilled water
to one vial of Biuret concentration. Stable for 12 month when sealed and stored
at +15-25°C. Protected from light
Blank reagent: dilute the content of blank
reagent bottle with 200mls of distilled water, rinsing the bottle thoroughly.
Stable for 12 months when sealed and stored at +15-25°C. Standard is ready
for use.
APPENDIX 6: Reagents for the determination of creatinine
1 Reagent 1 (picric reagent)
Picric acid 17.5mmol/L
2 Reagent 2(alkaline reagent)
Sodium hydroxide 0.29mol/L
3 Creatinine CAL 2.0mg/dl
PREPARATION
Working reagent (WR): Equal volume of the
reagent 2 was mixed with the corresponding volume of reagent 1 followed by
capping and mixing. Stability of the WR: 10 days at +15 to +25°C.
APPENDIX 7: Reagents for the determination of AST and ALT
respectively
AST ALT
1 Reagent 1(Buffer/substrate)
TRIS pH 7.8 80mmol/L TRIS pH 7.8 100mmol/L
L-Aspartate 200mmol/L L-Alanine 500mmol/L
2 Reagent 2
(Enzymes/coenzymes/á-Ketoglutarate)
NADH 0.18mmol/L NADH 0.18mmol/L
LDH 800U/L LDH 1200U/L
á-Ketoglutarate 12mmol/L á-ketoglutarate
15mmol/L
MDH 600mmol/L
PREPARATION
Working reagent (WR): The content of Reagent 2 was dissolved
with the corresponding volume of Reagent 1 (buffer substrate) followed by
capping and mixing to dissolve contents. Stability: 21 days at +2 to +8°C
or 3 days at room temperature (+15 to +25°C).
Appendix 8: standard curve of catechine
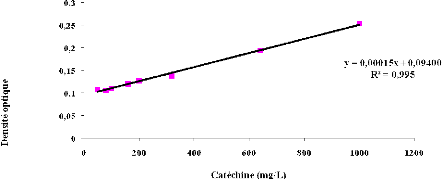
* 1r disease in patients
with diabetes mellitus". Eur J Vasc Endovasc Surg
| 

