APPENDICES
APPENDIX 1: METEOROLOGICAL STATIONS COVERING THE STUDY
AREA (FROM FAO/UNESCO CLIMWAT DATBASE)
ANG: Angola, CAF: Cantral Africa, CMR, Cameroon, PRC: People
Republic of the Congo, URT: United Republic of Tanzania ZAI = Zaire
(D.R.Congo), ZAM: Zambia .
|
COUNTRY
|
STATION NAME
|
LONGITUDE
(degree)
|
LATITUDE
(degree)
|
ELEVATION
(m)
|
|
ZAI.
|
Bafwasende
|
27.28
|
1.05
|
524
|
|
ZAI.
|
Bambesa
|
25.43
|
3.27
|
621
|
|
ZAI.
|
Banana
|
12.35
|
-6
|
2
|
|
ZAI.
|
Bandundu
|
17.21
|
-3.18
|
324
|
|
ZAI.
|
Basankusu
|
19.48
|
1.13
|
353
|
|
ZAI.
|
Basoko
|
23.36
|
1.15
|
366
|
|
ZAI.
|
Bena-Longo
|
21.4
|
-4.51
|
578
|
|
ZAI.
|
Binga
|
20.3
|
2.18
|
400
|
|
ZAI.
|
Boende
|
20.51
|
-0.13
|
351
|
|
ZAI.
|
Boketa
|
19.46
|
3.11
|
475
|
|
ZAI.
|
Bokondji
|
21.26
|
-0.43
|
365
|
|
ZAI.
|
Bongabo
|
20.32
|
3.06
|
450
|
|
ZAI.
|
Bukavu
|
28.52
|
-2.3 1
|
1612
|
|
ZAI.
|
Bumba
|
22.33
|
2.11
|
361
|
|
ZAI.
|
Bunia
|
30.13
|
1.3
|
1239
|
|
ZAI.
|
Buta
|
24.47
|
2.5
|
410
|
|
ZAI.
|
Butembo
|
29.16
|
0.08
|
1840
|
|
ZAI.
|
Eala
|
18.18
|
0.03
|
350
|
|
ZAI.
|
Gandajika
|
23.57
|
-6.45
|
780
|
|
ZAI.
|
Gemena
|
19.47
|
3.17
|
446
|
|
ZAI.
|
Gimbi-Plateau
|
13.22
|
-5.3 1
|
480
|
|
ZAI.
|
Goma
|
29.14
|
-1.41
|
1552
|
|
ZAI.
|
Ilebo
|
20.35
|
-4.2
|
420
|
|
ZAI.
|
Inongo
|
18.16
|
-1.58
|
299
|
|
ZAI.
|
Irumu
|
29.52
|
1.27
|
955
|
|
ZAI.
|
Isiro
|
27.39
|
2.46
|
764
|
|
ZAI.
|
Kalemie
|
29.11
|
-5.53
|
776
|
|
ZAI.
|
Kamina
|
25
|
-8.44
|
1105
|
|
ZAI.
|
Kamina - Base
|
25.15
|
-8.38
|
1106
|
|
ZAI.
|
Kananga
|
22.25
|
-5.53
|
657
|
|
ZAI.
|
Kaniama
|
24.09
|
-7.25
|
949
|
|
ZAI.
|
Kibangula
|
27.04
|
-4.52
|
685
|
|
ZAI.
|
Kikwit
|
18.48
|
-5.02
|
449
|
|
ZAI.
|
Kindu
|
25.55
|
-2.57
|
497
|
|
ZAI.
|
Kinshasa
|
15.22
|
-4.22
|
310
|
|
ZAI.
|
Kisanga-Plateau
|
27.25
|
-11.44
|
1187
|
|
ZAI.
|
Kisangani
|
25.11
|
0.31
|
396
|
|
ZAI.
|
Kiyaka-Plateau
|
18.57
|
-5.16
|
739
|
|
ZAI.
|
Kolwezi
|
25.28
|
-10.45
|
1526
|
|
ZAI.
|
Kondo
|
12.58
|
-5.34
|
230
|
|
ZAI.
|
Kongolo
|
27
|
-5.2 1
|
561
|
|
ZAI.
|
Kutubongo
|
19.53
|
-4.37
|
550
|
|
ZAI.
|
Libenge
|
18.38
|
3.38
|
359
|
|
ZAI.
|
Lisala
|
21.34
|
2.19
|
463
|
|
ZAI.
|
Lodja
|
23.28
|
-3.29
|
479
|
|
ZAI.
|
Loeka
|
22.42
|
2.12
|
380
|
|
ZAI.
|
Lomela
|
23.17
|
-2.18
|
427
|
|
ZAI.
|
Lubao
|
25.45
|
-5.18
|
694
|
|
ZAI.
|
Lubarika
|
28.57
|
-2.5
|
980
|
|
ZAI.
|
Lubumbashi Luano
|
27.29
|
-11.4
|
1298
|
|
ZAI.
|
Luki-Plateau
|
13.06
|
-5.37
|
350
|
|
ZAI.
|
Lukolela
|
17.1
|
-1.04
|
318
|
|
ZAI.
|
Luputa
|
23.44
|
-7.08
|
877
|
|
ZAI.
|
Lusambo
|
23.26
|
-4.58
|
424
|
|
ZAI.
|
M'Vuazi-Poste
|
14.54
|
-5.27
|
505
|
|
ZAI.
|
Magombo
|
27.54
|
3.42
|
705
|
|
ZAI.
|
Manono
|
27.26
|
-7.17
|
633
|
|
ZAI.
|
Mbandaka
|
18.16
|
0.03
|
317
|
|
ZAI.
|
Mbuji-Mayi
|
23.37
|
-6.1
|
677
|
|
ZAI.
|
Mitwaba
|
27.2
|
-8.56
|
1579
|
|
ZAI.
|
Mont Delele
|
29.47
|
4.22
|
900
|
|
ZAI.
|
Mont Hawa
|
30.45
|
2.49
|
1350
|
|
ZAI.
|
Mukumari
|
23.11
|
-2.5
|
535
|
|
ZAI.
|
Mulungu Bukulumisa
|
28.43
|
-2.2
|
2378
|
|
ZAI.
|
Mutombo - Yamfu
|
16.22
|
-5.19
|
700
|
|
ZAI.
|
Mutsora
|
29.44
|
0.19
|
1330
|
|
ZAI.
|
N'Dihira
|
29.1
|
-0.16
|
2190
|
|
ZAI.
|
Nioka-Drusi
|
30.39
|
2.09
|
1678
|
|
ZAI.
|
Opala
|
24.21
|
-0.35
|
398
|
|
ZAI.
|
Rumangabo
|
29.22
|
-1.21
|
1620
|
|
ZAI.
|
Rwindi
|
29.17
|
-0.47
|
1040
|
|
ZAI.
|
Simama
|
27.01
|
-9.37
|
852
|
|
ZAI.
|
Tshikapa
|
20.5 1
|
-6.25
|
481
|
|
ZAI.
|
Tukpwo
|
25.55
|
4.27
|
704
|
|
ZAI.
|
Watsa
|
29.3
|
3.04
|
1008
|
|
ZAI.
|
Yaligimba
|
22.51
|
2.17
|
435
|
|
ZAI.
|
Yangambi E.C.P.
|
24.31
|
0.53
|
491
|
|
ZAI.
|
Yangambi Km 5
|
24.29
|
0.49
|
470
|
|
ZAM.
|
Chipata
|
32.35
|
-13.33
|
1032
|
|
ZAM.
|
Kabompo
|
24.12
|
-13.36
|
1075
|
|
ZAM.
|
Kabwe
|
28.28
|
-14.27
|
1207
|
|
ZAM.
|
Kaoma
|
24.48
|
-14.48
|
1213
|
|
ZAM.
|
Kasama
|
31.08
|
-10.13
|
1384
|
|
ZAM.
|
Kasempa
|
25.51
|
-13.32
|
1234
|
|
ZAM.
|
Kawambwa
|
29.05
|
-9.48
|
1324
|
|
ZAM.
|
Lundazi
|
33.12
|
-12.17
|
1143
|
|
ZAM.
|
Mansa
|
28.51
|
-11.06
|
1259
|
|
ZAM.
|
Mbala
|
31.2
|
-8.51
|
1673
|
|
ZAM.
|
Mpika
|
31.36
|
-11.54
|
1402
|
|
ZAM.
|
Mwinilunga
|
24.26
|
-11.45
|
1363
|
|
ZAM.
|
Ndola
|
28.39
|
-13
|
1270
|
|
ZAM.
|
Petauke
|
31.17
|
-14.15
|
1036
|
|
ZAM.
|
Samfya
|
29.32
|
-11.21
|
1172
|
|
ZAM.
|
Serentje
|
30.13
|
-13.14
|
1384
|
|
ZAM.
|
Solwezi
|
26.23
|
-12.11
|
1386
|
|
ZAM.
|
Zambezi
|
23.07
|
-13.32
|
1078
|
|
ANG.
|
Cabinda
|
12.11
|
-5.33
|
20
|
|
ANG.
|
Chitembo
|
16.46
|
-13.32
|
1500
|
|
ANG.
|
Cuemba
|
18.05
|
-12.08
|
1300
|
|
ANG.
|
Huambo
|
15.45
|
-12.48
|
1700
|
|
ANG.
|
Lobito
|
13.32
|
-12.22
|
3
|
|
ANG.
|
Luanda
|
13.14
|
-8.51
|
70
|
|
ANG.
|
Luau
|
22.15
|
-10.43
|
1100
|
|
ANG.
|
Lubango
|
13.34
|
-14.56
|
1758
|
|
ANG.
|
Luena
|
19.55
|
-11.47
|
1357
|
|
ANG.
|
Malanje
|
16.22
|
-9.33
|
1142
|
|
ANG.
|
Menongue
|
17.41
|
-14.39
|
1343
|
|
ANG.
|
Ndalatando
|
14.57
|
-9.19
|
690
|
|
ANG.
|
Nova Gaia
|
17.33
|
-10.04
|
1260
|
|
ANG.
|
Saurimo
|
20.24
|
-9.39
|
1080
|
|
ANG.
|
Soyo
|
12.21
|
-6.07
|
1
|
|
ANG.
|
Sunginge
|
16.47
|
-8.46
|
630
|
|
PRC.
|
Brazzaville
|
15.15
|
-4.15
|
316
|
|
PRC.
|
Djambala
|
14.46
|
-2.32
|
790
|
|
PRC.
|
Impfondo
|
18.04
|
1.37
|
326
|
|
PRC.
|
Loubomo
|
12.42
|
-4.12
|
330
|
|
PRC.
|
M'Pouya
|
16.13
|
-2.37
|
312
|
|
PRC.
|
Makoua
|
15.35
|
0.01
|
379
|
|
PRC.
|
Mouyondzi
|
13.55
|
-3.59
|
512
|
|
PRC.
|
Ouesso
|
16.03
|
1.37
|
352
|
|
PRC.
|
Pointe Noire
|
11.54
|
-4.49
|
17
|
|
URT.
|
Biharamulo
|
31.19
|
-2.38
|
1480
|
|
URT.
|
Bukoba
|
31.49
|
-1.2
|
1137
|
|
URT.
|
Chunya
|
33.26
|
-8.32
|
1500
|
|
URT.
|
Igawa
|
34.23
|
-8.46
|
1070
|
|
URT.
|
Igeri
|
34.4
|
-9.4
|
2250
|
|
URT.
|
Kigoma
|
29.38
|
-4.53
|
885
|
|
URT.
|
Mbeya Airfield
|
33.28
|
-8.56
|
1707
|
|
URT.
|
Musoma
|
33.48
|
-1.3
|
1147
|
|
URT.
|
Muze
|
3 1.33
|
-7.4
|
810
|
|
URT.
|
Mwanza Airfield
|
32.55
|
-2.28
|
1140
|
|
URT.
|
Njombe
|
34.45
|
-9.25
|
1890
|
|
URT.
|
Sumbawanga
|
31.36
|
-7.57
|
1710
|
|
URT.
|
Tabora Airport
|
32.5
|
-5.05
|
1190
|
|
URT.
|
Tabora Observatory
|
32.49
|
-5.02
|
1265
|
|
URT.
|
Urambo
|
32.03
|
-5.04
|
1106
|
|
CAF.
|
Bambari
|
20.39
|
5.51
|
475
|
|
CAF.
|
Bangassou
|
22.5
|
4.44
|
500
|
|
CAF.
|
Bangui
|
18.3 1
|
4.24
|
366
|
|
CAF.
|
Berberati
|
15.48
|
4.15
|
583
|
|
CAF.
|
Bossangoa
|
17.26
|
6.29
|
465
|
|
CAF.
|
Bouar
|
15.38
|
5.58
|
1020
|
|
CAF.
|
Bria
|
21.59
|
6.32
|
584
|
|
CAF.
|
N'Dele
|
20.39
|
8.24
|
510
|
|
CMR.
|
Batouri
|
14.22
|
4.28
|
656
|
|
CMR.
|
Garoua
|
13.23
|
9.2
|
244
|
|
CMR.
|
Koundja
|
10.45
|
5.39
|
1210
|
|
CMR.
|
Lomie
|
13.37
|
3.09
|
624
|
|
CMR.
|
Ngaoundere
|
13.34
|
7.21
|
1104
|
|
CMR.
|
Yaounde
|
11.31
|
3.5
|
760
|
APPENDIX 2: SPREADSHEET MODEL FOR THE PENMAN-MONTEITH
CALCULATION METHOD OF ETo (After Allen et al, 1998)
|
PENMAN-MONTEITH CALCULATIONS
|
|
Grass
|
Alfalfa
|
|
Give :
|
Station name :
|
|
Gamma* Cff
|
Gamma*Cff
|
|
Latitude :
|
|
Lonitude
|
0.34
|
0.42
|
|
Altitude :
|
|
|
|
|
Parameters :
|
Short Wave Rad
|
|
a =
|
0.25
|
b = 0.50
|
alpha=
|
|
Albedo
|
|
|
alpha =
|
0.23
|
|
|
|
|
Long Wave Rad.
|
|
a =
|
0.90
|
b = 0.10
|
|
|
al =
|
0.34
|
bl = -0.139
|
|
|
|
Instrument height
|
|
|
wind
|
temp
|
Cropheight
|
AeroT Cff
|
|
|
AerDyn Resistance
|
ra * U =
|
206
|
200
|
190
|
12
|
900
|
|
|
|
Grass
|
Alfalfa
|
|
|
|
|
Canopy resistance
|
rc =
|
70
|
86
|
|
12
|
|
|
|
JAN
|
FEB
|
MAR
|
APR
|
MAY
|
JUN
|
JUL
|
AUG
|
SEP
|
OCT
|
NOV
|
DEC
|
YEAR
|
|
Tmax
|
12.3
|
13.6
|
15.6
|
19.8
|
23.0
|
28.0
|
31.0
|
31.2
|
28.1
|
22.7
|
17.1
|
4.8
|
|
|
Tmin
|
3.7
|
4.0
|
5.6
|
7.6
|
12.6
|
15.4
|
18.0
|
18.0
|
15.6
|
11.6
|
7.7
|
82
|
|
|
RHmean
|
81
|
77
|
72
|
74
|
69
|
65
|
59
|
61
|
70
|
77
|
81
|
58
|
|
|
RHmin
|
58
|
53
|
49
|
46
|
47
|
41
|
37
|
38
|
45
|
51
|
57
|
190
|
|
|
Wind (km/d)
|
190
|
190
|
190
|
156
|
156
|
156
|
156
|
121
|
121
|
121
|
190
|
3.50
|
|
|
Sunhours
|
4.20
|
4.30
|
5.80
|
7.00
|
8.40
|
9.00
|
10.60
|
9.70
|
8.00
|
6.00
|
4.00
|
1.47
|
|
|
ET fao
|
1.47
|
1.87
|
2.57
|
3.26
|
4.08
|
4.94
|
5.77
|
5.21
|
4.10
|
2.76
|
1.91
|
9.20
|
|
|
Avg Temp
|
8.00
|
8.80
|
10.60
|
13.70
|
17.80
|
21.70
|
24.50
|
24.60
|
21.85
|
17.15
|
12.40
|
34%
|
|
|
n/N
|
40%
|
39%
|
49%
|
55%
|
63%
|
65%
|
78%
|
75%
|
66%
|
53%
|
38%
|
2.20
|
|
|
Wind (m/s)
|
2.20
|
2.20
|
2.20
|
1.81
|
1.81
|
1.81
|
1.81
|
1.40
|
1.40
|
1.40
|
2.20
|
1.56
|
|
|
Ea(Tmax)
|
1.43
|
1.56
|
1.77
|
2.31
|
2.81
|
3.78
|
4.49
|
4.54
|
3.80
|
2.76
|
1.95
|
0.86
|
|
|
Ea(Tmin)
|
0.80
|
0.81
|
0.91
|
1.04
|
1.46
|
1.75
|
2.06
|
2.06
|
1.77
|
1.37
|
1.05
|
1.21
|
|
|
Ea(Tx)-Ea(Tn)
|
1.11
|
1.19
|
1.34
|
1.68
|
2.13
|
2.76
|
3.28
|
3.30
|
2.79
|
2.06
|
1.50
|
0.91
|
|
|
Edew
|
0.83
|
0.82
|
0.87
|
1.06
|
1.33
|
1.55
|
1.67
|
1.73
|
1.69
|
1.41
|
1.11
|
82%
|
|
|
RH(max-min)
|
81%
|
77%
|
72%
|
74%
|
69%
|
65%
|
59%
|
61%
|
70%
|
77%
|
81%
|
0.08
|
|
|
Dlt(ETx-ETn)
|
0.08
|
0.08
|
0.09
|
0.11
|
0.13
|
0.17
|
0.19
|
0.19
|
0.17
|
0.13
|
0.10
|
101.3
|
|
|
P-atm.
|
101.3
|
101.3
|
101.3
|
101.3
|
101.3
|
101.3
|
101.3
|
101.3
|
101.3
|
101.3
|
101.3
|
2.48
|
|
|
lambda
|
2.48
|
2.48
|
2.48
|
2.47
|
2.46
|
2.45
|
2.44
|
2.44
|
2.45
|
2.46
|
2.47
|
0.07
|
|
|
gamma
|
0.07
|
0.07
|
0.07
|
0.07
|
0.07
|
0.07
|
0.07
|
0.07
|
0.07
|
0.07
|
0.07
|
70
|
|
|
rc
|
70
|
70
|
70
|
70
|
70
|
70
|
70
|
70
|
70
|
70
|
70
|
94
|
|
|
ra
|
94
|
94
|
94
|
114
|
114
|
114
|
114
|
147
|
147
|
147
|
94
|
0.12
|
|
|
gamma*
|
0.12
|
0.12
|
0.12
|
0.11
|
0.11
|
0.11
|
0.11
|
0.10
|
0.10
|
0.10
|
0.12
|
0.41
|
|
|
dl/dl+gm*
|
0.39
|
0.41
|
0.43
|
0.50
|
0.55
|
0.61
|
0.64
|
0.66
|
0.63
|
0.57
|
0.46
|
0.34
|
|
|
gm/dl+gm*
|
0.35
|
0.34
|
0.33
|
0.31
|
0.28
|
0.25
|
0.22
|
0.23
|
0.25
|
0.29
|
0.31
|
0.71
|
|
|
Aeroterm
|
0.70
|
0.87
|
1.08
|
1.08
|
1.26
|
1.64
|
1.97
|
1.53
|
1.18
|
0.84
|
0.85
|
12
|
|
|
Month
|
1
|
2
|
3
|
4
|
5
|
6
|
7
|
8
|
9
|
10
|
11
|
351
|
|
|
dayno
|
15
|
46
|
76
|
107
|
137
|
168
|
198
|
229
|
259
|
290
|
320
|
-0.408
|
|
|
soldeclin
|
-0.370
|
-0.230
|
-0.033
|
0.179
|
0.334
|
0.408
|
0.372
|
0.233
|
0.036
|
-0.176
|
-0.336
|
-0.186
|
|
|
xx
|
-0.170
|
-0.107
|
-0.016
|
0.083
|
0.154
|
0.186
|
0.170
|
0.108
|
0.017
|
-0.082
|
-0.155
|
0.810
|
|
|
yy
|
0.823
|
0.860
|
0.882
|
0.869
|
0.834
|
0.811
|
0.823
|
0.859
|
0.882
|
0.869
|
0.834
|
1.34
|
|
|
omega
|
1.36
|
1.45
|
1.55
|
1.67
|
1.76
|
1.80
|
1.78
|
1.70
|
1.59
|
1.48
|
1.38
|
1.03
|
|
|
dr
|
1.03
|
1.02
|
1.01
|
0.99
|
0.98
|
0.97
|
0.97
|
0.98
|
0.99
|
1.01
|
1.02
|
20.92
|
|
|
Ra
|
22.25
|
26.84
|
32.52
|
37.40
|
40.01
|
40.91
|
40.33
|
38.04
|
33.89
|
28.21
|
23.28
|
10.23
|
|
|
N
|
10.41
|
11.04
|
11.86
|
12.73
|
13.42
|
13.77
|
13.59
|
12.96
|
12.15
|
11.27
|
10.57
|
6.8
|
|
|
Rns
|
7.7
|
9.2
|
12.4
|
15.1
|
17.3
|
18.2
|
19.9
|
18.3
|
15.1
|
11.2
|
7.9
|
0.41
|
|
4.oe
2.oe
7.00
6.00
5.oe
3.oe
0.00
1.oe
JAN FEB MAR APR MAY JUN JUL AUG SEP OCT NOV DEC
FAO Penman-Monteith - ETo
Rei. Evapotranspiration Rome
ETo (-G) ETo
|
f(n/N)
|
0.46
|
0.45
|
0.54
|
0.59
|
0.66
|
0.69
|
0.80
|
0.77
|
0.69
|
0.58
|
0.44
|
31.19
|
|
|
sigma(TxTn)
|
30.66
|
31.02
|
31.83
|
33.27
|
35.19
|
37.14
|
38.58
|
38.63
|
37.21
|
34.88
|
32.64
|
0.21
|
|
|
emissivity
|
0.21
|
0.21
|
0.21
|
0.20
|
0.18
|
0.17
|
0.16
|
0.16
|
0.16
|
0.18
|
0.19
|
6.46
|
|
|
Rbo
|
6.53
|
6.62
|
6.69
|
6.53
|
6.32
|
6.18
|
6.18
|
6.06
|
5.91
|
6.10
|
6.31
|
2.64
|
|
|
LWR
|
3.03
|
2.99
|
3.62
|
3.89
|
4.20
|
4.26
|
4.96
|
4.69
|
4.10
|
3.54
|
2.79
|
4.14
|
|
|
Rn (Rns-Rl)
|
4.71
|
6.20
|
8.76
|
11.23
|
13.14
|
13.91
|
14.91
|
13.59
|
11.01
|
7.67
|
5.09
|
-0.45
|
|
|
G
|
-0.17
|
0.11
|
0.25
|
0.43
|
0.57
|
0.55
|
0.39
|
0.01
|
-0.39
|
-0.66
|
-0.67
|
4.59
|
|
|
Rn-G
|
4.88
|
6.09
|
8.51
|
10.79
|
12.57
|
13.36
|
14.51
|
13.57
|
11.40
|
8.33
|
5.75
|
0.69
|
|
|
Rad Term
|
0.75
|
1.02
|
1.53
|
2.27
|
2.95
|
3.44
|
3.90
|
3.68
|
2.82
|
1.77
|
0.94
|
0.76
|
|
|
Rad Term(-G)
|
0.77
|
1.00
|
1.49
|
2.18
|
2.82
|
3.30
|
3.80
|
3.67
|
2.92
|
1.92
|
1.06
|
1.40
|
|
|
ETcomb
|
1.44
|
1.88
|
2.61
|
3.35
|
4.21
|
5.07
|
5.87
|
5.21
|
4.01
|
2.60
|
1.79
|
-5.3%
|
|
|
-1.8%
|
1.0%
|
1.7%
|
2.6%
|
3.1%
|
2.7%
|
1.7%
|
0.1%
|
-2.5%
|
-5.8%
|
-6.9%
|
1.47
|
|
|
ET (-G)
|
1.47
|
1.87
|
2.57
|
3.26
|
4.08
|
4.94
|
5.77
|
5.21
|
4.10
|
2.76
|
1.91
|
13.6
|
|
APPENDIX 3: CONGO RIVER DISCHARGE DATA AT
KINSHASA
Station: Kinshasa
Latitude: 4.3o S/ Longitude: 15.3o E River:
Zaire
Country: Zaire
Elevation: m
Area: 3475000 km2
|
-
|
Jan
|
Feb
|
Mar
|
Apr
|
May
|
Jun
|
Jul
|
Aug
|
Sep
|
Oct
|
Nov
|
Dec
|
Ann
|
|
m 3 /c
|
47494
|
37649
|
34713
|
37172
|
39150
|
36717
|
31703
|
31087
|
36366
|
43172
|
51708
|
56082
|
40251
|
|
mm
|
36.6
|
26.4
|
26.8
|
27.7
|
30.2
|
27.4
|
24.4
|
24
|
27.1
|
33.3
|
38.6
|
43.2
|
366
|
|
km 3
|
127
|
91.9
|
93
|
96.3
|
105
|
95.2
|
84.9
|
83.3
|
94.3
|
116
|
134
|
150
|
1270
|
|
l/s/km 2
|
13.7
|
10.8
|
9.99
|
10.7
|
11.3
|
10.6
|
9.12
|
8.95
|
10.5
|
12.4
|
14.9
|
16.1
|
11.6
|
|
%%
|
9.83
|
7.79
|
7.19
|
7.7
|
8.11
|
7.6
|
6.56
|
6.44
|
7.53
|
8.94
|
10.7
|
11.6
|
100
|
|
Year
|
Jan
|
Feb
|
Mar
|
Apr
|
May
|
Jun
|
Jul
|
Aug
|
Sep
|
Oct
|
Nov
|
Dec
|
Annual
|
|
1903
|
45250
|
34860
|
32410
|
32820
|
34970
|
34060
|
30850
|
31160
|
36900
|
41280
|
48300
|
51020
|
37823
|
|
1904
|
42390
|
34510
|
33760
|
39600
|
40510
|
36810
|
28700
|
31960
|
38950
|
45330
|
52340
|
53850
|
39893
|
|
1905
|
46230
|
36340
|
33320
|
33460
|
29970
|
26080
|
22350
|
24180
|
28120
|
34450
|
42420
|
49960
|
33907
|
|
1906
|
47700
|
37050
|
36550
|
37620
|
36910
|
34410
|
30660
|
27280
|
30910
|
40750
|
46980
|
48310
|
37928
|
|
1907
|
37680
|
33130
|
31490
|
31900
|
35110
|
30730
|
24100
|
23980
|
29390
|
35610
|
42180
|
45680
|
33415
|
|
1908
|
38270
|
30120
|
28350
|
31350
|
34390
|
33840
|
31320
|
30410
|
37370
|
44340
|
55350
|
65760
|
38406
|
|
1909
|
53560
|
38810
|
35460
|
42050
|
50530
|
48140
|
37290
|
36560
|
37940
|
48170
|
53600
|
54350
|
44705
|
|
1910
|
49470
|
39480
|
34890
|
34120
|
41150
|
37400
|
29960
|
33800
|
36260
|
44380
|
53550
|
60160
|
41218
|
|
1911
|
47110
|
34390
|
30640
|
34150
|
36560
|
39260
|
30290
|
26080
|
31460
|
37200
|
46500
|
55440
|
37423
|
|
1912
|
47720
|
38260
|
34750
|
35870
|
33930
|
30660
|
30930
|
31320
|
37580
|
46680
|
52490
|
53260
|
39454
|
|
1913
|
42280
|
34110
|
34170
|
34160
|
39650
|
37930
|
29690
|
27730
|
29040
|
35120
|
42220
|
40930
|
35586
|
|
1914
|
33330
|
26910
|
30320
|
34750
|
32310
|
31780
|
28950
|
26280
|
29980
|
40460
|
49340
|
56810
|
35102
|
|
1915
|
47450
|
31100
|
28730
|
29230
|
29470
|
28440
|
25220
|
25360
|
30420
|
35730
|
41010
|
47170
|
33278
|
|
1916
|
41840
|
31490
|
30370
|
31980
|
37570
|
32240
|
29100
|
27760
|
33810
|
43340
|
54960
|
59680
|
37845
|
|
1917
|
49120
|
38390
|
35010
|
37150
|
42470
|
41220
|
32990
|
29270
|
35990
|
44720
|
55480
|
55920
|
41477
|
|
1918
|
39130
|
29280
|
27900
|
33170
|
34090
|
29790
|
27440
|
29550
|
35470
|
37520
|
41500
|
43840
|
34057
|
|
1919
|
39500
|
33620
|
30380
|
30890
|
30240
|
26380
|
23740
|
26810
|
30550
|
36220
|
41510
|
44630
|
32873
|
|
1920
|
39060
|
30780
|
27230
|
29740
|
34670
|
32090
|
29370
|
32750
|
38460
|
42530
|
50110
|
59540
|
37194
|
|
1921
|
52780
|
37570
|
32740
|
32900
|
37460
|
34180
|
32650
|
30590
|
38200
|
44720
|
53430
|
55850
|
40256
|
|
1922
|
43250
|
36260
|
33300
|
33260
|
32760
|
29720
|
26750
|
25830
|
33390
|
41970
|
53000
|
58140
|
37303
|
|
1923
|
44370
|
33990
|
29540
|
34370
|
41650
|
40550
|
32370
|
33700
|
39390
|
44010
|
50440
|
59870
|
40354
|
|
1924
|
49770
|
38820
|
30880
|
36310
|
42360
|
41450
|
30620
|
30610
|
37450
|
44910
|
57970
|
63370
|
42043
|
|
1925
|
49950
|
34770
|
32720
|
34610
|
34580
|
34160
|
34020
|
32180
|
37050
|
44900
|
55210
|
64170
|
40693
|
|
1926
|
60480
|
40870
|
34900
|
39780
|
43090
|
38090
|
31770
|
31820
|
38150
|
44480
|
55730
|
61660
|
43402
|
|
1927
|
46500
|
34440
|
32250
|
38020
|
38370
|
33660
|
27000
|
27650
|
31860
|
38480
|
46720
|
47350
|
36858
|
|
1928
|
39920
|
34680
|
31430
|
35800
|
40480
|
42290
|
37830
|
33530
|
40740
|
45280
|
49460
|
51730
|
40264
|
|
1929
|
42270
|
35310
|
34090
|
34930
|
36640
|
32940
|
29080
|
30200
|
36110
|
41530
|
51730
|
57930
|
38563
|
|
1930
|
47420
|
37460
|
33870
|
40460
|
44480
|
40740
|
31160
|
27860
|
31850
|
40360
|
48210
|
47100
|
39248
|
|
1931
|
40220
|
35530
|
34170
|
36940
|
37550
|
34530
|
29020
|
28850
|
31750
|
36970
|
44480
|
49130
|
36595
|
|
1932
|
45380
|
32600
|
29860
|
34370
|
35470
|
38280
|
35610
|
30820
|
38200
|
46820
|
56200
|
56380
|
39999
|
|
1933
|
49740
|
46510
|
42730
|
42240
|
37350
|
32560
|
27700
|
28720
|
34020
|
41630
|
46820
|
50950
|
40081
|
|
1934
|
47320
|
33860
|
31090
|
34180
|
35870
|
33330
|
31160
|
32580
|
39030
|
43950
|
54800
|
63670
|
40070
|
|
1935
|
57310
|
43300
|
40510
|
43650
|
44760
|
42300
|
38350
|
31830
|
35580
|
40450
|
45820
|
49040
|
42742
|
|
1936
|
44870
|
37780
|
35270
|
36520
|
37890
|
35490
|
32900
|
32640
|
39350
|
47430
|
53580
|
56770
|
40874
|
|
1937
|
45880
|
37740
|
37620
|
40810
|
44140
|
41460
|
31740
|
31400
|
34770
|
40660
|
52490
|
57900
|
41384
|
|
1938
|
49140
|
34130
|
34410
|
34580
|
35920
|
32880
|
30100
|
32250
|
36710
|
42420
|
52350
|
56790
|
39307
|
|
1939
|
45860
|
39080
|
37250
|
38080
|
40880
|
37470
|
29990
|
29040
|
32020
|
42340
|
52950
|
62380
|
40612
|
|
1940
|
49580
|
41420
|
38640
|
40380
|
42230
|
38920
|
30210
|
32480
|
36500
|
42110
|
50240
|
52780
|
41291
|
|
1941
|
44440
|
34870
|
34620
|
35000
|
34180
|
35270
|
34730
|
31370
|
38020
|
41360
|
47720
|
57110
|
39058
|
|
1942
|
55200
|
45070
|
38440
|
37180
|
36650
|
36500
|
31190
|
33170
|
41280
|
46570
|
47860
|
46450
|
41297
|
|
1943
|
39330
|
32430
|
29690
|
30200
|
32200
|
32050
|
27340
|
28170
|
33840
|
41060
|
45800
|
43730
|
34653
|
|
1944
|
39590
|
35670
|
31670
|
39990
|
40790
|
36460
|
27090
|
28520
|
36420
|
43840
|
50270
|
52030
|
38528
|
|
1945
|
42080
|
32720
|
31840
|
31010
|
31360
|
34560
|
30960
|
30080
|
36830
|
46180
|
54580
|
56250
|
38204
|
|
1946
|
43730
|
31860
|
29340
|
30580
|
34250
|
31740
|
28120
|
29270
|
36840
|
46120
|
54850
|
61300
|
38167
|
|
1947
|
50350
|
39850
|
36080
|
39060
|
45990
|
44510
|
36910
|
34900
|
36730
|
44220
|
49820
|
49540
|
42330
|
|
1948
|
46590
|
39350
|
37990
|
36180
|
37100
|
35080
|
33560
|
34630
|
42040
|
50620
|
60170
|
62740
|
43004
|
|
1949
|
47360
|
34630
|
31920
|
33970
|
32800
|
29350
|
29080
|
32870
|
38140
|
46990
|
53960
|
51030
|
38508
|
|
1950
|
39860
|
33800
|
31250
|
37410
|
36820
|
32500
|
29480
|
32830
|
38270
|
45720
|
56940
|
56150
|
39253
|
|
1951
|
44720
|
36500
|
34040
|
41700
|
37730
|
34170
|
31650
|
28150
|
34240
|
39310
|
53840
|
62780
|
39903
|
|
1952
|
55020
|
38160
|
33000
|
33900
|
39350
|
38650
|
32250
|
31900
|
37050
|
43150
|
51020
|
51520
|
40414
|
|
1953
|
42748
|
34920
|
34230
|
35760
|
36900
|
33800
|
28840
|
25850
|
31910
|
37540
|
45250
|
49370
|
36427
|
|
1954
|
36920
|
29160
|
31780
|
36470
|
39280
|
35860
|
31830
|
27690
|
33620
|
40560
|
50180
|
51450
|
37067
|
|
1955
|
46760
|
41590
|
37680
|
41340
|
45350
|
39190
|
32220
|
32570
|
37440
|
47740
|
59470
|
60790
|
43512
|
|
1956
|
48930
|
38300
|
34460
|
38850
|
46620
|
41840
|
34750
|
30490
|
35440
|
42630
|
50390
|
55490
|
41516
|
|
1957
|
49770
|
37530
|
36150
|
44050
|
44230
|
40840
|
35120
|
32840
|
35380
|
39480
|
48280
|
54520
|
41516
|
|
1958
|
50870
|
37780
|
29820
|
29960
|
34110
|
30660
|
26130
|
26010
|
29880
|
35000
|
42100
|
42900
|
34602
|
|
1959
|
38510
|
34590
|
30180
|
30660
|
31260
|
29920
|
25440
|
25940
|
33870
|
42700
|
49590
|
57720
|
35865
|
|
1960
|
51820
|
40650
|
41510
|
45450
|
48730
|
43540
|
37560
|
35380
|
38900
|
46860
|
56680
|
59540
|
45552
|
|
1961
|
48220
|
41240
|
39900
|
42650
|
44510
|
37530
|
35060
|
36700
|
41410
|
52190
|
65900
|
80830
|
47178
|
|
1962
|
76300
|
61200
|
47280
|
51290
|
53230
|
48710
|
44760
|
40420
|
44240
|
52930
|
64320
|
74890
|
54964
|
|
1963
|
67950
|
55860
|
47560
|
47220
|
53230
|
51800
|
44830
|
39630
|
40690
|
44010
|
51180
|
58540
|
50208
|
|
1964
|
57750
|
47440
|
41830
|
43990
|
47130
|
46750
|
38790
|
32930
|
38810
|
47700
|
61390
|
69410
|
47827
|
|
1965
|
54640
|
40590
|
37580
|
43360
|
43370
|
35590
|
28370
|
30020
|
35980
|
41670
|
51380
|
62350
|
42075
|
|
1966
|
55580
|
43690
|
41880
|
46980
|
50550
|
47930
|
39300
|
36670
|
41690
|
48190
|
55550
|
63040
|
47588
|
|
1967
|
49130
|
35900
|
33130
|
35030
|
35220
|
33030
|
30550
|
31420
|
38050
|
45900
|
60160
|
65540
|
41088
|
|
1968
|
57600
|
44140
|
42800
|
44630
|
46590
|
46150
|
41570
|
36970
|
39700
|
43620
|
50420
|
58560
|
46063
|
|
1969
|
56690
|
48930
|
45360
|
52690
|
53070
|
50700
|
44510
|
43170
|
45980
|
50840
|
59180
|
66420
|
51462
|
|
1970
|
54910
|
44920
|
44300
|
45370
|
45020
|
42310
|
34480
|
36200
|
43330
|
51990
|
62820
|
62540
|
47349
|
|
1971
|
47930
|
38010
|
33630
|
35860
|
37540
|
33050
|
28180
|
32730
|
38690
|
44660
|
50590
|
54330
|
39600
|
|
1972
|
43510
|
34770
|
33130
|
35210
|
36450
|
33400
|
29580
|
29380
|
33000
|
36990
|
50140
|
55880
|
37620
|
|
1973
|
47060
|
37530
|
32340
|
32180
|
34650
|
32240
|
25760
|
26080
|
33170
|
40230
|
47200
|
50400
|
36570
|
|
1974
|
40840
|
34630
|
31530
|
34210
|
36700
|
35790
|
31530
|
33150
|
37410
|
44970
|
52150
|
52180
|
38757
|
|
1975
|
43490
|
37530
|
34490
|
34650
|
36450
|
32560
|
29970
|
29960
|
39110
|
49880
|
60170
|
63650
|
40993
|
|
1976
|
46450
|
38470
|
38300
|
40480
|
42240
|
38600
|
33940
|
32410
|
38950
|
44110
|
52040
|
59240
|
42103
|
|
1977
|
56190
|
46680
|
39680
|
43040
|
45650
|
38580
|
34210
|
33390
|
39260
|
48380
|
55690
|
57770
|
44877
|
|
1978
|
51640
|
37760
|
35800
|
37980
|
42250
|
41950
|
35860
|
33150
|
39440
|
44410
|
53640
|
62440
|
43027
|
|
1979
|
51920
|
45540
|
43540
|
45930
|
46870
|
47780
|
40980
|
33570
|
37600
|
39450
|
47430
|
52280
|
44408
|
|
1980
|
42440
|
35070
|
33340
|
35850
|
38170
|
37170
|
33780
|
34980
|
38050
|
45340
|
53790
|
59530
|
40626
|
|
1981
|
50000
|
39460
|
32940
|
36290
|
35540
|
38330
|
29680
|
30770
|
38900
|
44920
|
51040
|
52160
|
40003
|
|
1982
|
44050
|
35070
|
31400
|
29490
|
32610
|
34340
|
30680
|
29270
|
34040
|
41540
|
56690
|
61230
|
38367
|
|
1983
|
49020
|
36960
|
31360
|
31610
|
29980
|
27060
|
24360
|
25620
|
31250
|
36080
|
45260
|
47720
|
34690
|
APPENDIX 4: ATTRIBUTE TABLE FOR DRAINAGE NETWORK
ORDERING
|
Domain
|
The IDs of the Table's domain, every record (ID) represents a
certain stream.
|
|
UpstreamLinkID
|
The IDs of the streams that directly contribute to the current
stream, e.g. when streams 5 and 7 flow together into stream 12, then the
UpstreamLinkID column will read for the record with ID 12: {5,7}
|
|
UpstreamCoord
|
The XY-coordinate of the beginning of a stream segment
(down-flow); these coordinates are shown as points in the third picture above.
This column is a coordinate column.
|
|
UpstreamElevation
|
The elevation, as extracted from the DEM, at the position of the
upstream coordinate. This column is a value column.
|
|
DownstreamLinkID
|
The ID of the stream segment into which the current stream will
flow (down-flow). This column is a value column.
|
|
DownstreamCoord
|
The XY-coordinate of the end of a stream segment (down-flow).
|
|
DownstreamElevation
|
A column containing the elevation, as extracted from the DEM, at
the position of the downstream coordinate.
|
|
ElevationDifference
|
Height difference between upstream coordinate and downstream
coordinate, i.e. UpstreamElevation - DownstreamElevation.
|
|
Strahler
|
Strahler ordering number; the Strahler ordering number for a
stream is calculated as follows: when streams of equal order join each other:
the Strahler ordering number of one of the streams that directly contributes to
this stream + 1 is assigned;
when streams of unequal order join each other: the largest
Strahler ordering number of the streams that directly contribute to this stream
is assigned;
In other words: the Strahler order values of the UpstreamLinkIDs
are found, when these order values are equal, the value is increased by 1;
when these order values are unequal, the maximum value is
assigned. The Strahler column is a value column.
|
|
Shreve
|
Shreve ordering number; the Shreve ordering number for a stream
is calculated as the sum of the Shreve ordering numbers of the streams that
directly contribute to this stream, i.e. the sum of the Shreve order values of
the UpstreamLinkIDs. The Shreve column is a value column.
|
|
Length
|
The length of a stream measured along the drainage.
|
|
StraightLength
|
The length of a stream calculated as the difference between the
upstream coordinate and the downstream coordinate, i.e. | UpstreamCoord -
DownstreamCoord |
|
|
SlopeAlongDrainage%
|
The average slope in percentages between the upstream coordinate
and the downstream coordinate, when the length is measured along the drainage,
i.e. (ElevationDifference/Length)* 100%
|
|
SlopeAlongDrainageDegree
|
The average slope angle in degrees between the upstream
coordinate and the downstream coordinate, when the length is measured along the
drainage, i.e. tan- 1(ElevationDifference/Length)
|
|
SlopeDrainageStraight%
|
The average slope in percentages between the upstream coordinate
and the downstream coordinate, when the length is the straight length between
the upstream coordinate and the downstream coordinate, i.e.
(ElevationDifference/StraightLength)* 100%
|
|
SlopeDrainageStraightDegree
|
The average slope angle in degrees between the upstream
coordinate and the downstream coordinate, when the length is the straight
length between the upstream coordinate and the downstream coordinate, i.e.
tan1(ElevationDifference/StraightLength)
|
|
Sinuosity
|
A measure for meandering of the stream, i.e. Length /
StraightLength
|
|
TotalUpstreamAlongDrainageLength
|
The total length of all (upstream) streams that contribute to the
current stream
|
|
StrahlerClass
|
An additional class column to be able to display the Strahler
ordering numbers as classes.
|
APPENDIX 5: HORTON STATISTICS FUNCTIONALITY: DEFINITION
OF PARAMETERS
The Horton Statistics operation calculates for all streams with a
certain (Strahler) stream order number i, located in merged catchment C with ID
x:
Cx_N: the number of streams for catchment x, or The number of
streams with a certain Strahler stream order number
Cx_L: the average stream length (km), or The average
length (km) of the streams with this Strahler order number.
Cx_A: the average area of catchments (km2) or
The average area (km2) of the catchments belonging to the streams
with this Strahler order number.
Cx_N_LSq: expected values for Cx_N by means
of a least squares fit through Cx_N, or The expected number of streams
with a certain Strahler stream order number.
Cx_L_LSq: expected values for Cx_L by means
of a least squares fit through Cx_L, or The expected average length
(km) of the streams with this Strahler order number.
Cx_A_LSq: expected values for Cx_A by means
of a least squares fit through Cx_A, or The expected average area
(km2) of the catchments belonging to the streams with this Strahler
order number.
APPENDIX 6: HORTON MORPHOLOGICAL PARAMETERS AND
STATISTICS FOR SUBSEQUENT STRAHLER ORDER
|
strahler Order
|
HORTON MORPHOLOGICAL PARAMETERS
|
|
Calculated
|
Expected
|
|
C_N
|
C_L
|
C_A
|
C_N_LSq
|
C1_L_LSq
|
C_A_LSq
|
|
1
|
1
|
30
|
64.74
|
3322.57
|
25.751
|
69.607
|
4205.716
|
|
2
|
6
|
196.02
|
21035.86
|
8.143
|
169.59
|
14619.42
|
|
3
|
3
|
384.32
|
49761.68
|
2.575
|
413.19
|
50818.28
|
|
4
|
1
|
662.01
|
158672.2
|
0.814
|
1006.7
|
176648.5
|
|
5
|
|
|
|
|
|
1
|
|
6
|
|
|
|
|
|
1
|
|
7
|
|
|
|
|
|
1
|
|
2
|
1
|
26
|
64.76
|
3258.19
|
30.213
|
76.663
|
2964.718
|
|
2
|
8
|
183.8
|
14855.7
|
5.925
|
131.139
|
17944.58
|
|
3
|
1
|
189.49
|
119366.6
|
1.162
|
224.328
|
108613.4
|
|
4
|
1
|
664.74
|
132257.5
|
0.228
|
383.737
|
657405.5
|
|
5
|
|
|
|
|
|
|
|
6
|
|
|
|
|
|
|
|
7
|
|
|
|
|
|
|
|
3
|
1
|
118
|
65.19
|
3137.12
|
133.107
|
80.73
|
3510.212
|
|
2
|
32
|
191.43
|
15777.09
|
33.277
|
178.149
|
15224.16
|
|
3
|
9
|
340.46
|
61493.83
|
8.32
|
393.127
|
66028.79
|
|
4
|
2
|
932.09
|
296725.4
|
2.08
|
867.528
|
286373.8
|
|
5
|
1
|
2130.4
|
646792.4
|
0.52
|
1914.403
|
1242034
|
|
6
|
|
|
|
|
|
|
|
7
|
|
|
|
|
|
|
|
4
|
1
|
168
|
77.44
|
2986.6
|
107.066
|
160.972
|
5432.712
|
|
2
|
42
|
234.59
|
16796.23
|
39.039
|
263.615
|
17644.8
|
|
3
|
13
|
476.94
|
63232.86
|
14.235
|
431.708
|
57308.19
|
|
4
|
5
|
821.84
|
177175
|
5.19
|
706.985
|
186130.1
|
|
5
|
2
|
1013.09
|
450879.8
|
1.893
|
1157.791
|
604528.3
|
|
6
|
1
|
1152.81
|
905331.4
|
0.69
|
1896.051
|
1963436
|
|
7
|
|
|
|
|
|
|
|
5
|
1
|
261
|
57.51
|
2591.04
|
236.501
|
75.237
|
3126.151
|
|
2
|
54
|
185.49
|
16541.88
|
55.742
|
173.055
|
14315.61
|
|
3
|
14
|
346.48
|
70292.39
|
13.138
|
398.046
|
65555.63
|
|
4
|
3
|
981.2
|
358082.7
|
3.097
|
915.553
|
300199.5
|
|
5
|
1
|
2265.76
|
1121600
|
0.73
|
2105.879
|
1374707
|
|
6
|
|
|
|
0.172
|
4843.768
|
6295207
|
|
7
|
|
|
|
|
|
1
|
|
6
|
1
|
151
|
63.27
|
3080.17
|
25.159
|
195.664
|
27871.48
|
|
2
|
26
|
297.12
|
27360.17
|
12.592
|
312.666
|
57809.6
|
|
3
|
6
|
589.78
|
129887.4
|
6.302
|
499.632
|
119905.7
|
|
4
|
1
|
605.16
|
779475.3
|
3.154
|
798.399
|
248702.4
|
|
5
|
1
|
1655.82
|
823385.2
|
1.578
|
1275.822
|
515845.9
|
|
6
|
2
|
1847.5
|
417141.4
|
0.79
|
2038.731
|
1069941
|
|
7
|
1
|
2445.2
|
859575.2
|
0.395
|
3257.842
|
2219218
|
APPENDIX 7 PEARSON PRODUCT MOMENT CORRELATION
BETWEEN
HORTON AND GIUH
Friday, June 27, 2008, 3:52:27 AM
Data source:
Data 1 in Notebook 1
Pearson Product Moment Correlation Friday, June 27, 2008,
3:52:27 AM
Data source: Data 1 in Notebook 1
Cell Contents:
Correlation Coefficient
P Value Number of
Samples
|
Rb
|
Rl
|
Ra
|
LHSOr
|
Tpg
|
Qpg
|
Tpg
|
|
|
|
|
|
|
|
|
|
Rb
|
|
0.903
|
0.952
|
-0.284
|
-0.464
|
0.504
|
-0.464
|
|
|
0.0137
|
0.00345
|
0.585
|
0.354
|
0.308
|
0.354
|
|
|
6
|
6
|
6
|
6
|
6
|
6
|
|
|
|
|
|
|
|
|
|
Rl
|
|
|
0.958
|
-0.287
|
-0.494
|
0.532
|
-0.494
|
|
|
|
0.00267
|
0.582
|
0.32
|
0.277
|
0.32
|
|
|
|
6
|
6
|
6
|
6
|
6
|
|
|
|
|
|
|
|
|
|
Ra
|
|
|
|
-0.386
|
-0.586
|
0.598
|
-0.586
|
|
|
|
|
0.45
|
0.222
|
0.209
|
0.222
|
|
|
|
|
6
|
6
|
6
|
6
|
|
|
|
|
|
|
|
|
|
LHSOr
|
|
|
|
|
0.965
|
-0.96
|
0.965
|
|
|
|
|
|
0.00182
|
0.00243
|
0.00182
|
|
|
|
|
|
6
|
6
|
6
|
|
|
|
|
|
|
|
|
|
Tpg
|
|
|
|
|
|
-0.975
|
1
|
|
|
|
|
|
|
0.000899
|
0
|
|
|
|
|
|
|
6
|
6
|
|
|
|
|
|
|
|
|
|
Qpg
|
|
|
|
|
|
|
-0.975
|
|
|
|
|
|
|
|
0.000899
|
|
|
|
|
|
|
|
6
|
APPENDIX 8.a. LOCAL WATER BALANCE FOR SELECTED GRID CELLS
IN THE CONGO RIVER BASIN (TABLE)
PPT = Precipitation, PEH= Effective Precipitation, PET= Potential
Evapotranspiration, AET = Actual Evapotranspiration, SOM= Soil Moisture, ROF=
Runoff, C= Vertical Integrated Moisture Convergence
|
Long Lat
|
Item
|
Dec Jan Feb Mar Apr May Jun Jul Aug Sep Oct Nov DJF MAM
JJA SON
|
Ann.
|
|
18.31
|
4.24
|
AET
|
32.2
|
18.8
|
34.6
|
89.3
|
106.5
|
121.2
|
102.3
|
102.5
|
102.5
|
105.2
|
105.6
|
91.3
|
85.5
|
317.1
|
307.2
|
302.1
|
1011.9
|
|
18.31
|
4.24
|
PET
|
114.7
|
117.9
|
117.8
|
136.4
|
128.8
|
121.0
|
102.2
|
102.4
|
102.4
|
105.2
|
105.8
|
105.2
|
350.5
|
386.2
|
307.0
|
316.2
|
1359.8
|
|
18.31
|
4.24
|
PPT
|
31.3
|
20.4
|
37.5
|
108.9
|
137.1
|
170.8
|
140.0
|
178.4
|
227.3
|
192.8
|
195.6
|
92.6
|
89.3
|
416.8
|
545.7
|
480.9
|
1532.7
|
|
18.31
|
4.24
|
ROF
|
1.2
|
0.4
|
0.1
|
0.0
|
0.0
|
0.0
|
0.0
|
11.8
|
33.2
|
29.3
|
13.7
|
4.1
|
1.7
|
0.0
|
45.0
|
47.1
|
93.9
|
|
18.31
|
4.24
|
SOM
|
0.0
|
0.0
|
0.0
|
0.0
|
0.0
|
2.9
|
9.3
|
17.6
|
17.6
|
17.6
|
17.6
|
3.9
|
0.0
|
2.9
|
44.5
|
39.1
|
86.6
|
|
18.31
|
4.24
|
C
|
-0.1
|
0.0
|
0.0
|
0.0
|
0.0
|
0.1
|
0.2
|
0.7
|
1.1
|
1.0
|
0.4
|
-0.3
|
-0.1
|
0.1
|
1.9
|
1.1
|
3.1
|
|
21.04
|
-0.04
|
AET
|
105.8
|
108.7
|
108.3
|
122.3
|
112.5
|
110.2
|
100.1
|
96.2
|
105.1
|
107.8
|
110.1
|
103.5
|
322.8
|
345.0
|
301.3
|
321.4
|
1290.5
|
|
21.04
|
-0.04
|
PET
|
105.8
|
113.8
|
113.6
|
122.3
|
112.5
|
110.2
|
100.1
|
96.2
|
105.1
|
107.8
|
110.1
|
103.5
|
333.2
|
345.0
|
301.3
|
321.4
|
1300.9
|
|
21.04
|
-0.04
|
PPT
|
165.0
|
123.3
|
135.7
|
181.5
|
159.0
|
189.1
|
143.1
|
146.5
|
184.7
|
192.2
|
233.7
|
210.9
|
424.0
|
529.6
|
474.3
|
636.8
|
2064.7
|
|
21.04
|
-0.04
|
ROF
|
7.4
|
2.2
|
0.7
|
0.2
|
0.1
|
0.0
|
0.0
|
0.0
|
0.0
|
8.0
|
23.4
|
24.5
|
10.2
|
0.3
|
0.0
|
55.9
|
66.4
|
|
21.04
|
-0.04
|
SOM
|
17.6
|
7.4
|
4.7
|
10.9
|
16.6
|
17.6
|
17.6
|
17.6
|
17.6
|
17.6
|
17.6
|
17.6
|
29.7
|
45.1
|
52.8
|
52.8
|
180.4
|
|
21.04
|
-0.04
|
C
|
0.1
|
-0.3
|
-0.1
|
0.2
|
0.2
|
0.5
|
0.4
|
0.5
|
0.7
|
0.8
|
1.0
|
1.2
|
-0.2
|
0.9
|
1.6
|
3.0
|
5.2
|
|
28.52
|
-2.31
|
PET
|
115.2
|
122.4
|
118.4
|
136.3
|
123.4
|
119.8
|
103.5
|
100.9
|
103.5
|
109.8
|
111.6
|
107.2
|
356.0
|
379.5
|
307.9
|
328.5
|
1371.9
|
|
28.52
|
-2.31
|
PPT
|
165.4
|
136.1
|
133.8
|
181.2
|
170.2
|
107.1
|
32.4
|
16.6
|
57.3
|
105.9
|
134.9
|
175.5
|
435.3
|
458.4
|
106.3
|
416.3
|
1416.4
|
|
28.52
|
-2.31
|
ROF
|
1.2
|
0.4
|
0.1
|
0.0
|
0.0
|
0.0
|
1.8
|
14.9
|
29.2
|
21.7
|
13.0
|
3.9
|
1.6
|
0.0
|
45.9
|
38.6
|
86.2
|
|
28.52
|
-2.31
|
SOM
|
1.2
|
0.0
|
0.0
|
0.0
|
0.0
|
11.3
|
28.2
|
28.2
|
28.2
|
28.2
|
28.2
|
17.4
|
1.2
|
11.3
|
84.5
|
73.7
|
170.6
|
|
28.52
|
-2.3 1
|
C
|
0.9
|
0.5
|
0.6
|
0.9
|
0.9
|
0.0
|
-0.4
|
0.0
|
0.0
|
0.0
|
0.3
|
1.0
|
2.0
|
1.8
|
-0.4
|
1.2
|
4.6
|
|
28.52
|
-2.30
|
AET
|
95.2
|
100.5
|
93.6
|
102.9
|
92.9
|
91.0
|
41.3
|
16.7
|
51.4
|
86.6
|
99.7
|
97.5
|
289.2
|
286.9
|
109.4
|
283.8
|
969.4
|
|
22.25
|
-5.56
|
AET
|
112.0
|
114.6
|
109.7
|
122.9
|
110.8
|
87.7
|
12.3
|
7.6
|
19.8
|
65.2
|
122.1
|
106.5
|
336.3
|
321.4
|
39.8
|
293.9
|
991.4
|
|
22.25
|
-5.56
|
PET
|
108.7
|
111.7
|
103.6
|
114.9
|
108.2
|
118.1
|
114.5
|
112.2
|
112.1
|
114.4
|
124.4
|
111.3
|
324.1
|
341.2
|
338.8
|
350.1
|
1354.2
|
|
22.25
|
-5.56
|
PPT
|
232.2
|
137.5
|
125.6
|
204.4
|
177.5
|
76.5
|
17.6
|
15.6
|
49.6
|
126.5
|
171.6
|
235.3
|
495.3
|
458.3
|
82.7
|
533.4
|
1569.7
|
|
22.25
|
-5.56
|
ROF
|
0.0
|
0.0
|
0.0
|
0.0
|
1.4
|
0.4
|
0.1
|
0.0
|
0.0
|
0.0
|
0.0
|
0.0
|
0.0
|
1.8
|
0.2
|
0.0
|
2.0
|
|
22.25
|
-5.56
|
SOM
|
28.2
|
23.6
|
20.9
|
28.2
|
28.2
|
4.7
|
0.1
|
0.0
|
0.0
|
0.0
|
0.4
|
28.2
|
72.7
|
61.0
|
0.2
|
28.6
|
162.4
|
|
22.25
|
-5.56
|
C
|
0.9
|
0.1
|
0.0
|
0.6
|
0.1
|
-0.7
|
-0.1
|
0.0
|
0.0
|
0.0
|
0.0
|
1.1
|
1.0
|
0.0
|
-0.1
|
1.1
|
2.0
|
|
15.22
|
-4.22
|
AET
|
105.5
|
109.8
|
107.2
|
122.2
|
114.1
|
105.4
|
25.8
|
2.8
|
3.6
|
35.9
|
98.4
|
107.8
|
322.6
|
341.6
|
32.1
|
242.1
|
938.4
|
|
15.22
|
-4.22
|
PET
|
105.5
|
109.8
|
109.4
|
122.2
|
114.1
|
106.0
|
90.5
|
93.6
|
106.7
|
113.8
|
116.0
|
107.8
|
324.8
|
342.2
|
290.9
|
337.7
|
1295.6
|
|
15.22
|
-4.22
|
PPT
|
162.8
|
142.4
|
121.1
|
180.9
|
213.7
|
125.1
|
4.5
|
1.8
|
3.5
|
38.6
|
123.6
|
246.2
|
426.2
|
519.8
|
9.7
|
408.4
|
1364.2
|
|
15.22
|
-4.22
|
ROF
|
13.1
|
4.1
|
1.2
|
0.4
|
8.4
|
2.5
|
0.8
|
0.2
|
0.1
|
0.0
|
0.0
|
8.5
|
18.4
|
11.3
|
1.0
|
8.5
|
39.2
|
|
15.22
|
-4.22
|
SOM
|
27.7
|
27.7
|
18.1
|
24.2
|
27.7
|
22.2
|
1.0
|
0.0
|
0.0
|
0.0
|
0.0
|
27.7
|
73.6
|
74.1
|
1.0
|
27.7
|
176.5
|
|
15.22
|
-4.22
|
C
|
0.4
|
0.1
|
-0.3
|
0.2
|
0.4
|
-0.1
|
-0.7
|
0.0
|
0.0
|
0.0
|
0.0
|
1.2
|
0.3
|
0.5
|
-0.7
|
1.2
|
1.3
|
|
25.11
|
0.31
|
AET
|
101.2
|
82.1
|
88.8
|
119.3
|
112.3
|
108.6
|
94.5
|
79.5
|
98.5
|
102.1
|
108.9
|
101.9
|
272.1
|
340.2
|
272.5
|
312.9
|
1197.7
|
|
25.11
|
0.31
|
PET
|
108.4
|
114.6
|
114.7
|
123.8
|
116.8
|
111.6
|
96.2
|
96.0
|
99.1
|
108.0
|
114.5
|
107.9
|
337.8
|
352.1
|
291.3
|
330.3
|
1311.5
|
|
25.11
|
0.31
|
PPT
|
101.7
|
71.5
|
96.2
|
164.0
|
179.1
|
161.7
|
109.2
|
119.5
|
156.0
|
184.9
|
214.1
|
196.3
|
269.4
|
504.8
|
384.7
|
595.4
|
1754.2
|
|
25.11
|
0.31
|
ROF
|
7.8
|
2.3
|
0.7
|
0.2
|
0.6
|
1.5
|
0.4
|
3.3
|
11.6
|
16.8
|
24.6
|
25.9
|
10.8
|
2.3
|
15.3
|
67.3
|
95.7
|
|
25.11
|
0.31
|
SOM
|
4.7
|
0.3
|
0.0
|
0.0
|
11.2
|
17.0
|
11.8
|
12.3
|
17.6
|
17.6
|
17.6
|
17.6
|
5.0
|
28.3
|
41.7
|
52.8
|
127.8
|
|
25.11
|
0.31
|
C
|
-0.2
|
-0.1
|
0.0
|
0.0
|
0.4
|
0.2
|
-0.2
|
0.0
|
0.5
|
0.6
|
0.8
|
0.9
|
-0.2
|
0.6
|
0.3
|
2.2
|
2.9
|
|
27.29
|
-11.40
|
AET
|
109.6
|
112.4
|
104.4
|
106.2
|
99.1
|
17.0
|
0.2
|
0.0
|
1.3
|
20.1
|
78.2
|
112.1
|
326.3
|
222.4
|
1.5
|
210.4
|
760.5
|
|
27.29
|
-11.40
|
PET
|
113.3
|
111.6
|
98.0
|
117.1
|
118.7
|
119.7
|
108.5
|
118.4
|
142.4
|
163.4
|
175.5
|
135.3
|
322.9
|
355.4
|
369.3
|
474.2
|
1521.9
|
|
27.29
|
-11.40
|
PPT
|
259.2
|
247.5
|
267.6
|
206.0
|
55.9
|
2.6
|
1.0
|
1.6
|
0.0
|
2.1
|
33.6
|
164.2
|
774.3
|
264.6
|
2.6
|
200.0
|
1241.5
|
|
27.29
|
-11.40
|
ROF
|
12.7
|
23.8
|
24.3
|
12.0
|
3.6
|
1.1
|
0.3
|
0.1
|
0.0
|
0.0
|
0.0
|
0.0
|
60.7
|
16.7
|
0.5
|
0.0
|
77.9
|
|
27.29
|
-11.40
|
SOM
|
28.2
|
28.2
|
28.2
|
28.2
|
2.5
|
0.0
|
0.0
|
0.0
|
0.0
|
0.0
|
0.0
|
0.0
|
84.5
|
30.7
|
0.0
|
0.0
|
115.2
|
|
27.29
|
-11.40
|
C
|
1.1
|
0.9
|
1.6
|
0.2
|
-0.8
|
-0.1
|
0.0
|
0.0
|
0.0
|
0.0
|
0.0
|
0.0
|
3.6
|
-0.7
|
0.0
|
0.0
|
2.9
|
|
16.03
|
1.37
|
AET
|
81.0
|
55.8
|
81.2
|
111.7
|
105.0
|
102.3
|
87.1
|
86.6
|
93.0
|
99.0
|
105.4
|
99.0
|
218.0
|
319.0
|
266.7
|
303.4
|
1107.1
|
|
16.03
|
1.37
|
PET
|
105.4
|
99.3
|
98.1
|
111.7
|
105.0
|
102.3
|
87.1
|
89.9
|
93.0
|
99.0
|
105.4
|
99.0
|
302.7
|
319.0
|
270.0
|
303.4
|
1195.2
|
|
16.03
|
1.37
|
PPT
|
74.2
|
60.3
|
96.1
|
151.0
|
134.3
|
179.0
|
143.7
|
91.7
|
144.0
|
223.0
|
237.1
|
172.1
|
230.6
|
464.3
|
379.3
|
632.1
|
1706.3
|
|
16.03
|
1.37
|
ROF
|
9.0
|
2.7
|
0.8
|
0.2
|
0.1
|
8.1
|
10.5
|
3.1
|
7.4
|
33.0
|
39.0
|
29.9
|
12.5
|
8.4
|
20.9
|
102.0
|
143.8
|
|
16.03
|
1.37
|
SOM
|
1.8
|
0.1
|
0.1
|
3.4
|
3.5
|
17.6
|
17.6
|
8.8
|
17.6
|
17.6
|
17.6
|
17.6
|
2.0
|
24.5
|
44.1
|
52.9
|
123.5
|
|
16.03
|
1.37
|
C
|
-0.2
|
0.0
|
0.0
|
0.1
|
0.0
|
0.7
|
0.3
|
-0.2
|
0.5
|
1.1
|
1.3
|
1.0
|
-0.2
|
0.8
|
0.7
|
3.4
|
4.7
|
|
20.04
|
-11.04
|
AET
|
114.2
|
115.8
|
107.6
|
109.9
|
101.8
|
18.3
|
0.0
|
-0.1
|
2.6
|
23.5
|
78.7
|
117.2
|
337.6
|
229.9
|
2.5
|
219.4
|
789.4
|
|
20.04
|
-11.04
|
PET
|
114.2
|
115.8
|
107.6
|
109.9
|
110.9
|
122.0
|
113.3
|
125.5
|
144.0
|
148.1
|
140.2
|
117.2
|
337.6
|
342.8
|
382.8
|
405.5
|
1468.6
|
|
20.04
|
-11.04
|
PPT
|
214.3
|
212.3
|
182.1
|
205.0
|
101.1
|
7.2
|
-0.2
|
-0.2
|
2.6
|
24.9
|
92.1
|
172.3
|
608.6
|
313.3
|
2.2
|
289.3
|
1213.4
|
|
20.04
|
-11.04
|
ROF
|
4.1
|
18.5
|
20.3
|
9.4
|
2.8
|
0.8
|
0.3
|
0.1
|
0.0
|
0.0
|
0.0
|
0.0
|
42.9
|
13.1
|
0.4
|
0.0
|
56.3
|
|
20.04
|
-11.04
|
SOM
|
28.2
|
28.2
|
28.2
|
11.1
|
0.2
|
0.0
|
0.0
|
0.0
|
0.0
|
0.0
|
7.3
|
21.2
|
84.5
|
11.3
|
0.0
|
28.5
|
124.3
|
|
20.04
|
-11.04
|
C
|
0.8
|
0.6
|
0.7
|
0.3
|
-0.5
|
-0.3
|
0.0
|
0.0
|
0.0
|
0.0
|
0.0
|
0.2
|
2.1
|
-0.5
|
0.0
|
0.2
|
1.9
|
|
23.05
|
8.00
|
AET
|
4.5
|
0.8
|
7.0
|
51.5
|
88.7
|
123.5
|
113.4
|
103.4
|
108.0
|
109.7
|
116.9
|
43.6
|
12.3
|
263.7
|
324.8
|
270.2
|
871.0
|
|
23.05
|
8.00
|
PET
|
114.2
|
114.6
|
99.7
|
112.7
|
110.1
|
123.6
|
128.4
|
133.2
|
136.1
|
131.7
|
136.6
|
121.3
|
328.5
|
346.4
|
397.7
|
389.6
|
1462.1
|
|
23.05
|
8.00
|
PPT
|
258.2
|
195.3
|
188.0
|
232.0
|
181.6
|
48.5
|
3.5
|
0.5
|
18.8
|
81.6
|
161.4
|
242.9
|
641.5
|
462.0
|
22.7
|
486.0
|
1612.2
|
|
23.05
|
8.00
|
ROF
|
8.8
|
8.2
|
12.0
|
8.5
|
2.5
|
0.8
|
0.2
|
0.1
|
0.0
|
0.0
|
0.0
|
0.0
|
29.1
|
11.7
|
0.3
|
0.0
|
41.2
|
|
23.05
|
8.00
|
SOM
|
28.2
|
28.2
|
28.2
|
28.2
|
28.2
|
1.6
|
0.0
|
0.0
|
0.0
|
0.0
|
0.0
|
26.6
|
84.5
|
58.0
|
0.0
|
26.6
|
169.0
|
|
23.05
|
8.00
|
C
|
0.8
|
0.7
|
1.0
|
1.0
|
0.0
|
-0.8
|
-0.1
|
0.0
|
0.0
|
0.0
|
0.0
|
0.9
|
2.5
|
0.2
|
-0.1
|
0.9
|
3.6
|
|
32.03
|
-5.05
|
AET
|
113.1
|
114.6
|
107.9
|
125.2
|
119.0
|
79.7
|
17.7
|
8.3
|
59.4
|
95.5
|
124.4
|
115.3
|
335.7
|
324.0
|
85.3
|
335.3
|
1080.3
|
|
32.03
|
-5.05
|
PET
|
116.9
|
116.0
|
110.8
|
123.0
|
118.8
|
126.5
|
129.4
|
143.0
|
158.8
|
158.8
|
159.8
|
122.9
|
343.7
|
368.4
|
431.2
|
441.5
|
1584.8
|
|
32.03
|
-5.05
|
PPT
|
164.1
|
127.6
|
121.8
|
152.5
|
168.9
|
55.1
|
4.2
|
0.0
|
-0.1
|
12.5
|
46.0
|
130.7
|
413.6
|
376.4
|
4.2
|
189.2
|
983.3
|
|
32.03
|
-5.05
|
ROF
|
25.3
|
10.0
|
5.0
|
15.6
|
3.5
|
1.0
|
0.3
|
0.1
|
0.0
|
0.0
|
0.0
|
6.5
|
40.3
|
20.2
|
0.4
|
6.5
|
67.4
|
|
32.03
|
-5.05
|
SOM
|
-5.1
|
5.2
|
2.1
|
0.9
|
0.6
|
12.2
|
0.1
|
0.0
|
0.0
|
0.0
|
0.0
|
0.0
|
2.3
|
13.6
|
0.1
|
0.0
|
16.0
|
|
32.03
|
-5.05
|
C
|
0.1
|
0.0
|
0.0
|
0.0
|
0.1
|
0.0
|
0.0
|
0.0
|
0.0
|
0.0
|
0.0
|
0.0
|
0.1
|
0.1
|
0.0
|
0.0
|
0.2
|
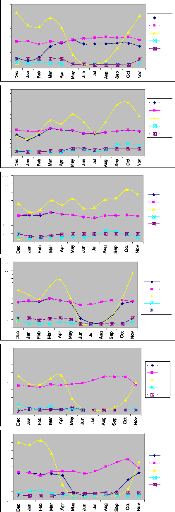
300
260
220
300
260
220
300
260
220
300
260
220
300
260
220
300
260
220
180
140
100
180
140
100
180
140
100
180
140
100
180
140
100
180
140
100
-20
-20
-20
-20
-20
-20
60
20
60
20
60
20
60
20
60
20
60
20
LUBUMBASHI(-14, 27)
UP-NORTH
BOYENDE
URAMBO
KINSHASA
OUESSO
AET PET PPT ROF SOM
AET PET PPT ROF SOM
AET PET PPT ROF SOM
AET PET PPT ROF SOM
AET PET PPT ROF SOM
AET PET PPT ROF SOM
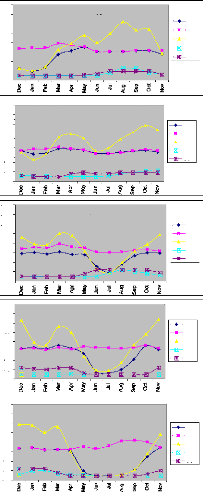
300
260
220
300
260
220
300
260
220
300
260
220
180
140
100
180
140
100
300
260
220
180
140
100
180
140
100
180
140
100
-20
-20
-20
-20
20
60
20
60
20
60
20
60
20
60
20
BUKAVU (28.52, -2.30)
SOUTH-WEST
KANANGA
BANGUI
KISANGANI
AET PET PPT ROF SOM
AET PET PPT ROF SOM
AET PET PPT ROF SOM
AET PET PPT ROF SOM
AET PET PPT ROF SOM
APPENDIX 8.b. LOCAL WATER BALANCE FOR SELECTED GRID CELLS
IN THE CONGO RIVER BASIN (GRAPHS)
APPENDIX 9: SEASONAL DISTRIBUTION OF THE CONVERGENCE
MOISTURE SAMPLES FOR SELECTED GRID CELLES OVER THE CONGO BASIN (C)
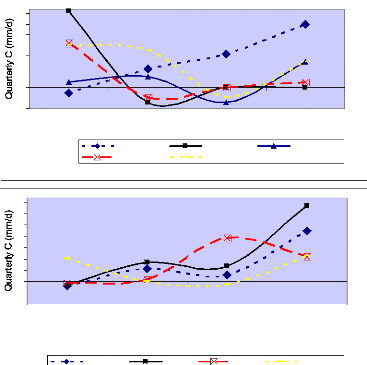
4
3
3
2
2
1
1
0
-1
-1
DJF MAM JJA SON
BOYENDE LUBUMBASHI KINSHASA
SOUTH-WEST BUKAVU
4
3
3
2
2
1
1
0
-1
-1
DJF MAM JJA SON
KISANGANI OUESSO BANGUI UP-NORTH
The first graph shows stations in the southern hemisphere. The
second corresponds to the northern hemisphere.
| 
