|

GHENT UNIVERSITY
FACULTY OF PHARMACEUTICAL SCIENCES
LABORATORY OF PHARMACEUTICAL TECHNOLOGY
___________________________
Academic year 2002-2003
AN IN VITRO STUDY OF THE QUALITY OF ESSENTIAL DRUGS
AVAILABLE ON THE RWANDAN MARKET
Thesis submitted to Ghent University, Belgium, in partial
fulfilment of the
requirements for the degree of Master in Pharmaceutical
Sciences (M. Pharm)
By
Pierre Claver KAYUMBA (B.
Pharm.)
Faculty of Sciences and Technology, Department of Pharmacy,
National University of Rwanda, Butare-Rwanda.
Promoters:
Prof. Dr. Apr. J.P. REMON
Prof. Dr. Apr. C. VERVAET
This work is dedicated to my lovely wife Verdiane and to
our beloved children Audrey, Gabin and Jean Marc, for their love, patience,
understanding and care.
Acknowledgements
At the end of this thesis, I would like to express my
gratitude to the government of Rwanda (GOR) for the provision of a scholarship
to support my studies in Belgium.
I wish to thank Prof.Dr. J.P. Remon, for accepting me in
his laboratory and promoting this work. His encouragement, inspiration and
moral support were very important in the accomplishment of this work.
I am also grateful to Prof.Dr. C. Vervaet for his advice
and support towards the realisation of this work.
My appreciation goes to Prof.Dr. W. Baeyens and Prof.Dr.
J. Demeester for their lectures, which were very useful in my research
work.
Thanks to Pharm. D. Ameye for his guidance and assistance
in the various analytical methods.
I am grateful to Dr. J.D. Ntawukuliryayo for his advice,
kindness and sympathy in carrying out my study.
My gratitude goes to Pharm. E. Bienvenu for his critical
comments, which contributed to the final form of this thesis.
My sincere thanks to the Laboratory of Pharmaceutical
Technology for their hospitality and support. Especially, I thank D. Tensy, M.
De Meyer, K. Wullaert, and B. Vandenbussche for their invaluable
assistance.
I wish to thank my colleagues, master students A. Dukic,
A. Eltraplsi and K. W. Mwamwitwa for their useful moral and technical support,
advices and suggestions in the realisation of this work.
I extend special thanks to my wife Verdiane, my daughter
Audrey, my sons Gabin and Jean Marc, for their love, courage, patience and
understanding that made ever possible the realisation of this work.
Thanks to all Rwandan people resident in Ghent or
Brussels, who have contributed to this thesis in many different ways.
Pierre Claver KAYUMBA
September, 2003
I. Introduction, Background, and Objectives
I.1 Introduction
The World Health Organization (WHO) passed in 1975 a
resolution (WHO 28.66) which marked the birth of the Essential Drugs Concept
(EDC). The aim was to solve the problem of accessibility to drugs by the
population in developing countries. In most developing countries people lack
access to drugs because they are expensive and the purchase capacity is very
low. The idea behind the EDC is the recognition that only a few drugs are
necessary for the treatment of the majority of the diseases facing the majority
of the population. In 1977 a model list of Essential Drugs was established, the
criteria of including a drug in the list were: established safety and efficacy,
proven quality, constant availability and affordability. The WHO encouraged all
nations to establish their own Essential Drug List based on the above criteria.
The Rwandan government through the Ministry of Health established its first
national essential drug list in 1991. The principe was that all drugs included
should be, if possible, generics which are cheap and the health workers
(governmental as well as private) were recommend to refer to that list when
prescribing and dispensing. The list was reviewed in 1997 and 1999 and the last
revision was this year.
Counterfeiting of pharmaceuticals and the proliferation of
substandard drugs constitute a serious health risk to the consumers around the
world. The WHO records show that problems of substandard and counterfeit drugs
are on the increase as 50% of all reported cases occurred in the period 1993 to
1997. Most of these incidences (70%) were reported in developing countries. The
report identified the cause of the poor quality of drugs: in about 50% of all
cases the formulations did not contain any drug, 20% contained the wrong active
ingredient and 10% the wrong amount of active ingredients. In another 5% of the
reported incidences did the formulation contain the right active ingredient in
the correct amount, but were judged substandard by failing in other quality
tests. The antibiotics were the major pharmacological class of drugs with the
largest incidence (60%) of counterfeiting (WHO, 2000). According the
International Federation of Pharmaceutical Manufacturers Association (IFPMA)
about 7% of all drugs being sold around the world in 1992 were of poor quality:
being counterfeit or substandard.
In Rwanda
there are no facilities for quality control of pharmaceuticals, no systematic
monitoring of the quality of drugs on the market. This gross deficiency
increases the risk that the importers of pharmaceuticals would go for cheap
possibly low quality products because the substandard products would not be
detected.
After the genocide, the Rwandan pharmaceuticals market is
characterized by the presence of many generics from multisource suppliers and
healthcare providers. Consequently clinicians and pharmacists are faced with
selecting a product that gives the same clinical effect than that claimed to do
so. In most of cases this selection is based on economical considerations and
on the assumption that those dosage forms containing the same amount of active
ingredient are the equivalent.
In addition, there are wide price differences between
formulations containing the same amount of active ingredient (even more than
500%); subsequently patients with low purchasing power will go for cheap
brands. With such differences in price it is essential to know if those brands
are really pharmaceutically equivalent, or if there is a relationship between
price and quality.
I. 2 Background
The quality of pharmaceutical products has been a major
concern in many WHO forums. The existence of counterfeit and substandard drug
preparations, which are of unacceptable quality, incited many studies about the
quality of pharmaceuticals available in different countries. The quality of the
pharmaceuticals in the market depends much on the manufacturer and purchaser's
integrity. Through several studies done, it has been shown that the regular
surveillance on the quality and bioavailability of the formulations marketed in
a country is very important.
Even in developed countries where the pharmaceutical market is
highly controlled and strictly regulated, it was possible to find substandard
drugs in the market:
- The National Medicine Control Laboratory of
Finland reported on the quality and bioequivalency of different brands of
erythromycin tablets: the bioavailability of one brand being very low (Venho et
al., 1987). In the same laboratory Eranko et al. (1990) noticed differences in
bioavailability between different brands of nifedipine tablets. In all
occasions the low availability brand had to be withdrawn from the market.
- In studies done in Canada involving 229
generic brands, 9% were identified to be of an unacceptable standard (Maddock,
1986).
In developing countries, Rwanda included, the control and
regulation of pharmaceuticals is not very strict and there have been many
reports of substandard as well as fake drugs on the market:
- Studies done in Nigeria to evaluate the quality of quinine
tablets reported the presence of fake formulations (Sowumni et al., 1994).
- A report on the quality of pharmaceuticals in developing
countries was made by Shakoor et al. (1997) on 81 drugs sampled from Nigeria
and 15 from Thailand, antimalarials and antibiotics commonly used in these
countries. They analyzed by HPLC the content of the active ingredient as well
as the presence of impurities and degradation products. The results showed that
36% (25) of the samples from Nigeria and 40% (6) from Thailand did not comply
with pharmacopoeia standards and 3 of the substandard samples from Nigeria (2
chloroquine and 1 amoxicillin) and 3 from Thailand (chloroquine) were fake.
Through these observations the authors concluded that the major reason for
substandard drugs in the developing countries was poor manufacturing
practice.
- Sulfamethoxazole, an active pharmaceutical ingredient
manufactured in India, was found to be of poor quality and rejected, but was
deliberately being placed at the bottom of every fourth drum ready to be
exported abroad (WHO, 1997).
- Recently, in the Laboratory of Pharmaceutical Technology of
Ghent University, a study on the quality of essential drugs available on the
Tanzanian market was done by Risha et al. (2002). They evaluated the in vitro
availability and its stability under simulated tropical conditions of 22
formulations containing paracetamol, acetylsalicylic acid, chloroquine and
sulfadoxine/pyrimethamine. They used methods specified in the USP 24 monographs
of the respective drugs. All drugs analyzed passed the pharmacopoeia
requirements for the drug content. However seven formulations failed to meet
the USP 24 tolerance limits for dissolution. In addition five formulations
failed to meet the USP 24 tolerance limits for dissolution after being
subjected for six months to an accelated stability test under simulated
tropical conditions (75 % RH, 40 °C). They concluded that the dissolution
behaviour of 12 of the samples was not satisfactory.
They recommended the validation of the manufacturing process
and the use of excipients with predetermined properties.
I.3 Objectives
Main objective
Since there are no reports about the quality of
pharmaceuticals in Rwanda, this study was undertaken to evaluate the quality of
some essential drugs marketed in Rwanda. The main objective of this study is to
assess the quality of some essential drugs available on the Rwandan market
through the USP 24 requirements. Furthermore to check their stability under
simulated tropical conditions of the IVth climatic zone (40C and
75%RH).
Specific objectives
· Determination of the drug content
· Determination of the in vitro drug dissolution
· Evaluation of the impact of accelerated stability
testing (storage at 40°C, 75 % RH) on drug content and in vitro
dissolution.
According to this study an acceptable
formulation complies with the USP 24 specifications with the respect to the
dissolution and amount of active ingredients. A stable product is defined as a
product which shows no significant degradation or change in its physical and
chemical properties and remains within the labelled specifications.
II. Quantitative drug analysis and evaluation of the
influence of accelerated stability testing on the in vitro dissolution.
Immediate release solid dosage forms are routinely subjected
to tests such as content uniformity, weight, friability, hardness and
disintegration, tests mainly performed by manufacturers to assess
batch-to-batch uniformity. As the efficacy and safety of a dosage form is
dependent on the content of active ingredient, the test for drug content is
recommended in pharmacopoeia monographs. The test which is often most
associated with the assessment of in vivo performance is the in vitro
dissolution test, because even when a formulation contains the right amount of
drug it can fail to release the content at the site of absorption due to the
poor dissolution.
- Dissolution tests are used to assess the dissolution
properties of the drug itself in order to choose appropriate excipients for the
formulation.
- Dissolution tests are a very important tool to ensure
continuing product quality and performance after certain changes, such as
changes in the formulation, the manufacturing process, the site of manufacture,
and the scale-up of the manufacturing process (Guidance for industry, 1997).
- Clinical scientists rely on dissolution tests to establish
an in vitro/in vivo correlation between drug release from the dosage form and
drug absorption. The dissolution of an oral solid product can impact the rate
and the amount of drug available for absorption and hence influence the
therapeutic efficacy of the product. It is essential that the dissolution
characteristics remain unchanged throughout the product shelf life.
- Generally in developing countries, where technology and other
resources are limited to conduct an in vivo bioequivalence study, appropriate
dissolution studies, such as profile comparison between the local generic
product and the reference product under different test conditions may be used
to assure product quality (Shah, 1998).
Stability of a pharmaceutical product means the maintenance of
the quality defined in the specifications of the drug product up till the end
of the manufacturer's stated shelf life. The quality of the drug product is
determined by the content and purity of the active ingredient and by the
organoleptic, physiochemical and microbiological properties (Grimm, 1986).
Stability tests are a series of tests designed to obtain
information on the stability of pharmaceutical products, in order to define
their shelf life and utilisation period under specified packaging and storage.
Dissolution stability is an important tool to assess the quality of the
product. Is therefore both the legal and ethical responsibility of the
manufacturer to ensure that the product meets all the quality specifications
during the shelf life period as long as it is stored under the conditions
specified on the label.
For worldwide stability tests, the earth is divided into four
climatic zones into which individual countries are assigned. Rwanda can be
assigned to the climatic zone II (subtropical and Mediterranean climates,
storage conditions 25°C/60% RH) (Grimm, 1998). If imported drug
formulations have not been optimised for the corresponding climate zone, their
effectiveness may be compromised during transportation or/and storage.
Regarding the regulatory aspects, the WHO recommends an
accelerated stability test under zone IV climatic conditions (storage
conditions of 40 °C / 75 % RH) to be performed on all drugs intended for
the global market (Matthews, 1999).
II.1. Amoxicillin formulations
II.1.1 Material and equipment
Materials
· Amoxyphar 250 mg capsules ( Labophar,
Rwanda)
· Elymox 250 mg capsules (Elys chemical
industries, Kenya)
· Amoxysha 500 mg capsules (Dilam, Canada)
· Amoxicillin (Alpha Pharma, Belgium)
· Acetonitrile (Biosolve, The Netherlands)
· Monobasic potassium phosphate (Vel, Belgium)
All these chemicals and reagents were at least of analytical
grade.
Equipment
· Incubator: U-60 (Memmert, Analis, Namen,
Belgium)
· Column: Lichrospher 100 RP-C 18 e (5um), 250X4
mm
(Merck-Hitachi, Darmstadt,
Germany)
· Detector: L-7400 UV detector (Merck-Hitachi,
Darmstadt, Germany)
· Pump: L-7100 pump (Merck-Hitachi,
Darmstadt, Germany)
· Integrator: D-7000 integrator (Merck-Hitachi,
Darmstadt, Germany)
· Software Package `HPLC System Manager'
(Merck-Hitachi, Darmstadt,
Germany)
· Lambda 12 UV/VIS Spectrophotometer
(Perkin Elmer UV/VIS,
Perkin Elmer, Norwalk, USA)
· Dissolution equipment (VK 7000, Vankel
Technology, Cary, NC, USA)
II.1.2 Quantitative drug analysis
1.2.1 Methods
The amount of amoxicillin and the dissolution rate for each
formulation were determined by using the methods described in the USP 24
monograph for amoxicillin.
· Standard preparation
160 mg of amoxicillin was accurately weighed and dissolved in
about 80 ml of diluent. The resulting solution was diluted to 100.0 ml to give
a solution with an amoxicillin concentration of 1600 mg/l. 7.5ml from the above
solution were diluted to 10.0 ml with diluent to give a standard solution with
an amoxicillin concentration of 1200 mg/l.
· Sample preparation
The content of 10 capsules was removed as complete as possible
and accurately weighed. A portion equivalent to 240 mg of anhydrous amoxicillin
was dissolved in about 180 ml of diluent.The suspension was mixed, sonicated
and diluted to 200.0 ml, then filtered through a 0.2um cellulose acetate filter
(Sartorius, Goettingen, Germany). The filtrate was used as assay
preparation.
· Calibration curve
A calibration curve (peak area vs. amoxicillin concentration)
y = 29147 (298)x + 2709 (59) with a correlation coefficient (R2) of
0.9996 (0.0001) (n = 3) was constructed using standard solutions from 60 to 300
mg/l. The precision of the method was determined by calculating the relative
standard deviation (within a day and within three days)
of the peak area responses after repeated injections (n =3) of
an amoxicillin standard solution (120 mg/l).
· Diluent preparation
13.6 g of monobasic potassium phosphate
(KH2PO4) was dissolved in 2000 ml of distilled water, the
pH adjusted to 5.0 0.1 by using a 45% (w/w) aqueous solution of potassium
hydroxide.
· Mobile phase
The mobile phase consisted of a degassed mixture of diluent
and acetonitrile in a ratio of 94:6 (v/v).
· Chromatographic
conditions
Flow rate: 1.4 ml/min
Detection wavelength: 230 nm
Injection volume: 20ul
Temperature: Room temperature
Equal volumes of standard and assay preparations were
separately injected, the chromatograms were recorded, and the major peak
integrated. The quantity, in mg, of anhydrous amoxicillin in the portion of
capsules taken was calculated by the formula:
0.2 CP( ru/rs )
In which C is the concentration, in mg/ml, of amoxicillin in
the standard preparation, P is the stated amoxicillin content in ug/mg,
ru and rs are the amoxicillin peak responses obtained
from the assay and the standard preparation, respectively.
A part of the capsules was stored in a sealed box above a
saturated solution of sodium chloride (RH 75% 5 %). The sealed box was placed
in an incubator maintained at 40°C.
1.2.2 Results
The relative standard deviation (RSD) of the chromatographic
method was 0.24 % within a day and 1.36% within three days, which complies with
the USP 24 requirements (RSD should be less than 2%) and proving the precision
of the method.
The results of the drug content (Table 1.1) show that all
formulations complied with USP 24 specifications for amoxicillin content (90% -
120% of the labelled content).
Table 1.1: The amoxicillin content (expressed
as a percentage of the labelled amount) before and after 6 months of stability
testing at simulated tropical conditions.
Manufacturer
% of the labelled amount per capsule
0 months
6 months
Elys chemicals (Elymox) 102.4
100.8
Labophar (Amoxyphar) 103.7
101.6
Dilam (Amoxysha 500) 100.8
98.4
Containing 500 mg amoxicillin per capsule.
II.1.3 In vitro dissolution
1.3.1 Methods
· Preparation of dissolution
medium
Distilled water was used as dissolution medium.
· Calibration curve
Stock solution
30 mg of amoxicillin standard powder was accurately weighed
and dissolved into a required volume of dissolution medium to make a solution
having a concentration of 300mg/l, used as stock solution.
Standard solutions
5, 10, 15, 20, and 25 ml from the stock solution were
separately transferred to 25.0 ml volumetric flasks and diluted to volume using
dissolution medium. The resulting standard solutions had concentrations of 60,
120, 180, 240 and 300 mg/l. Absorbances of the above standard solutions were
spectrophotometrically measured at 272 nm.
A calibration curve (absorbance vs. amoxicillin concentration)
y = 0.003x + 0.0017 with a correlation coefficient (R2) of 0.9999
was constructed.
· Dissolution testing
Dissolution profiles were determined using the USP basket
method (Method 1) at a rotational speed of 100 rpm for capsules containing 250
mg, and using the USP paddle method (Method 2) at a rotational speed of 75 rpm
for capsules containing 500 mg.
Each of 6 capsules was placed inside a dissolution vessel
filled with 900 ml of dissolution medium maintained at 37 0.5°C. At
different time intervals (10, 20, 30, 40, 50 and 60 minutes) 5 ml of samples
were manually withdrawn, filtered, and analyzed spectrophotometrically at 272
nm for their amoxicillin concentration. Samples from 500 mg capsules were
diluted twice before analysis. The amount of the drug dissolved was calculated
by means of the above mentioned calibration curve.
1.3.2 Results
Table 1.2 shows the percentage dissolved within 60 minutes of
dissolution testing and Figure 1.1 the different dissolution profiles. Before
stability testing all drugs complied with the USP 24 dissolution requirements
(not less than 80% of the labelled amount should dissolve within 60 minutes).
The amount of drug released after 60 minutes of dissolution test was more than
90% for all formulations. The accelerated stability testing did not affect the
dissolution profiles; the percentage released remained within the USP 24 limits
for all formulations.
Table 1.2: Percentage amoxicillin dissolved within 60 minutes
of dissolution testing before and after 3 and 6 months of storage at 40°C
and 75% RH. USP requirements: more than 80 % released within 60 minutes.
Manufacturer
% of the labelled amount released
0 month 3 months 6 months
Elys chemicals (Elymox) 99.9
94.5 91.3
Labophar (Amoxyphar) 96.7
96.3 96.7
Dilam (Amoxysha 500) 104.2
102.9 97.7


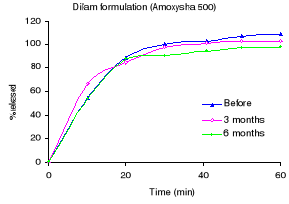
Figure 1.1: Dissolution profiles of amoxicillin formulations
before and after 3 and 6 months storage at 40°C and 75 % RH.
II.2 Acetylsalicylic acid formulations
II.2.1 Material and equipment
Material
· Aspirin 500 mg tablets (B.J. International, India)
· Minasprin 300 mg tablets (Girlloh Pharmacy, Surendra
Nagar, India)
· Saraprin 500 mg tablets (S&R pharmaceuticals,
Rwanda)
· Aspirin 500 mg tablets (Bayer, Greece)
· Acetonitrile (Biosolve, The Netherlands)
· Acetylsalicylic acid (Sigma - Aldrich chemie,
Germany)
· Salicylic acid (Ludeco-Belgium)
· Formic acid (Sigma - Aldrich chemie, Germany)
· 1-Heptanesulfonate sodium (Sigma - Aldrich chemie,
Germany)
· Glacial acetic acid (Vel, Belgium)
· Potassium dihydrogen phosphate (Vel, Belgium)
· Orthophosphoric acid (Vel, Belgium)
· Sodium acetate anhydrous (Vel, Belgium)
All chemicals and reagents were at least of analytical
grade.
Equipment
· Incubator: U-60 (Memmert, Analis, Namen,
Belgium)
· Column: Lichrospher 100 RP-C 18 e (5um), 250X4
mm
(Merck-Hitachi, Darmstadt,
Germany)
· Detector: L-7400 UV detector (Merck-Hitachi,
Darmstadt, Germany)
· Pump: L-7100 pump (Merck-Hitachi,
Darmstadt, Germany)
· Integrator: D-7000 integrator (Merck-Hitachi,
Darmstadt, Germany)
· Software Package `HPLC System Manager'
(Merck-Hitachi, Darmstadt,
Germany)
· Lambda 12 UV/VIS Spectrophotometer
(Perkin Elmer UV/VIS,
Perkin Elmer, Norwalk, USA)
· Dissolution equipment (VK 7000, Vankel
Technology, Cary, NC, USA)
II.2.2 Quantitative drug analysis
2.2.1 Methods
The amount of acetylsalicylic acid and salicylic acid and the
dissolution rate for each formulation was determined using the methods
described in USP 24.
· Mobile phase
1.36 g of potassium dihydrogen phosphate was weighed dissolved
in distilled water to make 1L of solution having a concentration of 0.01M.
0.67 ml of orthophosphoric acid (H3PO4 ,
M.M: 98, 1.71 kg/l, 85%) were transferred to a 1L flask and distilled water was
added to make a 0.01M solution. The above solutions were mixed in a ratio of
50:50 and the pH adjusted to 2.3 with orthophosphoric acid.
A mixture of the resulting solution, acetonitrile, and
methanol in the portion of 70:25:5 respectively was used as mobile phase.
· Standard solution salicylic acid
(SA)
30 mg of salicylic acid was accurately weighed and dissolved
in mobile phase to make 100 ml of solution. The resulting solution had a
salicylic acid concentration of 300 mg/l.
500ul of the above solution were diluted to 10 ml, to obtain a
standard solution with a salicylic acid concentration of 15 mg/l.
· Standard solution acetylsalicylic
acid (ASA)
100 mg of acetylsalicylic acid was accurately weighed and
dissolved to make a 100.0 ml solution, from which 5 ml was diluted twice to
obtain a standard solution having an acetylsalicylic acid
concentration of 500 mg/l.
· Sample preparation
From each formulation 10 tablets were weighed and powdered. An
accurately weighed portion of powder, equivalent to 100 mg of acetylsalicylic
acid was dissolved in 20 ml of mobile phase. The mixture was vigorously shaken
for about 10 minutes, and then filtered through a 0.2-um cellulose acetate
filter (Sartorius, Goettingen, Germany).
1.0 ml from the filtrate was diluted to 10.0 ml with diluting
solution. The final solution had a theoretical concentration of 500 mg/l
acetylsalicylic acid, and was used for the determination of the acetylsalicylic
acid and salicylic acid amount in the formulation analysed.
· Calibration curve
A calibration curve (peak area vs. acetylsalicylic
concentration) y = 12151 ( 44) x + 2378 (1115) with a correlation coefficient
(R2) of 0.9999 (0.0001) (n = 3) was constructed using standard
solution concentrations from 100 to 500 mg/l. And for salicylic acid a
calibration curve) y = 938 (28) x - 5015 (516) with a correlation coefficient
(R2) of 0.9999 (0.0001) (n = 3) was constructed using standard
solutions concentrations from 10 to 50 mg/l. The precision of the
acetylsalicylic acid and salicylic acid determination was determined by
calculating the relative standard deviation (RSD) of the peak area responses
after repeated injections (n =3) of a mixture of acetylsalicylic acid and
salicylic acid standard solution (500 : 50mg/l) a day and within three days.
The resolution factor (R) between acetylsalicylic and
salicylic acid was calculated as
R= 2 (t2 - t1 ) / (w1
+ w2)
With t1 and w1 being the retention time
and baseline width of the acetylsalicylic peak, t2 and w2
the respective values for salicylic acid.
· Chromatographic
conditions
Flow rate : 1.2 ml/min
Detection wavelength : 280 nm
Injection volume : 20ul
Temperature : Room
temperature
· Procedure
Equal volumes of the acetylsalicylic acid standard and assay
preparations were separately injected, the chromatograms were recorded and the
major peaks integrated. The quantity Q, in mg, of aspirin in the portion of
tablets taken was calculated by the formula:
Q = 200 C (ru/rs)
In which C is the concentration, in mg/ml, of acetylsalicylic
acid in the standard preparation, ru and rs are the
aspirin peak responses obtained from the assay and the standard preparation,
respectively.
The quantity, in mg, of salicylic acid in the portion of
tablets taken was calculated by the formula:
2000 (C/Q) (ru/rs)
In which C is the concentration, in mg/ml, of salicylic acid
in the standard preparation, Q the quantity, in mg, of acetylsalicylic acid in
the portion of tablets as determined above, ru and rs are
the salicylic acid peak responses obtained from the assay and the standard
preparation, respectively.
· Stability testing
A part of the tablets was stored in a sealed box containing a
saturated solution of sodium chloride (RH 75% 5 %). The box was placed in an
incubator maintained at 40°C 2°C. After 3 and 6 months, tablets were
withdrawn from the incubator and evaluated for dissolution rate and their
content of active ingredient.
2.2.2 Results
The RSD was 0.25 % within a day and 1.78% within three days,
which complies with the USP 24 requirements (RSD should be less than 2%). The
resolution between acetylsalicylic acid and salicylic acid peaks was 1.75,
which means that those two compounds were well separated. The results of the
drug content (Table 2.1) show that the B.J. International formulation failed to
comply with the USP 24 specifications for acetylsalicylic acid content (90% -
110%). All formulations were compliant with the USP 24 specifications for
salicylic acid limits (<0.3%) (Table 2.2). Upon 6 months of storage at
40°C and 75 % RH, only the Bayer formulation did not show a significant
change. The B.J. International formulation was badly affected as almost 50% of
the tablet was transformed into the powder. As a consequence the salicylic acid
content increased and the acetylsalicylic acid content decreased
dramatically.
Table 2.1 The acetylsalicylic acid content (expressed as a
percentage of the labelled amount) before and after 6 months of stability
testing at simulated tropical conditions.
Manufacturer % of the
labelled amount per tablet
0 months
6 months
Bayer 99.4
94.3
B.J. International 87.0
59.0
Girlloh (Minasprin) 99.4
80.3
S&R (Saraprin) 91.7
-
Table 2.2 The salicylic acid content (expressed as a
percentage of the acetylsalicylic acid labelled amount) before and after 6
months of stability testing at simulated tropical conditions.
Manufacturer
% of salicylic acid
0 months 6 months
Bayer 0.00
0.24
BJ international 0.00
0.61
Girlloh (Minasprin) 0.01
0.24
S&R (Saraprin)
0.02 -
Containing 300 mg of acetylsalicylic acid per tablet.
Not analyzed for stability testing.
II.2.3 In vitro dissolution
2.3.1 Methods
· Preparation of dissolution
medium
The dissolution medium consisted of 0.05M acetate buffer
prepared as follows: 9 g of anhydrous sodium acetate was dissolved in 800 ml
distilled water, 8.3 ml of glacial acetic acid was added. The resulting
solution was diluted to 5.0L.
· Calibration curve
Stock solution
35 mg of acetylsalicylic acid reference powder was accurately
weighed and transferred to a 100.0 ml volumetric flask. 1 ml of methanol was
added, then about 50 ml of dissolution medium. The mixture was sonicated for
about 2 min. The solution was diluted to 100.0 ml using the dissolution medium
to obtain a stock solution with a concentration of 350 mg of acetylsalicylic
acid / l.
Standard solutions
3, 4, 5, 7 and 9 ml were separately diluted to 10.0 ml using
the dissolution medium; the resulting standard solutions had concentrations of
105, 140, 175, 245 and 315 mg/l acetylsalicylic acid, respectively. Absorbances
of those solutions were spectrophotometrically measured at 265nm. A calibration
curve (absorbance vs. acetylsalicylic acid concentration) y = 0.0027x + 0.0031
with a correlation coefficient (R2) of 0.9998 was constructed.
Dissolution testing
Dissolution profiles were determined using the USP basket
method (Method 1). Each of 6 tablets was added to a basket fixed to a stirring
shaft, placed inside a dissolution vessel (filled with 900 ml of dissolution
medium maintained at 37°C 0.5°C) and rotated at a speed of 50 rpm. At
different time intervals (5, 10, 15, 20, 25 and 30 min) 5ml filtered samples
were manually withdrawn, diluted twice with dissolution medium and
spectrophotometrically analysed at 265 nm. Concentrations were calculated from
the above mentioned calibration curve.
2.3.2 Results
The dissolution profiles for each formulation before and after
3 and 6 months of accelerated stability testing are shown in Figure 2.1 and the
percent drug released after 30 minutes in Table 2.3. Before stability testing
the S&R formulation did not disintegrate, while others complied with the
USP 24 requirements (not less than 80% dissolved within 30 minutes). After six
months of stability testing, only the Bayer formulation remained compliant with
the USP 24 requirements. The percentage released for Minasprin formulation
decreased, however it remained compliant with the USP 24 requirements. The
release rate of the B.J International formulation decreased dramatically.
Table 2.3 Percentage of acetylsalicylic acid dissolved within
30 minutes of dissolution testing before and after 3 and 6 months of storage at
40°C and 75% RH. USP requirements: more than 80 % released within 30
minutes.
Manufacturer % of the
labelled amount per tablet
0 months
3 months 6 months
Bayer 99.0
97.2 95.6
BJ international 84.7
71.8 34.3
Girlloh (Minasprin) 97.2
80.5 76.5
S&R (Saraprin) 5.1
- -
Not analyzed for 3 and 6 months.
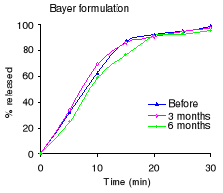


Figure 2.1 Dissolution profiles of acetylsalicylic acid before
and after 3 and 6 months of storage at 40°C and 75 % RH:
II.3 Sulfamethoxazole / Trimethoprim (Cotrimoxazole)
formulations
II.3.1 Material and equipment
Material
· Batrimox 480 mg tablets (Sulfamethoxazole 400 mg /
Trimethoprim 80 mg)
(S&R Pharmaceuticals, Rwanda)
· Unitrim 480 mg tablets(Sulfamethoxazole 400 mg /
Trimethoprim 80 mg)
(Elys chemicals industries, Kenya)
· Bactiphar 480 mg tablets (Sulfamethoxazole 400 mg /
Trimethoprim 80 mg) (Labophar, Rwanda)
· Sulfamethoxazole (Alpha pharma, Belgium)
· Trimethoprim (Alpha pharma, Belgium)
· Hydrochloric acid 37% (Merck/Eurolab, Darmstadt,
Germany)
· Acetonitrile HPLC grade (Biosolve, The Netherlands)
· Glacial acetic acid 100% (Merck/Eurolab, Darmstadt,
Germany)
· Triethylamine (Sigma chemicals, St Louis, USA)
Equipment
· Incubator: U-60 (Memmert, Analis, Namen,
Belgium)
· Column: Lichrospher 100 RP-C 18 e (5um), 250X4
mm
(Merck-Hitachi, Darmstadt,
Germany)
· Detector: L-7400 UV detector (Merck-Hitachi,
Darmstadt, Germany)
· Pump: L-7100 pump (Merck-Hitachi,
Darmstadt, Germany)
· Integrator: D-7000 integrator (Merck-Hitachi,
Darmstadt, Germany)
· Software Package `HPLC System Manager'
(Merck-Hitachi, Darmstadt,
Germany)
· Lambda 12 UV/VIS Spectrophotometer
(Perkin Elmer UV/VIS,
Perkin Elmer, Norwalk, USA)
· Dissolution equipment (VK 7000, Vankel Technology,
Cary, NC, USA)
II.3.2 Quantitative drug analysis
3.2.1 Methods
The amount of sulfamethoxazole and trimethoprim and the
dissolution rate of both drug for each formulation were determined using the
methods described in the USP 24.
· Mobile phase
A mixture of 650 ml distilled water, 250 ml acetonitrile, and
1 ml triethylamine was homogenized and allowed to equilibrate at room
temperature. The pH of the above mixture was adjusted to 5.9 0.1 using diluted
glacial acetic acid (10%). The resulting solution was diluted to 1.0 L to
obtain the mobile phase.
· Standard solution
Separately, 160 mg of sulfamethoxazole and 32 mg of
trimethoprim were accurately weighed and dissolved in methanol to give a 100.0
ml solution. The above solution had a concentration of 1600 mg/l and 320 mg/l
of sulfamethoxazole and trimethoprim, respectively. 5.0 ml from the above
solution was diluted to 50.0 ml to obtain standard solution with concentration
of 160 mg/l and 32 mg/l of those two compounds, respectively.
· Sample preparation
From each formulation 10 tablets were weighed and finely
powdered. An accurately weighed portion of powder equivalent to 160 mg of
sulfamethoxazole was diluted with mobile phase to give 100.0 ml of suspension,
sonicated for about 5 min and filtered through a 0.2-um cellulose acetate
filter (Sartorius, Goettingen, Germany). 5.0 ml from the filtrate were diluted
to 50.0ml and used as assay preparation.
· Calibration curve
A calibration curve (peak area vs. concentration) y = 64590
(122) x + 43448 (351) with a correlation coefficient (R2) of 0.9995
(0.0001) (n = 5) was constructed using standard solutions with sulfamethoxazole
concentrations from 16 to 160 mg/l. For trimethoprim a calibration curve y =
31476 (1265) x + 2088 ( 509) with a correlation coefficient (R2) of
0.9979 (0.0025) (n = 5) was constructed using standard solutions with
trimethoprim concentrations from 3.2 to 32 mg/l. The precision of the method
was determined by calculating the relative standard deviation (within a day and
within three days) of the peak area responses after repeated injections (n = 5)
of a standard solution (160 mg/l sulfamethoxazole and 32 mg/l trimethoprim).
The resolution factor (R) between sulfamethoxazole and
trimethoprim was calculated from their respective peaks:
R= 2 ( t1 - t2 ) / (w1
+ w2)
With t1 and w1 being the retention time
and baseline width of the sulfamethoxazole peak, t2 and
w2, the respective values for trimethoprim.
· Chromatographic
conditions
Flow rate : 0.8 ml/min
Detection wavelength : 254 nm
Injection volume : 20ul
Temperature : Room
temperature
· Procedure
Equal volumes of standard and assay preparations were
separately injected, the chromatograms were recorded and the major peaks
integrated. The drug quantities, Q, (in mg of sulfamethoxazole and trimethoprim
in the portion of tablets taken) were calculated by the formula:
Q=1000 C (ru/rs)
Whereby C is the concentration, in mg/ml, of sulfamethoxazole
and trimethoprim in the standard preparation, ru and rs
are the analyte corresponding peak responses obtained from the assay and the
standard preparation, respectively.
· Stability testing
A part of the tablets was stored in a sealed box containing a
saturated solution of sodium chloride (RH 75 5 %). This box was placed in an
incubator maintained at 40 2°C. After 3 and 6 months, tablets were
withdrawn from the incubator and evaluated for dissolution rate and their
content in active ingredient.
3.2.2 Results
The RSD was 0.47 and 0.24 % within a day and 1.51 and 1.29 %
within three days for sulfamethoxazole and trimethoprim, respectively; which
complies with the USP 24 requirements (RSD should be less than 2%). The
resolution factor R between sulfamethoxazole and trimethoprim was 8.02, which
means that they were well separated. As shown in Table 3.1, the S&R
formulation (Batrimox) failed to comply with USP 24 requirements in terms of
drug content for sulfamethoxazole (93 - 107 % of the labelled amount of
sulfamethoxazole and trimethorim).
There was no impact of stability testing on the drug content
for the Elys formulation (Unitrim), while the drug content of both
sulfamethoxazole and trimethoprim for the Labophar formulation (Bactiphar)
decreased.
Table 3.1 The
sulfamethoxazole and trimethoprim content (expressed as a percentage
of the labelled amount) before and after 6 months of stability testing at
simulated tropical conditions.
Manufacturer
% of the labelled amount per tablet
0 months 6 months
Sulfamethoxazole
Elys Chemicals (Unitrim) 97.1
94.6
Labophar (Bactiphar) 97.2
92.8
S&R pharmaceuticals (Batrimox)* 91.6
-
Trimethoprim
Elys Chemicals (Unitrim) 99.6
97.0
Labophar (Bactiphar) 98.1
84.8
S&R pharmaceuticals (Batrimox)* 97.4
-
* Not analyzed for stability testing because it failed the
dissolution test for both two
compounds immediately after purchase.
II.3.3 In vitro dissolution
3.3.1 Methods
· Preparation of dissolution
medium
98.64 ml of 37 % hydrochloric acid was diluted to 10.0 L with
distilled water. The resulting 0.1 N solution was used as dissolution
medium.
· Calibration curves of
sulfamethoxazole and trimethoprim
Based on the HPLC method, the calibration curves mentioned in
quantitative drug analysis were used for calculation of the amount of drug
released. The same mobile phase, the same standard solutions and the same
concentrations were used.
· Dissolution testing
Dissolution profiles were determined using the USP paddle
method (Method 2). Each of 6 tablets was placed inside a dissolution vessel
filled with 900 ml of dissolution medium maintained at 370.5°C stirred by
paddles rotating at 75 rpm. At 10, 20, 30, 40, 50 and 60 minutes 5 ml samples
were withdrawn, filtered, diluted 5 times and analysed for their contents of
sulfamethoxazole and trimethoprim by UV at 254 nm after chromatographic
separation.
Procedure
20 ul of each of the collected samples was injected onto the
HPLC system and the corresponding peak areas were recorded. The content of each
sample was calculated using the calibration curve.
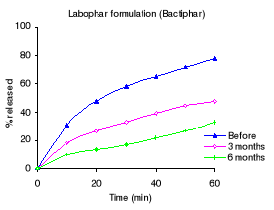
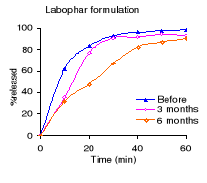
3.3.2 Results
Table 3.2 shows the percentage drug dissolved and Figures 3.1
to 3.3 the dissolution profiles of different formulations analyzed. For
sulfamethoxazole the Elys formulation (Unitrim) complied with the USP 24
requirements (not less than 70% of sulfamethoxazole and trimethoprim labelled
amount should dissolve within 60 min), however the drug percentage released
decreased after 6 months of storage at 40°C/ 75% RH. Labophar formulation
(Bactiphar) released 45% of the drug, the S&R formulation (Batrimox)
released only 15%. Those last two formulations did not disintegrate completely
within 60 minutes. For trimethoprim, 90% of the labelled amount of Unitrim and
77.5% of Bactiphar were released within 60 min, which complies with USP 24,
while Batrimox failed (only 35.4 % was released).
Table 3.2 Percentage of sulfamethoxazole and
trimethoprim dissolved within 60 minutes of dissolution testing before, after 3
and 6 months of storage at 40°C and 75% RH. USP requirements: more than 70
% released within 60 minutes.
Manufacturer
% of the labelled amount per tablet
0 months 3 months 6 months
Sulfamethoxazole
Elys Chemicals (Unitrim) 98.0
94.2 77.0
Labophar (Bactiphar) 45.0
38.5 25.8
S&R pharmaceuticals (Batrimox) 15.0
- -
Trimethoprim
Elys Chemicals (Unitrim) 95.1
92.2 90.2
Labophar (Bactiphar) 77.6
47.4 32.5
S&R pharmaceuticals (Batrimox) 35.4
- -
Figure 3.1 In vitro dissolution profiles of sulfamethoxazole
and trimethoprim before stability testing


Figure 3.2 Dissolution profiles of sulfamethoxazole
formulations before and after 3 and 6 months storage at 40°C and 75 %
RH.


Figure 3.3 Dissolution profiles of trimethoprim formulations
before and after 3 and 6 months of storage at 40°C and 75 % RH.

II.4 Metronidazole formulations
II.4.1 Material and equipment
Material
· Elogyl 200mg tablets (Elys Chemicals Industries,
Kenya)
· Metronidazole 250mg tablets (Holden Medica, The
Netherlands)
· Metronidazole 250mg tablets (Labophar, Rwanda)
· Metronidazole (Alpha pharma, Belgium)
· Methanol (Biosolve, The Netherlands)
· Hydrochloric acid (Sigma Aldrich Chemie, Germany)
All chemicals and reagents were at least of analytical
grade.
Equipment
· Incubator: U-60 (Memmert, Analis, Namen,
Belgium)
· Column: Lichrospher 100 RP-C 18 e (5um), 250X4
mm
(Merck-Hitachi, Darmstadt,
Germany)
· Detector: L-7400 UV detector (Merck-Hitachi,
Darmstadt, Germany)
· Pump: L-7100 pump (Merck-Hitachi,
Darmstadt, Germany)
· Integrator: D-7000 integrator (Merck-Hitachi,
Darmstadt, Germany)
· Software Package `HPLC System Manager'
(Merck-Hitachi, Darmstadt,
Germany)
· Lambda 12 UV/VIS Spectrophotometer
(Perkin Elmer UV/VIS,
Perkin Elmer, Norwalk, USA)
· Dissolution equipment (VK 7000, Vankel Technology,
Cary, NC, USA)
II.4.2. Quantitative drug analysis
4.2.1 Methods
The amount of metronidazole and the dissolution rate for each
formulation were determined using the methods described in USP 24.
· Mobile phase
A degassed mixture of methanol and distilled water (20:80) was
used as mobile phase.
· Standard preparation
An accurately weighed quantity (50 mg) of metronidazole
standard was dissolved in mobile phase to obtain a 100.0 ml solution having a
known concentration of 0.5 mg/ml, which was used as standard preparation.
· Assay preparation
From each formulation 10 whole tablets were transferred to a
suitable sized volumetric flask, which when diluted with methanol yielded a
solution having a concentration of 10 mg/ml. In case of Elys formulation
(Elogyl) a 200.0 ml flask was used, while for the others 250.0 ml flasks were
used. Methanol was added and the mixture shaken by mechanical means until the
tablets were disintegrated. Methanol was added to volume. The mixture was
allowed to stand until the insoluble material had settled. 5 ml of the clear
supernate liquid was pipeted, diluted to 100.0 ml using mobile phase, mixed and
filtered through a 0.2 um cellulose acetate filter (Sartorius, Goettingen,
Germany). The resulting filtrate was used as assay preparation.
· Chromatographic
conditions
Flow rate: 1ml/min
Detection wavelength: 254 nm
Injection volume: 20ul
Temperature: Room temperature
· Calibration curve
A calibration curve (peak area vs. concentration) y = 16582622
(133565) x + 73066 (9932) with a correlation coefficient (R2) of
0.9997 (0.0001) (n = 3) was constructed using standard solutions from 50 to 500
mg/l.
The precision of the method was determined by calculating the
relative standard deviation (within a day and within three days) of the peak
area responses after repeated injections (n =3) of a metronidazole standard
solution (500 mg/l).
· Procedure
Equal volumes of standard and assay preparations were
separately injected, the chromatograms were recorded and the major peaks
integrated. The drug quantity, Q, (in mg of metronidazole in the portion of
tablets taken) was calculated by the formula:
Q = 10(L/D) C (ru/rs)
Whereby L is the labelled amount, in mg, of metronidazole in
each tablet, D is the concentration (mg/ml) of metronidazole in the assay
preparation, C is the concentration (mg/ml) of the standard preparation,
ru and rs are the metronidazole peak responses obtained
from the assay preparation and the standard preparation, respectively.
· Stability testing
A part of the tablets was stored in a sealed box containing a
saturated solution of sodium chloride (RH 75% 5 %). The box was placed in an
incubator maintained at 40°C 2°C. After 3 and 6 months, tablets were
withdrawn from the incubator and evaluated for dissolution rate and their
content of active ingredient.
4.2.2 Results
The RSD was 0.37 % within a day and 0.46% within three days,
which complies with the USP 24 requirements (RSD should be less than 2%).
The results of the drug content (Table 4.1) show that all
formulations complied with the USP 24 specifications for metronidazole content:
90% - 110% of the labelled amount.
Table 4.1: The metronidazole content
(expressed as percentage of the labelled amount) before and after 6 months of
storage at 40°C and 75 % RH.
Manufacturer % of
the labelled amount per tablet
0
months 6 months
Elys chemicals 98.2
93.5
Labophar 98.6
97.2
Holden Medica 91.7
90.3
II.4.3 In vitro dissolution
4.3.1 Methods
· Preparation of dissolution
medium
98.64 ml of 37% hydrochloric acid was diluted to 10.0L with
distilled water. The resulting 0.1N hydrochloric acid solution was used as
dissolution medium.
· Calibration curve
Stock solution
40 mg of metronidazole was accurately weighed, dissolved in
dissolution medium and sonicated for about 5 min to give a 25 ml solution
having a concentration of 1600 mg/l.
5 ml from this solution was diluted to 50.0 ml with
dissolution medium to give a stock solution with a concentration of 160
mg/l.
Standard solutions
0.5, 0.75, 1, 2 and 3 ml of the stock solution were separately
diluted with dissolution medium to 10.0 ml. The standard solutions obtained had
concentrations of 8, 12, 16, 32 and 48 mg/l, respectively.
A calibration curve (absorbance vs. concentration) y =
0.0355x + 0.0114 with a correlation coefficient (R2) of 0.9998 was
constructed.
· Dissolution testing
Dissolution profiles were determined using the USP basket
method (Method 1). Each of 6 tablets was added to a basket connected to a
stirring shaft which was placed inside a dissolution vessel filled with 900ml
of dissolution medium maintained at 370.5°C. The rotation speed of the
basket was 100 rpm. At 10, 20, 30, 40, 50 and 60 minutes, 5ml samples were
withdrawn, filtered, diluted 20 times and analysed spectrophotometrically at
278nm.
4.2.2 Results
Table 4.2 shows the percentage dissolved within 60 minutes of
dissolution testing and Figure 4.1 the different dissolution profiles. Before
stability testing all drugs complied with the USP 24 dissolution requirements
(not less than 80% of the labelled amount should dissolve within 60 minutes).
The amount of drug released after 60 minutes of dissolution test was more than
90% for all formulations. The Holden Medica formulation did not withstand the
storage at high temperature and high relative humidity: the percentage released
being outside the specifications after 6 months.
Table 4.2: Percentage of metronidazole dissolved within 60
minutes of dissolution testing before and after 3 and 6 months of storage at
40°C and 75% RH. USP requirements: more than 80 % released within 60
minutes.
Manufacturer % of the
labelled amount released
0 months
3 months 6 months
Elys chemicals (Elogyl) 97.8
99.8 88.7
Labophar 98.2
92.6 90.1
Holden medica 95.3
87.8 66.9


Figure 4.1: Dissolution profiles of metronidazole formulations
before and after 3 and 6 months of storage at 40°C and 75 % RH.
II.5 Paracetamol formulations
II.5.1 Material and equipment
Material
· Cetamol 500 mg tablets (Regal pharmaceuticals,
Kenya)
· Panadol 500 mg tablets (SmithKline Beecham, Kenya)
· Saramol 500 mg tablets (S&R Pharmaceuticals,
Rwanda)
· Paracetamol (Ludeco, Belgium)
· Potassium dihydrogen phosphate (Vel, Belgium)
· Sodium hydroxide (Acros Organics, Belgium)
· Methanol-HPLC quality (Biosolve B, The Netherlands)
All chemicals and reagents were at least of analytical
grade.
Equipment
· Incubator: U-60 (Memmert, Analis, Namen,
Belgium)
· Column: Lichrospher 100 RP-C 18 e (5um), 250X4
mm
(Merck-Hitachi, Darmstadt,
Germany)
· Detector: L-7400 UV detector (Merck-Hitachi,
Darmstadt, Germany)
· Pump: L-7100 pump (Merck-Hitachi,
Darmstadt, Germany)
· Integrator: D-7000 integrator (Merck-Hitachi,
Darmstadt, Germany)
· Software Package `HPLC System Manager'
(Merck-Hitachi, Darmstadt,
Germany)
· Lambda 12 UV/VIS Spectrophotometer
(Perkin Elmer UV/VIS,
Perkin Elmer, Norwalk, USA)
· Dissolution equipment (VK 7000, Vankel Technology,
Cary, NC, USA)
II.5.2 Quantitative drug analysis
5.2.1 Methods
The amount of paracetamol and the dissolution rate for each
formulation was determined using the method described in USP 24.
· Mobile phase
A degassed mixture of distilled water and methanol (75:25) was
used as mobile phase.
· Standard preparation
An accurately weighed quantity of paracetamol (100 mg) was
dissolved in mobile phase to make a 100 ml solution having a concentration of 1
mg/ml. From that solution 200 ul was diluted to 20.0 ml, and a resulting
solution (0.01 mg/ml) was used as standard solution.
· Sample preparation
From each formulation, 10 tablets were weighed and finely
powdered. An accurately weighed portion of powder, equivalent to 100 mg of
paracetamol was diluted with mobile phase to make 100 ml of mixture, which was
filtered through a 0.2um cellulose acetate filter (Sartorius, Goettingen,
Germany). From the filtrate 1 ml was diluted to 100.0 ml with mobile phase.
· Chromatographic
conditions
Flow rate : 1.5 ml/min
Detection wavelength : 243 nm
Injection volume : 20 ul
Temperature : Room
temperature
· Calibration curve
A calibration curve (peak area vs. concentration) y = 94199
(1687) x - 16441 (2852) with a correlation coefficient (R2) of
0.9998 (0.0002) (n = 3) was constructed using standard solutions from 4 to 40
mg/l.
The precision of the method was determined by calculating the
relative standard deviation (within a day and within three days) of the peak
area responses after repeated injections (n =3) of a paracetamol standard
solution (20 mg/l).
· Procedure
Equal volumes of standard and assay preparations were
separately injected, the chromatograms were recorded, and the major peak
integrated.
The drug quantity, Q, (in mg of paracetamol in the portion of
tablets taken) were calculated by the formula:
Q = 10.000C( ru/rs)
Whereby C is the concentration (mg/l) of the standard
preparation, ru and rs are the paracetamol peak responses
obtained from the assay preparation and the standard preparation,
respectively.
· Stability testing
A part of the tablets was stored in a sealed box above a
saturated solution of sodium chloride (RH 75 5 %). This box was placed in an
incubator maintained at 40 2°C. After 3 and 6 months, tablets were
withdrawn from the incubator and evaluated for dissolution rate and their
content in active ingredient.
5.2.2 Results
The RSD was 0.78 % within a day and 1.56% within three days,
which complies with the USP 24 requirements (RSD should be less than 2%).
The results of the drug content (Table 5.1) show that the
S&R formulation did not comply with the USP 24 specifications for
paracetamol content (90% - 110% of the labelled amount) after 6 months of
storage under simulated tropical conditions (40°C and 75 % RH).
Table 5.1: The paracetamol content (expressed
as percentage of the labelled amount) before and after 6 months of storage at
40°C and 75 % RH.
Manufacturer
% of the labelled amount per tablet
0 months 6 months
Regal Pharmaceuticals (Cetamol) 95.6
92.5
Smith Kline Beecham (Panadol) 95.0
93.8
S&R Pharmaceuticals (Saramol) 90.8
87.7
II.5.3 In vitro dissolution
5.3.1 Methods
· Preparation of dissolution
medium
68 g of potassium dihydrogen phosphate was diluted to 10.0 L
with distilled water. The pH was adjusted to 5.8 0.05 using a 0.2 N solution
of sodium hydroxide.
· Calibration curve
Stock solution
200 mg of accurately weighed paracetamol was dissolved in
mobile phase to obtain 100.0 ml. 10 ml from this solution were diluted to 100.0
ml. The resulting solution had a concentration of 200 mg/l. 20 ml of this
solution was diluted to 100.0 ml to give a stock solution with a concentration
of 40 mg/l.
Standard solutions
1, 2, 5, 8 and 10 ml of the stock solution were separately
diluted to 10.0 ml using the dissolution medium to obtain standard solutions
having concentrations of 4, 8, 20, 32 and 40 mg/l, respectively.
A calibration curve (absorbance vs. concentration) y = 0.0633x
+ 0.0294 with a correlation coefficient (R2) of 0.9999 was
constructed.
· Dissolution testing
Dissolution profiles were determined using the USP paddle
method (Method 2). Each of 6 tablets was placed inside a dissolution vessel
filled with 900 ml of dissolution medium maintained at 37 0.5°C and
rotated at a speed of 50 rpm.
At different time intervals (5, 10, 15, 20, 25 and 30 min) 5 ml
filtered samples were manually withdrawn, diluted with dissolution medium
(1:40) and spectrophotometrically analyzed at 243 nm. From the absorbance of
each sample, the drug concentration was calculated by means of the calibration
curve.
5.3.2 Results
Table 5.2 shows the percentage dissolved within 30 minutes of
dissolution testing and Figure 5.1 the different dissolution profiles. Before
stability testing all drugs complied with the USP 24 dissolution requirements
(not less than 80% of the labelled amount should dissolve within 30 minutes).
The amount of drug released after 10 minutes of dissolution test was more than
80% for the Cetamol and Panadol formulations. The Saramol formulation
disintegrated into larger particles compared to the others two formulations.
The accelerated stability testing did not affect the Cetamol and Panadol drug
percentage released. The amount of drug released from Saramol formulation
decreased, however it remained within USP 24 tolerance limits for dissolution
testing.
Table 5.2: Percentage of paracetamol dissolved within 30
minutes of dissolution testing before and after 3 and 6 months of storage at
40°C and 75% RH. USP requirements: more than 80 % released within 60
minutes.
Manufacturer
% of the labelled amount per tablet
0
months 3 months 6 months
Regal Pharmaceuticals (Cetamol) 95.6
94.6 90.4
Smith Kline Beecham (Panadol) 95.0
94.9 93.9
S&R Pharmaceuticals (Saramol) 90.8
90.1 84.3

Figure 5.1: Dissolution profiles of paracetamol formulations
before and after 3 and 6 months of storage at 40°C and 75 % RH.


II.6 Quinine formulations
II.6.1 Material and equipment
Material
· Quinine sulfate 300 mg tablets (Pharmakina, Dem. Rep.
of Congo)
· Quinine sulfate sugar-coated 300 mg tablets (Elys
Chemicals, Kenya)
· Quinine (base) 300 mg tablets (Labophar, Rwanda)
· Quinine sulfate dihydrate 99 % (Acros Organics,
Belgium)
· Methane sulfonic acid (Acros Organics, Belgium)
· Diethylamine (Vel, Belgium)
All chemicals and reagents were at least of analytical
grade.
Equipment
· Incubator: U-60 (Memmert, Analis, Namen,
Belgium)
· Column: Lichrospher 100 RP-C 18 e (5um), 250X4
mm
(Merck-Hitachi, Darmstadt,
Germany)
· Detector: L-7400 UV detector (Merck-Hitachi,
Darmstadt, Germany)
· Pump: L-7100 pump (Merck-Hitachi,
Darmstadt, Germany)
· Integrator: D-7000 integrator (Merck-Hitachi,
Darmstadt, Germany)
· Software Package `HPLC System Manager'
(Merck-Hitachi, Darmstadt,
Germany)
· Lambda 12 UV/VIS Spectrophotometer
(Perkin Elmer UV/VIS,
Perkin Elmer, Norwalk, USA)
· Dissolution equipment (VK 7000, Vankel Technology,
Cary, NC, USA)
II.6.2 Quantitative drug analysis
6.2.1 Methods
The amount of quinine and the dissolution rate for each
formulation was determined using the method described in USP 24 monogrphs.
· Mobile phase
The mobile phase consisted of a filtered and degassed mixture
of water, acetonitrile, methane sulfonic acid, and diethylamine solution
(860:100:20:20). The pH was adjusted to 2.6 with a diethylamine solution .
The methanesulfonic acid solution was prepared as follows: 35
ml of methanesulfonic acid was added to 20 ml of glacial acetic acid and the
mixture was diluted to 500.0 ml with distilled water.
Diethylamine solution: 10 ml of diethylamine was diluted to
100.0 ml with distilled water.
· Standard preparation
20 mg of quinine sulfate, accurately weighed, was transferred
to a 100 ml volumetric flask, dissolved and diluted to volume with mobile
phase. The resulting solution was used as standard preparation.
· Assay preparation
From each formulation 10 tablets were weighed and finely
powdered.
An accurately weighed portion of powder, equivalent to about
160 mg of quinine sulfate, was dissolved in about 80 ml of methanol and
mechanically shaken for about 30 minutes, then diluted to 100 ml. The mixture
was filtered through a 0.2 um cellulose acetate filter (Sartorius, Goettingen,
Germany). The first 10 ml were discarded. 3 ml of the filtrate was diluted to
25 ml with mobile phase to obtain an assay preparation with concentration of
192 mg/l.
· Chromatographic
conditions
Flow rate : 1 ml/min
Detection wavelength : 235 nm
Injection volume : 20 ul
Temperature : Room
temperature
· Calibration curve
A calibration curve (peak area vs. concentration) y = 38643219
(5716) x + 78532 (2321) with a correlation coefficient (R2) of
0.9997 (0.0000) (n = 3) was constructed using standard solutions from 0.1 to
1.0 g/l.
The precision of the method was determined by calculating the
relative standard deviation (within a day and within three days) of the peak
area responses after repeated injections (n =3) of a quinine sulfate standard
solution (200 mg/l).
· Procedure
Equal volumes of standard and assay preparations were
separately injected, the chromatograms were recorded and the major peaks
integrated. The drug quantity, Q, (in mg of the sum of quinine sulfate and
dihydroquinine sulfate in the portion of tablets taken) was calculated by the
formula:
Q = (2500/3)C (r b, u +r d, u)/( r b,
s +r d, s)
In which C is the concentration, in mg/ml, of quinine sulfate
in the standard preparation, r b, u and r b, s are the
peak responses of quinine obtained from the assay preparation and the standard
preparation, respectively, rd, u and r d, s are the peak
responses of dihydroquinine obtained from the assay and the standard
preparation, respectively.
· Stability testing
A part of the tablets was stored in a sealed box above a
saturated solution of sodium chloride (RH 75 5 %). This box was placed in an
incubator maintained at 40 2°C. After 3 and 6 months, tablets were
withdrawn from the incubator and evaluated for dissolution rate and their
content of active ingredient.
6.2.2 Results
The RSD was 0.65 % within a day and 1.67% within three days,
which complies with the USP 24 requirements (RSD should be less than 2%).
The results of the drug content (Table 6.1) show that all
formulations complied with the USP 24 specifications for quinine sulfate
content: 90% - 110% of the labelled amount of quinine sulfate. Whereas the
content of the Labophar tablets was just above the lower limit of the required
interval before stability testing, it failed after six months of storage at
40° C and 75% RH.
Table 6.1: The quinine content (expressed as
percentage of the labelled amount) before and after 6 months of storage at
40°C and 75 % RH.
Manufacturer
% of the labelled amount per tablet
0 months 6 months
Elys Chemicals
105.0 98.1
Labophar
90.2 86.4
Pharmakina
97.0 94.6
II.6.3. In vitro dissolution
6.3.1 Methods
· Preparation of dissolution
medium
98.64 ml of 37% hydrochloric acid was diluted to 10.0 L with
distilled water. The resulting 0.1N hydrochloric acid solution was used as
dissolution medium.
· Calibration curve
Stock solution
40 mg of quinine sulfate was accurately weighed and
transferred to a 25 ml volumetric flask and dissolved to volume using the
dissolution medium. 1 ml from the above solution was diluted to 100.0 ml to
give a stock solution with a concentration of 16 mg/l.
Standard solutions
4, 8, 10, 16 and 20 ml from the stock solution were separately
diluted to 20.0 ml to give standard solutions with concentrations of 3.2, 6.4,
8.0, 12.8 and 16.0 mg/l.
A calibration curve (absorbance vs. concentration) y = 0.0925x
+ 0.0053 with a correlation coefficient (R2) of 0.9999 was
constructed.
· Dissolution testing
Dissolution profiles were determined using the USP basket
method (Method 1). Each of 6 tablets was added to a basket connected to a
stirring shaft which was placed inside a dissolution vessel filled with 900ml
of dissolution medium maintained at 37 0.5°C. The rotation speed was 100
rpm. At 10, 20, 30, 35, 40 and 45 min 5 ml samples were withdrawn, filtered,
diluted (1:40) and spectrophotometrically analyzed at 248 nm.
6.3.2 Results
Table 6.2 shows the percentage dissolved within 45 minutes of
dissolution testing and Figure 6.1 the different dissolution profiles. Before
stability testing all drugs complied with the USP 24 dissolution requirements
(not less than 75% of the labelled amount should dissolve within 45 minutes).
The amount of drug released after 45 minutes of dissolution test was more than
80% for all formulations. The Elys formulation was affected by stability test
conditions, the drug percentage released decreased from 103.2% to 41.8% after 6
months. For the others, the drug released remained within USP 24 tolerance
limits for dissolution testing.
Table 6.2: Percentage of quinine dissolved within 30 minutes
of dissolution testing before and after 3 and 6 months of storage at 40°C
and 75% RH. USP requirements: more than 75 % released within 45 minutes.
Manufacturer
% of the labelled amount per tablet
0 months 3months 6 months
Elys Chemicals 103.2
69.6 41.8
Labophar
88.2 85.6 85.0
Pharmakina
96.1 94.0 92.7

Figure 6.1 Quinine dissolution profiles before, after 3 and 6
months of storage at 40°C and 75 % RH.


II.7 Sulfadoxine & Pyrimethamine formulations
II.7.1 Material and equipment
Material
· Orodar® 525 mg tablets (sulfadoxine
500mg / pyrimethamine 25mg)
(Elys chemicals Industries, Kenya)
· Sulfadoxine 500mg / pyrimethamine 25mg (Labophar,
Rwanda)
· Sulfadoxine (Indis, Belgium)
· Pyrimethamine (Sigma-Aldrich Chemie, Germany)
· Potassium dihydrogen phosphate (Vel, Belgium)
· Phenacetin (Sigma-Alidrich Chemie, Germany)
· Acetonitrile (Biosolve, The Netherlands)
· Glacial acetic acid (Merck Eurolab)
· Perchloric acid (UCB, Belgium)
All chemicals and reagents were at least of analytical
grade.
Equipment
· Incubator: U-60 (Memmert, Analis, Namen,
Belgium)
· Column: Lichrospher 100 RP-C 18 e (5um), 250X4
mm
(Merck-Hitachi, Darmstadt,
Germany)
· Detector: L-7400 UV detector (Merck-Hitachi,
Darmstadt, Germany)
· Pump: L-7100 pump (Merck-Hitachi,
Darmstadt, Germany)
· Integrator: D-7000 integrator (Merck-Hitachi,
Darmstadt, Germany)
· Software Package `HPLC System Manager'(Merck-Hitachi,
Darmstadt)
· Lambda 12 UV/VIS Spectrophotometer
(Perkin Elmer UV/VIS,
Perkin Elmer, Norwalk, USA)
· Dissolution equipment (VK 7000, Vankel Technology,
Cary, NC, USA)
II.7.2 Quantitative drug analysis
7.2.1 Methods
The amount of sulfadoxine and pyrimethamine and the
dissolution rate for each formulation was determined using the methods
described in USP 24.
· Mobile phase
A mixture of glacial acetic acid and water was made at the
ratio of (1:50). 1200 ml from the above solution was mixed with 800ml of
acetonitrile, and then 8ml of perchloric acid was added. The homogenized
mixture was used as mobile phase.
· Internal standard:
120 mg of phenacetin was dissolved and diluted to 100.0 ml. 10
ml of that solution was diluted to 100.0 ml to obtain an internal solution
having a concentration of 120 mg/l.
· Stock solution
550mg of sulfadoxine and 27 mg of pyrimethamine were
separately weighed and dissolved in 35 ml of acetonitrile, mobile phase was
added to 100.0 ml. 10 ml from the above solutions was diluted to 100.0 ml to
obtain stock solution with concentrations of 550 mg/l for sulfadoxine and 27
mg/l for pyrimethamine, respectively.
Standard solutions
1, 2, 3, 5 and 6 ml from the stock solution were separately
transferred into different flasks, 1 ml of internal standard was added, after
which the solutions were diluted to 10.0 ml to obtain standard solutions having
concentrations of 55, 110, 165, 275 and 330 mg/l for sulfadoxine. The
pyrimethamine concentrations were 2.7, 5.4, 8.1, 13.5 and 16.2 mg/l.The
internal concentration was always 12 mg/l of phenacetin.
· Sample preparation
From each formulation 10 tablets were weighed and powdered. An
accurately weighed portion of powder, equivalent to 550 mg of sulfadoxine and
27 mg of pyrimethamine, was dissolved in 35 ml acetonitrile. The mixture was
sonicated for about 25 minutes, diluted with mobile phase to 100.0 ml. The
mixture was then filtered through a 0.2-um cellulose acetate filter (Sartorius,
Goettingen, Germany).
From the filtrate 5 ml was transferred to a 100.0 ml flask, 1
ml of phenacetin solution (internal standard) was added and the volume was
adjusted with mobile phase to make the assay preparation.
· Calibration curve
For sulfadoxine, a calibration curve (peak area of the
sulfadoxine/phenacetin ratios vs. concentration) y = 0.0427 (0.0000) x + 0.2276
(0.0133) with a correlation coefficient (R2) of 0.9999 (0.0000) (n =
5) was constructed using standard solutions from 55 to 330 mg sulfadoxine /
l.
For pyrimethamine, y = 0.0433 (0.0000) x - 0.0197 (0.0007)
with a correlation coefficient (R2) of 0.9999 (0.0001) (n = 5) was
constructed using standard solutions from 2.7 to 24.3 mg pyrimethamine / l.
The precision of the method was determined by calculating the
relative standard deviation (RSD) of the peak area responses after repeated
injections (n =5) of a sulfadoxine/pyrimethamine standard solution (275 and
13.5 mg/l, respectively) a day and within three days.
The resolution factors between sulfadoxine and phenacetin(R)
and between phenacetin and pyrimethamine (R') were calculated from their
respective peaks:
R= 2 (t2 - t1) / (w1 +
w2)
With t1 and w1 being the retention time
and baseline width of the sulfadoxine peak, t2 and w2,
the respective values of phenacetin.
R' = 2 (t3 - t2 ) /
(w2+ w3 )
With t2 and w2 being the retention time
and baseline width of the phenacetin peak, t3 and w3 ,
the respective values pyrimethamine.
· Chromatographic
conditions
Flow rate : 1.4 ml/min
Detection wavelength : 254 nm
Injection volume : 20 ul
Temperature : Room
temperature
· Procedure
Equal volumes of standard and assay preparations were
separately injected, the chromatograms were recorded and the major peaks
integrated. The drug quantity, Q, (in mg, of sulfadoxine in the portion of
tablets taken was calculated by the following formula:
Q = 12.5 C (r u / r
s)
In which C is the concentration, in mg/l, of sulfadoxine in
the standard preparation, ru and rs the peak responses
obtained from the assay preparation and the standard preparation, respectively.
The drug quantity, Q, (in mg, of pyrimethamine in the portion
of tablets taken was calculated by the following formula:
Q = 0.2 C' (r' u / r'
s)
In which C is the concentration, in mg/l, of pyrimethamine in
the standard preparation, r'u and r's the peak responses
obtained form the assay preparation and the standard preparation,
respectively.
· Stability testing
A part of the tablets was stored in a sealed box containing a
saturated solution of sodium chloride (RH 75% 5 %). The box was placed in an
incubator maintained at 40°C 2°C. After 3 and 6 months, tablets were
withdrawn from the incubator and evaluated for dissolution rate and their
content in active ingredient.
7.2.2 Results
The RSD was 0.68 % within a day and 1.57 % within three days,
which complies with the USP 24 requirements (RSD should be less than 2.5 %).
The resolution between sulfadoxine and phenacetin and between pyrimethamine and
phenacetin was 2.3 and 1.9, respectively, which means that those three
compounds were well separated.
The sulfadoxine and pyrimethamine contents for each
formulation (Table 7.1) were within the USP 24 requirements (90 - 110 % of the
labelled amount of both sulfadoxine and pyrimethamine). The stability test
conditions did not affect the formulations because the drug content did not
show significant change.
Table 7.1 The sulfadoxine and pyrimethamine
content (expressed as percentage of the labelled amount) before and after 6
months of storage at 40°C and 75 % RH.
Manufacturer %
of the labelled amount per tablet
0
months 6 months
Sulfadoxine
Elys Chemicals (Orodar) 105.3
103.4
Labophar 100.0
98.9
Pyrimethamine
Elys Chemicals (Orodar) 105.5
101.5
Labophar 90.9
90.3
II.7.3 In vitro dissolution
7.3.1 Methods
· Preparation of dissolution
medium
68 g of monobasic potassium phosphate was accurately weighed
and dissolved in about 9 L of distilled water. The pH was adjusted to 6.8 using
a 2 N sodium hydroxide solution and distilled water was added to 10.0 L.
· Calibration curves of sulfadoxine and
Pyrimethamine
Using the HPLC method, the calibration curves mentioned in
quantitative drug analysis were used for calculation of the amount of drug
released. The same mobile phase, the same standard solutions and the same
concentrations were used.
· Dissolution testing
Dissolution profiles were determined using the USP paddle
method (Method 2). Each of 6 tablets was placed inside a dissolution vessel
filled with 900ml of dissolution medium maintained at 370.5°C and stirred
by paddles rotated at 75 rpm. At 5, 10, 15, 20, 25 and 30 min 5 ml samples were
withdrawn, filtered, diluted 3 times and analyzed for their contents of
sulfadoxine and pyrimethamine by UV at 254 nm after chromatographic
separation.
Procedure
20 ul of each of the collected samples was injected onto the
HPLC system and corresponding peak areas were recorded.
The content of each sample was calculated based on the
calibration curves.
7.3.2 Results
Table 7.2 shows the percentage drug dissolved and Figures 7.1
and 7.2 the dissolution profiles of the different formulations analyzed.
Before stability testing, all formulations complied with the
USP 24 requirements for sulfadoxine: not less than 60% of the sulfadoxine and
pyrimethamine labelled amount should dissolve within 30 minutes. For
pyrimethamine, the Labophar formulation failed (only 18 % was released within
30 minutes). Tablets from Labophar took about 10 minutes to disintegrate which
delayed the dissolution.
Upon stability testing (storage at 40°C, 75 % RH), the
Elys formulation (Orodar) remained within the USP 24 requirements for in vitro
drug release. The tablets from Labophar did not disintegrate completely within
the interval time.
Table 7.2 Percentage of sulfadoxine and
pyrimethamine dissolved within 30 minutes of dissolution testing before and
after 3 and 6 months of storage at 40°C and 75% RH. USP requirements: more
than 60 % released within 30 minutes.
Manufacturer
% of the labelled amount per tablet
0
months 3 months 6 months
Sulfadoxine
Elys Chemicals (Orodar) 100.0
97.7 97.0
Labophar 90.7
67.6 44.4
Pyrimethamine
Elys Chemicals (Orodar) 90.4
79.2 78.0
Labophar 17.8
11.9 4.9
Figure 7.1 Dissolution profiles of sulfadoxine before and
after 3 and 6 months of storage at 40° C and 75 % RH.


Figure 7.2 Dissolution profiles of pyrimethamine before and
after 3 and 6 months of storage at 40° C and 75 % RH.
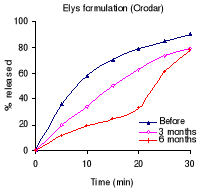

III. Discussion
The assay results on the drug content showed that there are
some substandard drugs on Rwandan market. Before stability testing 1
acetylsalicylic acid was found substandard. After stability testing, 1
acetylsalicylic acid more, 1 cotrimoxazole, 1 paracetamol, 1 quinine were found
substandard. In total about 23.8 % (5/21) of the sampled drugs were found
substandard.
This result is similar to those obtained by Shakoor et al.
(1997) on pharmaceuticals from Nigerian and Thai markets and to those obtained
by Kibwage et al. (1992) on drugs from the Kenyan market, except that no fake
drug was found in this study.
Among those that passed the drug content test, 1
acetylsalicylic acid, 2 cotrimoxazole, 1 sulfadoxine / pyrimethamine failed the
initial dissolution test. After stability testing, 2 acetylsalicylic acid, 1
metronidazole and 1 quinine failed the dissolution test. In total about 38 %
(8/21) of the sampled drugs failed the dissolution test. The findings are
similar to those obtained by Risha et al. (2002) on the in vitro evaluation of
the quality of essential drugs on the Tanzanian market, where 29% of the
samples that passed the assay test, failed the initial dissolution test.
Dramatic changes in the dissolution behaviour of some
formulations have been observed after storage at high temperature and high
relative humidity. However it was not possible to determine the exact cause of
the failure, as the composition of the formulation was not known.
These failures can not be attributed to a single manufacturer
and it was observed that different drug formulations from the same manufacturer
had different characteristics for drug content as well as for dissolution rate:
acetylsalicylic acid tablets from S&R Pharmaceuticals did not disintegrate,
while paracetamol tablets released more than 80% within 10 minutes.
Cotrimoxazole tablets from Labophar failed the dissolution requirements for
sulfamethoxazole, while metronidazole and quinine formulations complied with
the pharmacopoeia.
The above observations might be the results of the fact that
the manufacturers do not practice the Good Manufacturing Practices (GMP)
principles. The ingredients used may be of inferior quality or they do not
validate their manufacturing process.
Dissolution stability can be influenced by several factors.
Important among them are the manufacturing process, formulation variables (e.g.
physiochemical properties of the active and inactive ingredients), storage
conditions and packaging.
Any one of the above factors acting alone or in combination
may alter the characteristics of the product. Based on literature data one can
speculate about the possible causes of the changes in dissolution rate seen
after stability testing.
For example the solubility, hygroscopicity and thermal
characteristics of the active component and excipients (including coating
materials) are critical parameters that influence dissolution profiles, hence
its stability. During storage under high humidity conditions, the active drug
may dissolve and recrystallize and in the processes alter the release
characteristics of the tablet. A tablet can absorb moisture, in such
circumstances the original interparticulate bonds formed in the compact will be
replaced by the new bonds, possibly resulting in a tablet having a different
porosity and pore structure and, hence, having a different in vitro release
pattern compared with the original. Some manufacturers such as Labophar and
S&R Pharmaceuticals did not include a desiccant into the packaging
containers, while it is known that desiccants absorb the moisture and reduce
the humidity in the container, thus contribute to the dissolution stability of
the product.
The initial moisture level of the finished product also
impacts the dissolution. The tablets with a higher moisture level are more apt
to change during aging than those prepared from compounds containing low
moisture.
Fillers or diluents in the formulation are usually viewed as
inert excipients. Whereas this is true for the most part, some fillers by their
hygroscopic nature, provide the necessary moisture for reaction to occur and
thereby promote chemical or physical changes in the product. Others act as
adsorbents that interfere with the liberation of the drug from the dosage form
(Murthy et al., 1993).
Specific interactions between the active ingredient and a
component of formulation have been reported to result in slower dissolution
under accelerated storage conditions. When phenylbutazone was prepared by
direct compression with lactose and microcrystalline cellulose as diluents and
the tablets were stored in paper bags at 40°C and 90% RH for 14 weeks, a
significant reduction in the dissolution rates of phenylbutazone was observed.
This was attributed to the reaction between lactose and the drug based on the
appearance of a new endothermic peak at 220°C that was not related to the
melting point of lactose and phenylbutazone, which are 200 and 107°C,
respectively (Murthy et al., 1993).
During dissolution experiments involving immediate release
products, gum-type binders may form a viscous gel barrier in and around the
tablet, thereby inhibiting disintegration of the dosage form and causing
subsequent delay in drug release (Murthy et al., 1993).
The swelling capacity of the disintegrant is an important
property that determines the outcome of the dissolution after storage. For
example maize starch looses its capacity to swell on aging or after exposure to
high humidity and temperature (Risha et al. (2002). Dissolution behavior of
tablets manufactured with this type of starch will decrease progressively with
aging or during accelerated stability testing.
The dissolution rate of Quinine sugar-coated tablets
manufactured by Elys Chemicals (Kenya) decreased dramatically; probably the
cause is the coating material. Several examples cited in literature suggest
that enteric- and sugar-coated products are more sensitive to the effect of
humidity than uncoated products.(Murthy et al., 1993).
IV. Conclusion and recommendations
The in vitro study of the 21 formulations of 7 essential drugs
available on Rwandan market has shown that most formulations meet the USP 24
requirements in term of drug content. Some among them fail to meet dissolution
requirements, others were not able to withstand storage at high temperature and
high humidity.
Based on our findings we recommend:
· A systematic evaluation of essential drug
formulations available on the Rwandan market.
· The registration of each commercially
available drug, documenting its specifications, and most importantly the
verification of these specifications.
· To perform (if possible) an in-vivo study
because the observed changes in the dissolution profiles during storage are not
necessarily indicative of impaired bioavailability.
References
Amidon G.L., Hans Lennernäs, Shah V.P. and Crison R.,
(1995) A theoretical
basis for a biopharmaceutic drug classification: the
correlation of in vitro drug product
dissolution and in vivo bioavailability. Pharm. Research
12 (3), 413-420.
Galia E., Nicolaides E., Hörter D., Löbenberg R.,
Reppas C. and Dressman J.B., (1998)
Evaluation of various dissolution media for predicting in
vivo performance of class I
and II drugs. Pharm. Research 15 (5),
698-704.
Grimm W., (1986) Stability testing in industry for worldwide
marketing.
Drug Dev. Ind. Pharm.12(8&9),
1259-1292.
Grimm W., (1992) Harmonization of guidelines on stability
testing in the E.C., Japan and USA on the move. Eur. J. Parm. Biopharm
38 (4), 154-155.
Grimm W., (1998) Extension of International Conference on
Harmonisation: tripartite
guidelines for stability testing of new drug substances and
products to countries of
zones III and IV. Drug Dev. Ind. Pharm.
24, 313-325.
Kibwage, I.O., Ogeto, J.O., Maitai, C.K., Rutere, G.,
Thuranira, J. and Ochieng, A.,
(1992) The quality work in Daru: observations during
1983-1986.
East Afr. Med. J. 69, 577-580.
Jennifer B., Dressman, Amidon G.L., Reppas C., and Shah V.P.,
(1998)
Dissolution testing as a pronostic tool for oral drug
absorption: Immediate release
dosage forms. Pharm. Research 15 (1),
11-22.
Maddock D.H. (1986) Use of generic medicines and importance of
brand names.
Pharm. J. 30, 228-278.
Matthews B.R., (1999) Regulatory aspects of stability testing
in Europe.
Drug Dev. Ind. Pharm. 25 (7), 831-856.
Murthy K.S. and Ghebre Sellasie I., (1993) Current
perspectives on the dissolution
stability of solid oral dosage forms. J. Pharm. Sci.
82(2), 113-126.
Risha P.G., Danstan S., Amani M., Masuki G., Vergote G.,
Vervaet C., and Remon
J.P., (2002) In vitro evaluation of the quality of essential
drugs on the Tanzanian
market. Trop. Med. Int. Health 7 ( 8),
701-707.
Shah, V.P., Tsong, Y. and Sathe, P., (1998) In vitro
dissolution profile comparison -
statistics and analysis of the similarity factor,
f2. Pharm. Research 15(6), 889-896.
Shakoor O., Taylor R.B. and Berhens R.H., (1997) Assesment of
the incidence of
substandard drugs in developing countries. Trop. Med. Int.
Health 2, 839-845.
Sowunmi A., Salako L.A., Ogunbona F.A. (1994) Bioavailability
of the sulfate and
dihydrchloride salts of quinine. Afr. Med. Sci.
23, 275-278.
Taylor R.B., Shakoor O., Berhens R.H., Evenard M., Low A.,
Wangbookskul J., Reid
R.G. and Kalawole J.A., (2001) Pharmacopoeial quality of
drugs supplied by Nigerian
pharmacies. Lancet 357, 1933-1936.
US Department of Health and Human Services, Center for Drug
Evaluation and
Research (CDER) (1997) Dissolution testing of immediate
release solid oral dosage
forms. Guidance for industry BP 1.
United State Pharmacopoeial Convention, (2000). United State
Pharmacopoeia
24 th edition, 12601 Twibrook
Parkway, Rockville, MD 20852.
Venho, V.M., Palva E.S., Konno K., and Stenfors E. (1987) The
value of comparative
bioavailability studies of marketed drugs in drug control:
an example with
erythromycin stearate. Fin. Exp. Clin. Pharmacol.
9, 445-447.
WHO (1997) General Policy Topic, the danger of conterfeit and
substandard active
pharmaceutical ingredients. Drug Information vol 11,
n° 3.
WHO (2000) The WHO Medicines Strategy Framework for Action in
Essential Drugs
and Medicines 2001-2003. WHO, Geneva
| 

