|
NATIONAL UNIVERSITY OF RWANDA
FACULTY OF ECONOMICS AND MANAGEMENT
DEPARTMENT OF APPLIED STATISTICS
ACADEMIC YEAR 2010
THE ROLE OF SUPPLY AND USE/INPUT OUTPUT TABLES IN THE
PERSPECTIVE ANALYSIS OF ECONOMIC DEVELOPMENT OF RWANDA WITH EXAMPLE
A dissertation submitted for the partial fulfilment of an
award of Bachelor's degree in Applied Statistics by National University of
Rwanda.
By
HABYARIMANA Jean Baptiste
Supervisor: Mr. RURANGA Charles
Huye, September 2010
Declaration
I, HABYARIMANA Jean Baptiste, hereby declare that, the work
presented in this dissertation entitled «THE ROLE OF SUPPLY AND USE /INPUT
OUTPUT TABLES IN THE PERSPECTIVE ANALYSIS OF ECONOMIC DEVELOPMENT OF
RWANDA» is my original work and has never been presented elsewhere for any
academic award.
All consulted references have been systematically presented in
references.
HABYARIMANA Jean Baptiste
Signature: ............................
Date: .................................
Dedication
I dedicate this dissertation to:
God,
Family,
Teachers at all levels,
and
Friends.
Acknowledgement
The success of this research work cannot be solely attributed to
the effort of one person. In fact, there must be combined efforts to make such
exercise a success. It is therefore on this ground that other people deserve my
sincere thanks and gratitude.
I thank in advance the National University of Rwanda and the
Government of Rwanda for having formed me and supported this study.
I extend my sincere gratitude to my director RURANGA Charles for
his help and active role he played towards the success of this work.
Thanks to my family, relatives and friends for their help either
materially or morally, especially to NTAKIRUTIMANA Eric my colleague.
I would like to address my special thanks to anyone who directly
or indirectly contributed to the success of my study.
Table of Contents
Declaration
i
Dedication
ii
Acknowledgement
iii
Table of Contents
iv
List of Tables and Graphics
vi
Tables
vi
Figures
vi
List of Abbreviations
vii
Abstract
viii
Chapter I. INTRODUCTION
1
1.1. General introduction
1
1.2. Background to the study
2
1.3. Problem Statement
3
1.4. Research hypotheses
3
1.5. Objectives of the study
4
1.6. Scope of the study
4
1.7. Justification of the study
4
1.8. Limitation of the study
4
Chapter II: LITERATURE REVIEW
5
2.1. National Accounting in Economic Development.
5
2.1.1. Definition and nature of SNA information for economic
development
6
2.1.2. Supply and Use Tables (SUT)
7
2.1.3. SUT concept, linear model, and GDP derivation
7
2.1.4. The role of SUT in decision making, projection and
planning
8
2.1.5. What SUT can do in developing countries?
9
2.2. Economic Development Concept
9
2.2.1. Introduction
9
2.2.2. Measures related to Economic Development
9
2.2.2.1. Traditional measures of economic development.
9
2.2.2.2. Human Development Index
10
2.2.2.3. Poverty Weighted Index
10
2.2.2.4. Headcount Index
10
2.2.2.5. Human Poverty Index
11
2.2.3. Sustainable development and environment
accounting
11
2.2.4. Three objectives of development
11
2.3. From SUT to economic development
11
2.3.1. System of Economic and Social Accounting Matrix and
Extension (SESAME)
12
2.3.2. Supply and Use table as a SAM building-block
13
2.3.3. SUT model that would help in promoting
economic development progress of Rwanda
13
Chapter III: METHODOLOGICAL APPROACH TO THE STUDY
14
3.1. Methodology
14
3.2. Sources of data
14
3.3. Conceptual framework of the study
15
3.4. Model designing for the purpose of analysis
16
3.3.1. Tables Analysis
16
3.3.2. SUT linear model Analysis
16
3.3.3. Human Development Index Analysis
16
Chapter IV: DATA PRESANTION, ANALYSIS, AND INTERPRETATION
17
4.1. The role of information from SU/ I-O Tables in Economic
Development
17
4.2. Relevance of input-output analysis to policy
19
4.3. System of National Accounts of Rwanda
20
4.4. The role of Supply and Use Tables/Input-output Table in the
perspective analysis of economic development
21
4.4.1. Estimating the quality of life with input-output
table
21
4.4.1.1. The Linkage Technique
21
4.4.1.2. The Activity Specification Technique
21
4.4.1.3. The Dummy Sector Technique
22
4.4.1.4. Applying Techniques to Specific Quality
Indicators
23
4.4.1.4.1. Linkage application
23
4.4.1.4.2. Dummy technique application
24
4.5. The role of Supply and Use tables/Input-Output Table in
economic analysis and prevision, decision taking, and policy making for a
sustained economic development
26
4.5.1. Quality of life, poverty and economic inequality
27
4.5.2. GDP and economic well-being
27
4.5.3. Environment quality and resource depletion
29
4.5.4. Tourism
30
4.5.5. Human Development Index Analysis
30
4.6. Challenges in information provided by Linear Model
32
4.6.1. Use of central equation system for input-output
analysis
35
4.6.2. Use of output function to measure the impact of
increasing or decreasing intensity of Input Coefficients
36
Chapter V: CONCLUSION AND RECOMMENDATIONS
39
5.1. Conclusion
39
5.2. Recommendations
42
REFFERENCES
44
List of Tables and Graphics
Tables
Table 4.1. A Simplified Supply and Use Framework
17
Table 4.2. A Simplified Symmetric Input-Output Table (Product by
Product)
18
Table 4.3. Environmental Indicators
30
Table 4.4. Estimated Simplified Supply and Use Framework in
Billion Frw (in Constant 2006 Prices)
33
Table4. 5. Estimated Simplified Symmetric input-output table
(product by product) in Billion Frw (Constant Price)
34
Table4.6 Input Coefficients
34
Table 4.7. Changes in Input Coefficients
37
Table 4.8. Used Abbreviations
38
Figures
Figure 2.1. National Accounting and Policy Analysis
............................................................5
Figure 2.1. Conceptual
Framework.................................................................15
Figure4.1. Disaggregation of Household
Categories...............................................................5
Figure 4.2. Human Development Index Trend (1980-2005)
31
Figure 4. 3. Evolution of Human Development Index
32
Figure 4.4. Change in Production due to Changes in Input
Coefficients (2007 Basic Years)
37
Figure 1. Appendices: From Supply and Use tables to Input-Output
Tables..........................i
List of Abbreviations
?inv: Changes in
Inventory,
AGE: Applied General
Equilibrium () model
CM: Commercial
Margins
CPC: Central Product
Classification
EDPRS: Economic Development and
Poverty Reduction Strategy
EX: Exports
FC: Final
Consumption,
FCFG: Fixed Capital Formation
Gross,
GDP: Gross Domestic
Product
GFCF: Gross Fixed Capital
formation
GNI: Gross National
Income
HDI: Human Development
Index
HS: Harmonized System
IC: Intermediate
Consumption,
IEA: Integrated Economic
Account
IPAR: Institute of Policy
Analysis and Research - Rwanda
ISIC: International Standard
Industrial Classification
ISNA: International System of
National Accounts
M: Imports
MDGs: Millennium Development
Goals
NAMEA: National Accounting Matrix
include Environmental Accounts
NISR: National Institute of
Statistics of Rwanda
NUR: National University of
Rwanda
P: Production
P RSP: Poverty Reduction
Strategic Paper
SAM: Social Accounting
matrix
SNA: System of National
Account
SP: Subvention on
Products,
SUT/ I-O: Supply and Use Tables/
Input- Output Table
T: Transport
Margins
TP: Tax on Products
UNDP: United Nation Development
Program
Abstract
In this study, the objective was to show the role of supply
and use tables/Input-Output table in economic development of Rwanda in order to
build a coherent model that can be useful for Rwanda's National Accountants in
analyzing possible effects of alternative economic policies over different
segments of the society. As necessary and reliable statistics are difficult to
obtain for compiling a Social Accounting Matrix for Rwanda, this work has
limited to the analysis of SUT, I-O tables, and Satellite Accounts and economic
development of Rwanda.
Assuming that the Input-Output Coefficients as derived from
Input-Output Table remain more or less constant for a certain period of time
(say a couple of years), they may in a meaningful way be used in so called
Input-Output Models or Inter-Sectoral Models, which describe the relationship
between the output of various branches on the one hand and their different
input requirements on the other hand. Such kind of models may play a role in
different types of analysis related to policy preparation and planning in
Rwanda as shown in this research, and Input-Out put approach would be a
powerful too in analyzing and planning process of economic development and
industrial growth in Rwanda.
A consistent and comprehensive usefulness of SUT/IO-T in
Economic Development was reached due to the analysis of Central Equation System
for Input-Output Analysis «Z =
B*(I-A)-1F» and Output Function X = B*
* (I-A)-1y. Furthermore the objective of this study
was to construct relationship between SUT and Economic Development which can be
employed by modellers in construction of relevant models for Rwanda's
economy.
This study showed that much analyses of economic development
of Rwanda need to be based on economy wide basis (e.g. development planning)
and this suggests the need of macro-economic approach. Most macro-models
however are so highly aggregated so that they can perforce assumed degree of
resource mobility which is just not present in Rwanda. The appropriate answer
in the Perspective Analysis of Economic development of Rwanda seems to be
SUT/Input-Output analysis, which is macro in terms of its coverage and get
«micro» in terms of its approach.
Chapter I. INTRODUCTION
1.1. General introduction
The simplest possible economy cannot exist without producing
and consuming, so clearly we need account for these two fundamental activities,
even a very primitive economy, however, needs to set aside some of its current
production for the activity of accumulation. And we must recognize the fact
that virtually no economy can supply all its needs from its own resources, so
we need another account for the activity of foreign trade (V. Bulmer-Thomas,
1982: 2).
At present, the starting point of National Accounts
compilation is often the estimation of an Input-Output Tables or Supply and Use
tables (SUT). Those tables provide an excellent framework for combining the
so-called production approach and expenditure approach to the computation of
Gross Domestic Product (GDP). However, only cursory attention can be paid to
the third approach, the income approach. Expanding such tables in Social
Accounting Matrix (SAM) remedies this short coming of income of various
Institutional Sectors, and by providing a check on these income data through a
comparison with detailed expenditure figures for the same sectors (Steven,
1996: 146).
Again, every individual, each society and every country
strives for establishing a self sustained economic development, and Rwanda does
not make exception to this rule. For a sustained economic development , a
System of Economic and Social Accounting Matrix and Extension (SESAME) and a
National Accounting Matrix include Environmental Accounts (NAMEA) are needed
and are largely dependent on reliable information necessary to depict the past
and the present economic situation, so that future efforts can be assessed. The
supply and use tables (SUT) information, thus, is a key factor decision making
in such effort.
Thus, each country needs adequate information in its efforts
of providing welfare of their members. This idea has been emphasized by Welsch
& Short (1987:5), when they mentioned, «The dynamic and successful
society depends on the ability of each organization to measure and report its
accomplishments, to undergo critical self analysis, and, through sound
decision, to renew itself and grow. In this way, individual and social
objectives are sewed best».
For its economic development, Rwanda needs such information
system that helps in providing reliable information upon which economic
activities and economic decisions can be taken. This information system is
nothing other than information from SUT/I-O Table, SAM, NAMEA and SASEME within
the System of National Accounts.
1.2. Background to the study
The presentation of economic activities in accounts was first
established by William Petty (1676) and Gregory
King (1696). François Quesnay (1758) published
a table of total economy based on economic activities. Therefore, the term
supply and use table is not new. The first Supply and Use Tables known as
Input-Output Presentation or Leontief's Model was invented by Wassili
Leontief. This presentation became very useful in determining
the inter-industrial exchanges, and has been adopted in System of National
Accounts to view economic performance and prevision (Jean-Paul PIROU, 2006:
5).
On the other hand, the roots of SAM go back to the pioneering
work in social accounting by Gregory King in 1681.However modern social
accounting include SASEME and NAMEA which are largely inspired by the work of
Stone in connection with the Cambridge growth model in the 1950s and 60s and
Drud, Grain, and Pyatt (1983, 1986) studied how SAM can be usefully developed
in the development and understanding of model structures and results (Grahan
Pyatt, 1988: 327).
In 1953, United Nation Organization created an International
System of National Accounts (ISNA), which was revised in 1968, and European
Community created the European System Accounts in 1969.
In 1993, for the purposes of economic evolution and economic
information the ISNA was revised, and became System of National Accounts
(SNA93). In 1993 the System of National accounts has been defined with two main
identities which identify the efficiency of circular flow of income and
expenditure in economy (W. Tongeren, Bertha V., 2007: 4-24):
Supply of Goods and Services = Use of Good and Services
P+M+CM+TM+TP-SP = IC+ FC + FCFG + ?inv + EX
Today those two identities are mainly used to understand the
economy of a country during the whole year, and reports on Input-Output Tables
show that Developed Countries have achieved their development through the use
of it.
1.3. Problem Statement
For the last decades, SNA principles, procedures, and
practices have not been well defined and applied in Rwanda ,and SUT has been
largely viewed only as being GDP tool oriented, in addition, the lack of
professional macro-accountants and sufficient information constrains Rwandan
Institution Sectors (Non financial corporations, Financial corporations,
General government, Household, Non-profit institutions serving households and
Rest of the world) to introduce and use macro-accounting information, and to
compile Input-output Tables in the process of economic development. However the
role of SUT and I-O Table in this process has not been considered with
attention, also no formal system of accounting, practices and principles were
adopted to Rwandan situation to help disclose information used in this process.
Furthermore, comprehensive literatures in the field of National Accounting and
Economic Development are few and poor in Rwanda. Still there is a remarkable
problem of recognition of SUT/ I-O Table and their utilization in the process
of Economic Development in Rwanda.
This implies to ask the following questions:
1. Is it possible that development of SUT/I-O Table exerts an
influence on economic development? If yes, how a country like Rwanda can have
an access to this development?
2. Is it necessary to develop SUT/I-O Table in order to attain
economic development? And what are the functions of SUT/I-O Tables in the
perspective analysis of economic development?
1.4. Research hypotheses
This study lies on the following hypotheses:
1. The development of Supply and Use Tables/Input-output Table
has a significant role in the perspective analysis of economic development of
Rwanda.
2. Supply and Use tables/Input-Output Table have significant
role in economic analysis and prevision, decision taking, and policy making for
a sustained economic development of Rwanda.
1.5. Objectives of the study
Specifically, the objectives of this study are:
1. To identify an extended statistical information system for
monitoring and analyzing the interaction between SUT/I-O Tables and Economic
Development in social changes ;
2. To determine the new insight into economic and social
dynamic provided by a comparative analysis of SUT/I-O Table and other different
Satellite Accounts.
3. To identify an empirical presentation of previous themes in
economic development in the case of Rwanda.
1.6. Scope of the study
The scope of the study is limited to the Supply and Use
Table/Input-Output Table in relationship with economic development of Rwanda.
The study focuses on the use of national accounts data as cyclical indicators
and indicators ratios that are used to the maximum extent to analyze not only
the past but also how trends observed in the past can have consequences for the
future while attempting to project economic development.
1.7. Justification of the study
As far as Rwanda is concerned, our references are based only
on the structure of SUT/I-O Table of SNA, and Satellite Accounts and
Sustained Economic Development and a specific emphasis was drown on improvement
of SNA structures procedures and methods that fit the needs, aims, economic
structure and skills of a developing country like Rwanda. And in addition, the
identification of the role of SUT in Economic Development through SNA will help
other researchers and somewhat, Rwandan researchers in National Accounting will
be awoken.
1.8. Limitation of the study
During this study, it was proved that data in System of National
Accounting of Rwanda are limited to a few number of indicators, and available
data are aggregated indicators therefore it was not easy to find major data and
information to estimate STU and IO-T for Rwanda, consequently some assumptions
were adopted in order to estimate hypothetical tables (SUT and IO-T) and to
view their perspective role in the analysis of Economic Development of
Rwanda.
Chapter II: LITERATURE
REVIEW
2.1. National Accounting in
Economic Development.
National accounts and cyclical indicators development for
past, present and future economic development are based mainly on the data
containing in the economic core of the 1993 SNA, which deal with analysis of
production, income, and saving. It includes aggregates SUT data and also
Integrated Economic Account (IEA) data for the mains sectors of the SNA
covering the production, income, and use of income and capital accounts.
The indicators analysis focuses, however on assessing
development in the past, and SNA model within SUT extends this analysis, by
using relation between development and corresponding data in the past as a
means of projecting the development and data to the future, in this, for
socio-economic indicators ,indicators ratios are used as basis for projecting
past development to the future.
Figure 2.3. National Accounting and Policy Analysis
Projection of future development
Selection and compilation of indicators measuring past trends
Macro-account design and compilation
Statistics and statistical development
Policy analysis formulation
c
b
a
d
f
c
g
h
Source: UNITED NATION; 2002; Use of Macro-accounts in policy
analysis; pp 63-64
The above diagram shows how indicators and macro-accounts
could play a central role in statistical development and policy formulation
.The arrows in diagram represent the interaction between the deferent elements.
Thus, policy formulation could be based on the use of indicators measuring past
and present trends [a], and may also take into account future developments that
are based on alternative values of indicators in the future [b]. The use of
indicators in projection is reflected in direct link with the indicators
measuring past trends [c].
In order to define statistical development that would support
policy formulation, links are needed to translate policy formulation into
indicators [d], indicators into the design and compilation of macro-accounts
[e] and macro-accounts into statistical development [f]; the derivation of
values of indicators are represented by reverse links between statistics and
the compilation of Marco-accounts [g], and between the macro-accounts data and
the derivation of indicators values [h]. The diagram shows also the three uses
of indicators in Assessment [a], Compilation [g], and projection [c] interact
with one another.
2.1.1. Definition and nature of
SNA information for economic development
The SNA is a comprehensive, consistent and
flexible set of macroeconomic accounts intended to meet the needs of government
and private sectors analyst, policymakers and decision takers(KAREN Wilson
2004: 1-24).
The SNA provides information not only about economic
activities, but also about the levels of an economy's productive asset and the
wealth of its inhabitants at particular point of time and also includes links
between national economy and the rest of the world (KAREN Wilson 2004:
1-24).
This information is drawn in a comprehensive accounting
framework within which economic data can be compiled and presented in a format
that is designed for purposes of economic analysis. In practice the accounts
are compiled for succession of time periods, thus providing a continuing flow
of information that is indispensable for monitoring, analysis, and evaluation
of the performance of an economy over time (KAREN Wilson 2004: 1-24).
National accounts are estimated by economic activities which
are classified according to the International Standard Industrial
Classification (ISIC) of all activities and this is used alongside the United
National Central Product Classification (CPC) that is linked to the Harmonized
System (HS) used for classifying international trade
All these, are adopted to Rwanda`s development level keeping
their framework as much as possible (KAREN Wilson 2004: 1-24).
2.1.2. Supply and Use Tables (SUT)
The SNA93 recommended that national accounts estimates should
be compiled in a supply and use framework. Such framework enables estimates of
supply to be confronted with the estimates of use. The SUT serves for
statistical and analytical purposes.
They provide a framework for checking the consistency of
statistics on flows of goods and services obtained from quite different kinds
of statistical sources, industrial survey, household expenditure inquiries,
investment surveys, foreign trade statistics and other statistics compiled in
so called Input-Output Table (KAREN Wilson, 2004: 2).
2.1.3. SUT concept, linear model,
and GDP derivation
The SUT proper, include two matrices, that are, an Output
matrix and an Intermediate consumption or Input matrix (O-I) (Hand book of NA,
2002: 65). These two matrix derived directly from differences in detail and
structure of ISIC and CPC and also from the definition of establishment unit
used in classifying industries, as defined in SNA may be linearly modelled for
being merely used in different flied (mathematics, economics, statistics etc)
SUPPLY=USE
P+M+CM+TM+TP-SP = IC + FC + FCFG + ?inv + EX
Because trade and transport margins may be used to estimate
value of output of the trade industry, the identity becomes;
P+M+TP-SP = IC+FC+FCFG+?inv + EX
CM and TM disappear because P now represents the value of the
production of all branches included trade and transport.
Because, a part of resources was absorbed as intermediate
consumption, and for the efficacy of this identity we have to subtract IC from
each part.
P-IC+M+TP-SP = IC- IC + FC + FCFG + ?inv + EX
And is known that;
P-IC = Value Added (VA)
Therefore;
VA+M+TP-SP =FC+FCFG+?inv + EX
The VA is measured on basic price because it is for P .The
summation of VA with TP nets of SP implies that VA at acquisition price equal
to Gross Domestic Product (GDP).
GDP+M = FC + FCFG + ?inv + EX
For the international trade indicator purposes analysis the
identity becomes;
GDP = FC +FCFG + ?inv + EX-M
This final identity is very synthetic identity which describes
operations of goods and services of an economy.
GDP is an important indicator for economic development ,first
is used in (GDP per capital ,Gross National Income (GNI), Gross National
Disposable Income (GNDI) , GDP Deflator (an index for average price level of an
economy's production related to a base year , etc...).Second ,is very used in
combination with other socio-economic indicators to identify economic
development and economic development projection (Human Development Index ,
Headcount Index , Human Poverty Index , Poverty Weighted Index , etc...). But
does not provide consolidated indicators to perform further analysis like SUT
and IO-T.
2.1.4. The role of SUT in decision
making, projection and planning
In order to make SUT information useful, it is better to learn
how to present the right information in the right way at the right time. SUT is
expected to have this quality. Therefore the objectivity of decision making
depends on how in selecting at least one of the alternative actions the degree
of uncertainty surrounding this decision is reduced, and the outcome of this
decision is improved.
While the tradition application of SUT was to provide
historical growth or declines of GDP of an economy, today the trends have been
moving toward emphasizing the economic decision making function because of the
utilization of SUT data for planning and projecting future economic activities
in so-called Social Accounting Matrix (Brody A. & Carter A.P., 1971:
44-60).
2.1.5. What SUT can do in
developing countries?
SUT have over years, been serving the economic systems that
have became increasingly complex. In these complex economic systems, SUT plays
a significant role in providing reliable information upon which economic
activities and decision can be taken of. Again SUT permit policy makers to
design practical development planning from which productive investment is
attained .This enables the passage from stagnation to intensive development. A
long this process of intensive development, SUT information can lead to
decision not only about production but also the efficient utilization of scarce
resources of the society (Bulmer-Thomas V., 1982: 256-278)
As most of developing countries suffer from a lack of
information for stating the annual GDP, for computing other different
indicators, SUT may fill this gap as a synthetic and very easy model to use for
planning, programming, budgeting and financing economic development activities.
This research proposes that, this highlight function of SUT could also be
applicable to Rwanda. So why, this study will pay attention on its role as an
answer to economic development of Rwanda (Bulmer-Thomas V., 1982: 256-278).
2.2. Economic Development
Concept
2.2.1. Introduction
The economic development is one of the oldest concept, most
exciting, and most challenging branches of the broader fields of economics and
political economy. Although one could claim that Adam Smith was the first
«development economist» and that his Wealth of Nations, published in
1776, was the first treatise on Economic Development.
2.2.2. Measures related to
Economic Development
2.2.2.1. Traditional measures of
economic development.
In strictly economic terms, development has traditionally
meant the capacity of a national economy, whose initial economic condition has
been more or less static for a long time, to generate and sustain an annual
increase in its national income at rate of 5% to 7% or more (Todaro & Smith
2006).
The World Bank use per capita income to view development of
countries (Low Income Countries are those having a per capital gross national
income in 2003 of $765 or less, Rwanda falls in this group with $300 per capita
income; Lower Middle Income countries have income between $766 and $3,035;
Upper Middle Income countries have income between $3.036 and $9,385; and High
Income Countries have a per capita income of $9,386 or more) (Todaro &
Smith 2006).
2.2.2.2. Human Development
Index
The most ambitious attempt to analyze the comparative status
of socio-economic development has been undertaken by the United Nation
Development Program (UNDP) in its annual report `Human Development
Reports' in 1990 with Human Development Index which attempts to rank all
countries in scale of 0(lowest Human Development) to
1(highest Human Development) based on three goals or ends
products of development (Todaro & Smith 2006):
o Longevity; as measured by life expectancy at birth.
o Knowledge as measured by a weighted average of adult
literacy (2/3) and mean year of schooling (1/3).
o Standard of living as measured by real per capita income.
Therefore;
HDI = 1/3(income index) +1/3(life expectancy
index) +1/3(education index)
2.2.2.3. Poverty Weighted Index
Is a welfare index in which income gains for lower income
groups are given greater weighted than gains for upper income groups (Todaro
& Smith 2006;824).
2.2.2.4. Headcount Index
This index measures the proportion of a country's population
below the poverty line.
Absolute poverty may be measured by the number or
«head-count H» of those whose incomes fall below the absolute poverty
line «Y», when the head count is taken as a fraction of the total
population «N» we define the headcount index as H/N ( Todaro &
Smith 2006;815)
2.2.2.5. Human Poverty Index
Is an index measuring deprivation in basic human development
in a country? Variables used are percentage of people expected to die before
age 40, adult literacy rate, percentage of people without access to health
services and safe water, and percentage of under weighted children 5 years of
age ( Todaro & Smith 2006).
2.2.3. Sustainable development and
environment accounting
Environmentalists use the term sustainability to characterize
the desired balance between economic growth and environment preservation.
Sustainability generally refers «meeting the needs of the present
generation without compromising the needs of the future generation»(Todaro
& Smith 2006; 471).Therefore, it is important that development policy maker
incorporate some form of environmental accounting into their decision. Thus
policy maker may set a goal of no net loss of environmental assets
2.2.4. Three objectives of
development
Through some combination of social, economic, and
institutional processes, a society secures the means for obtaining a better
life. Whatever the specific components of this better life, development in all
societies must have at least the following three objectives (Todaro & Smith
2006; 22);
o To increase the availability and widen the distribution of
basic life-sustaining.
o To increase the level of living (income, jobs, education,
culture and values).
o To expend the range of economic and social choices available
to individuals and nations by freeing them from servitude and dependence.
2.3. From SUT to economic development
Economic activities have strong impact on the environment, and
vice-versa. However until recently, environmentally related data have been
given little attention in National accounting system .As Bartelmus at al.
(1993) pointed out, the SNA fails; consider (a) new scarcities of natural
resources that could threaten the sustained production of the economy and (b)
the degradation of environmental quality caused mainly by pollution and its
effects on human health and welfare.
To overcome these short coming ,the United Nations begin to
revise the SNA in 1993.The revised version contains special satellite accounts
for the environment as supplement to the central system (United Nations 1993
a.b).In addition to the UN's effort in revising the SNA , a few other studies
on integrating environmental accounts with economic accounts have been seen in
the literature .For the SAM in particular, studies on incorporating pollution
emission and environmental impacts in a SAM framework emerged recently.
Keuning (1993) proposed a extended SAM called the National
Accounting Matrix including Environment Accounts (NAMEA) .The NAMEA integrates
economic accounts with accounts for pollutants and environmental impacts. In
the NAMEA economic flows in monetary terms and pollution effects in physical
terms are combined into a single information framework .Pollution emissions
from production, consumption, storage, imports and exports (SUT's variables)
are presented in emission account and further allocated into a set of
environmental themes (Keuning 1998: 438-439).
2.3.1. System of Economic and
Social Accounting Matrix and Extension (SESAME)
SESAME is statistical information in matrix
format from which a set of core economic, environmental and social
macro-indicators is derived (Steven 1996; 2). SESAMEs
macro-indicators can be seen as tips of a big iceberg. The general
public, the media and busy policy makers are and will be satisfied with a
picture in which only these tips emerge.
In this, SESAME serves as a useful extension of present day
national accounts, in two aspects. First, the SAM
«a Social Accounting Matrix
(SAM) is a matrix presentation of a sequence of monetary
accounts that each shows a certain economic process and its relation to other
economic process (Steven 1996; 9)»- part of a SESAME improves the
compilation of national accounts because it integrates more basic sources at
meso-level. Secondly SESAME is apt to integrate all kinds of social and
environmental statistics (Steven 1996; 145).
2.3.2. Supply and Use table as a
SAM building-block
In analogy with the inverse of Input-Output Table or Supply
and Use Table, the inverse of endogenous part of a SAM provides a framework for
a single, linear model .However a SAM-based inverse enables a more complete
analysis of employment multipliers, of exogenous changes in government
expenditure and foreign trade (Steven 1996; 151).
Therefore from, a simple, linear model SAM is embedded into a
so-called Applied General Equilibrium (AGE) model. These economic-wide models
take account of price-quantity interrelation. They apply micro-economic insight
and income distribution of a range of policies, from trade liberalization
measures to tax rate changes and structural adjustment packages.
2.3.3. SUT model that
would help in promoting economic development progress of Rwanda
SUT is used as a simplified description that captures the
essential elements of an economy and allows analyzing them in a logical way.
Professionals' National accountants depend on economic data. To understand
economic development and to be able to give useful advice to policymakers
macro-accounts simply must have up-to-date and accurate data.
In the broadest form, SUT development encompasses the
development of SUT standards, SUT procedures and practices, development of SUT
legislation, development of SUT professionals and the development of SUT code
of ethics that govern the SUT professionals.
This development has an important influence on the preparation
of accounting information needed by different Policymakers and Decision takers
to enhance economic development within individual entities (micro-level) and
within aggregate entities (macro-level) and more further political leaders and
policymakers also need economic data to help them in their decision and
planning.
Chapter III: METHODOLOGICAL APPROACH TO THE STUDY
It is primary intended to make a description and an analysis
study of the role of SUT/I-O Table in the perspective analysis of economic
development of Rwanda .For this reason, it bears an exploratory aspect,
especially because there has not been a similar study before. The exploratory
aspect of this study is understood in the context of a description that was
made in order to study the application and applicability of SUT/I-O Table in
the process of economic development of Rwanda. This description was adopted
because without it, it cannot be possible to make an analysis of the role of
SUT in Economic Development. Then, the analysis helps the researcher to couple
the results found regarding the use of SUT information with the need to
implement an SNA framework that facilitates a sustained economic development
process.
3.1. Methodology
The methodology comprises an intellectual process, an orderly
system of arrangement that enables one to reach the aspects of knowledge. It is
a conceptual process that coordinates a set of investigation operations and
techniques. Contemporary English Dictionary (1995; 927) defines methodology as
a set of methods and principles that are used when studying subject or doing a
particular kind of work.
3.2. Sources of data
To reach the objectives of this research, secondary source of
information were used because most required information concerning economic
development is mainly of two categories (Quarterly records and/or annually
records) and due to the constraint of time, Cost, non availability of GDP by
Income Appraoch I was not be able to collect my own data.
In order to collect, organize, and tabulate data a simple form
of tables were used. These tables contain Gross Domestic Product by kind of
activity from 1999 to 2009 at current, constant 2006 prices and the GDP
deflators 2006 base year.
Further more, I gathered also data related to the usefulness
of SUT in economic development and the focus was made on the use of SUT/I-O
Table in decision making and policies making.
3.3. Conceptual framework of the study
Figure 4.1. Conceptual Framework
SUPPLY
· Domestic Output
· Import
ESTIMATING THE QUALITY OF LIFE
· Linkage Technique
· Specification Technique
· Dummy Technique
INPUT-OUTPUT
· Symmetric Input-Output table
MEASURING ECONOMIC DEVELOPMENT
· Gross Domestic per Capita Growth
· Human Development Index
RICH MEASURE OF WELFARE
· Human Development Index
ESTMATING SOCIAL WELFARE
· Gross Domestic Product
· Gross Domestic Product per Capita
· Literacy
· Life Expectancy
=
Human Development Index is a rich measure of
Welfare due to the following reasons:
· The HDI measure a country's average achievement in
basic Human Capabilities, indicating whether its citizens lead long and healthy
lives, are indicated and knowledgeable and enjoy a decent standard of
living.
· Human Development Index is positively correlated with
GDP per Capita.
Gross Domestic Product is a poor measure of
Welfare due to the following reasons:
· GDP increases when some undesirable events occur, GDP
is recorded without netting out the induced environmental impoverishment, and
GDP ignores important dimensions of well-being other than monetary income, such
as life expectancy and literacy (Nicolas C., Vincent K. & Bruno T. 2005, pp
46-50).
USE
· Intermediate Consumption
· Final Consumption
· Gross Capital formation
· Export
![]()
Sources: Brody A. & Carter A.P.,
1971, Input-Output Techniques, Geneva. PP 44-60
Nicolas C,Vincent K, Bruno T, 2005,
Economic Forecasting, London, United Kingdom PP
46-50
Bulmer-Thomas V., 1982, Input-Output
Analysis in Developing Countries, London PP 256-278
3.4. Model designing for the purpose of
analysis
3.3.1. Tables Analysis
Through this study Supply and Use Tables and Input-Output Table
were analyzed in order to highlight their role in Economic development. From a
general view and the usefulness of those tables in Developed and some
Developing Countries, the focus was made on how those tables can be important
in Economic Development of Rwanda.
3.3.2. SUT linear model Analysis
Due to technical reasons that include huge informal and
non-monetary (about 65% of the economy in 2006) and data availability among
others, in Rwanda, National accounts are only compiled using the out-put/
production approach. On other hand as far as the expenditure approach is
concerned, it is only the final household expenditure that can not be measured
on yearly basis.
Along this study SUT linear model was developed in order to
perform the above Analyses. This SUT linear Model was analyzed under Supply and
Use Identity using two possible derivable Linear Models in Rwanda.
3.3.3. Human Development Index Analysis
This analysis show trend of HDI from 1980 to 2010. The HDI
depends on Gross National Income per capita, literacy, and life expectancy.
To the link of Supply and Use Tables, GNI per capita is the
fruit of SUT (GNI=GDP- Transfers), literacy and life expectancy are also
influenced by the GDP. The analysis of HDI will lead to the general conclusion,
because this indicator is a composite indicator includes population impact.
A link from National accounts to satellite accounts was made
using System of National Health Accounts where life expectancy was taken into
account, Education satellite Account where Literacy level was taken into
account and Environment Satellite Account where Tourism and Environment
pollution was taken into account. This analysis used also indicators ranging in
the period of 1980 to 2009, such as Gini coefficient, Human poverty index,
Population in Good Hygienic Conditions and, Urban Population.
Chapter IV: DATA PRESANTION, ANALYSIS, AND INTERPRETATION
4.1. The role of
information from SU/ I-O Tables in Economic Development
Supply and Use Framework is the part of National Accounts
System which focuses on the production in an economy. It reflects the
production of Industries in which Intermediate products and primary inputs
(labor, capital, and land) are required. Supply and Use tables show where goods
and services are produced and where they are used as intermediate consumptions,
final consumption, gross capital formation and export. Supply and Use Framework
provides the most important macroeconomic aggregates such as GDP, Value Added,
Consumption, Investment, Import and export. Supply and Use System is also an
adequate accounting framework for compiling consistent and reliable national
accounts data. Consequently, it is recommended that the compilation of national
accounts data both in current prices as well as in constant prices should be
based on a Supply and Use Framework (Eurostat, 2008: 17-23).
Table 4.1. A Simplified
Supply and Use Framework
|
|
Products
|
Industries
|
Final Uses
|
Total
|
|
Agricult.Products
|
Industrial Products
|
Services
|
Agri-culture
|
Industry
|
Service Activities
|
Final Con- sumption
|
Gross Capital Formation
|
Exports
|
|
Products
|
Agricult. products
|
|
Intermediate Consumption by Product and by
Industry
|
Final Uses by Product and By Category
|
Total Use
|
|
Industrial products
|
|
services
|
|
Industries
|
Agriculture
|
Output Of Industries by Product
|
|
|
Tot. Output
|
|
Industry
|
|
Service Activities
|
|
Value Added
|
|
Value Added
|
|
Tot VA
|
|
Imports
|
Total Imports By Product
|
|
|
Tot M
|
|
Total
|
Total Supply by Product
|
Total Output by Industry
|
Total Final Uses by Category
|
|
Not Applicable
Source: Eurostat, 2008, Eurostat Manual of
Supply, Use and Input-Output Tables, Methodological and Working Paper: 4-23
Supply and Use Framework can be an important tool for Rwanda
as a Developing country which want to redress its Economy towards Development,
because it offer main information for economic planning as they are stated in
the above table.
Supply and use tables serve not only statistical but also
analytical purposes, especially when Supply and Use table are transformed into
Symmetric Input-Output Tables. Compiling input-output tables is an analytical
step. The format of symmetric input-output tables can either be made on the
basis of an industry by industry or product by product classification, but the
following tables describes Product by Product Symmetric input-output table:
Table 4.2. A Simplified
Symmetric Input-Output Table (Product by Product)
|
Products
|
Products
|
Final Uses
|
Total
|
|
Agricult. Products
|
Industrial Products
|
Services
|
Final Con- sumption
|
Gross Capital Formation
|
Exports
|
|
Agricult. products
|
Intermediate Consumption by Product and by
Industry
|
Final Uses by Product and By Category
|
Total Use
|
|
Industrial products
|
|
services
|
|
Value Added
|
Value Added by Component
|
|
|
|
Import
|
Total Imports by Product
|
|
|
Supply
|
Total Supply
|
Total final use By Category
|
Source: Eurostat, 2008, Eurostat Manual of
Supply, Use and Input-Output Tables, Methodological and Working Paper: 4-23.
Input-Output analysis can be used to evaluate the impact of
different policies on macroeconomic variables such as gross domestic product,
employment, consumption, productivity, competitiveness, Unemployment,
Inflation, etc, as well as on the environment.
Moreover, input-output techniques allow quantitative impact
assessment of policy actions either for regional, national or international
levels. With that purpose, the National Institute of Statistics of Rwanda
should develop input-output based models as a tool to support the development
of Rwandan policies towards the Economic development. The latest progress on
the economic recovering in Rwanda shows that Rwanda need integrated data to
plan for its Economic development, and the development of Supply and Use
tables/Input-Output Table can play a significant role in economic analysis and
prevision, decision taking, and policy making for a sustained economic
development of Rwanda.
4.2. Relevance of
input-output analysis to policy
System of Input-Output Tables is a powerful analytical tool
for policy analysis. Mainly through the product-by-product input-output table,
technical coefficients are defined in terms of A = (aij)i,j =
1,...,n (where n is the number of products) and represent the direct
requirements of product i needed to produce a physical unit of product
j in monetary units. This matrix is calculated by dividing each entry
of the IO table by the corresponding column total (output) (José M.
Rueda-Cantuche et al., 2005: 8; Eurostat, 2002: 17-23).
Appropriate extensions of the input-output system allow
evaluating both direct and indirect impacts of economic policies on other
economic variables such as labor, capital, energy uses, emissions and resources
use. Moreover, most of these policy issues have to be analyzed along with
macroeconomic models providing a minimum of industrial break down (Eurostat,
2002: 17-23).
The so-called central equation system for input-output
analysis offers multiple approaches for analysis. Mathematically, this equation
is defined as Z = B(I-A)-1F, where
B is a matrix of input coefficients for a specific
variable (intermediate uses, labor, capital, energy, emissions, etc.),
(I-A)-1 stands for the Leontief inverse,
F represents a diagonal matrix for final demand and
Z a matrix with results for direct and indirect
requirements (intermediates, labor, capital, energy, emissions, etc.).
Basically, this approach would provide quantitative assessment of e.g. total
primary energy requirements or total carbon dioxide emissions for the
manufacturing of a vehicle in all the stages of production. Labor and capital
content of
Products may also be computed (Eurostat, 2002: 17-23).
Particularly on sustainable production and consumption issues,
input-output analysis is crucial for policy assessment. Several prospective
studies of environmental policies can be envisaged using this tool, i.e.
economy-wide implications of technical change in products or processes
(including emission reduction), economy-wide implications of changes in life
style and consumption patterns and economy-wide effects of taxation and of
internalizing external costs. Furthermore, ex-post analysis of the
effectiveness of environmental policies might be addressed either monitoring
eco-efficiency over time (environmental impacts per unit of value added)
(Rueda-Cantuche, J.M., 2007: 2-21).
4.3. System of National Accounts of Rwanda
Due to technical reasons that include huge informal and
non-monetary sectors (about 65% of the economy in 2006) and data availability
among others, in Rwanda National Accounts are only compiled using the
Output/Production approach. On the other hand as far as the expenditure
approach is concerned, it is only the final household expenditure that cannot
be measured on a yearly basis. Hence in this case it can then be calculated by
subtracting as a balancing item from the output approach (Republic of Rwanda,
NISR, 2010: 1-11).
Therefore finally GDP estimates of both the production and
expenditure approaches are computed annually in Rwanda. National Accounts are
estimated by economic activities which are classified according the
International Standard Industrial Classification of all economic activities
(ISIC). This is used alongside the United Nations Central Product
Classification (CPC) that is linked to the Harmonized System (HS) used for
classifying international trade (Republic of Rwanda, NISR, 2010: 1-11).
All these, are adapted to Rwanda's development level keeping
their framework as much as possible. The Industries include:
A.Agriculturea.- Food cropb.- Export cropc.- Livestockd.- Forestrye.-
FisheriesB.- Industrya.- Mining and quarryingb.- Manufacturingc.- Electricity,
gas and waterd.- ConstructionC.- Servicesa.- Whole sale and retail tradeb.-
Hotels and restaurants. Transport, storage and communicationd.- Finance,
insurancee.- Real estate, business servicesf.- Public
administrationg. Educationh.- Healthi.- Other
personal services (trade unions, religious activities, sporting, hair dressing,
domestic services, visiting national parks etc) (Republic of Rwanda, NISR,
2010: 1-11).
In Rwanda, national accounts are estimated on an annual basis
by the National Institute of Statistics of Rwanda and from time to time the
estimation methodology is revised due to reasons that include: improvement in
data sources and systems and changes in the national economic structure.
In this regard the first benchmark of 2001 was done in 2003 and now the
National Institute of Statistics of Rwanda is in the process of rebasing the
benchmark to 2006 (Republic of Rwanda, NISR, 2010: 1-11).
4.4. The role of Supply and Use Tables/Input-output Table in
the perspective analysis of economic development
4.4.1. Estimating the quality
of life with input-output table
The concept of the «Quality of Urban life» is
decomposed into specific measurable indicators of urban quality. Those
indicators are expressed in two kinds of quality of life estimates that can be
made with I-O data given a level and mix of economic activity in the area:
1. How much of the by-product is produced, and by whom?
2. What expenditures are being made, and by whom, to produce
the by-product or, in the case of negative valued by-product, to abate their
production or reduce their current levels?
And they are three different ways in which I-O can be used to
make these estimates:
4.4.1.1. The Linkage Technique
The linkage technique is addressed to the question of how much
of the by-product is being produced, and by whom. It can estimate the quantity
of by-product being produced in their physical or value terms.
In Rwanda, the linkage method for indicators of water, air,
and land, that can incorporate nonlinearities when they are joined with the
usual industry, can be developed.
4.4.1.2. The Activity Specification Technique
The activity specification technique to estimate input-output
sector expenditures directed toward influencing the quality of urban life. Such
expenditures are often used directly as indicators of quality of life, or as
quantitative approximations to the efforts of specific sectors to improve
quality (Brody A. & Carter A.P., 1971: 52).
For example: indicators related to health, recreation,
pollution and accident and crime prevention are the main fields where I-O Table
can be used in Rwanda.
4.4.1.3. The Dummy Sector Technique
In contrast to linkage and activity specification, a dummy
sector analysis allows explicit calculation of expenditures required to achieve
a predetermined «target» level of indicators.
The potential application of these techniques to planning for
regulation, control, abatement, and incidence of indicator production and some
of its short-comings may be stated as follow:
The techniques are relevant to indicators in the natural,
community services, and infrastructural environments. The community services
tend to measure input quality rather than output quality; linearity assumptions
seriously weaken indicators measurements in the infrastructure and natural
environment; many externalities are not included in natural environment
indicators, relative price assumptions weaken the economic environment
indicator measurements; and finally difficulties rise because while many
indicators involve stock concepts, input-output analysis estimates many changes
rather than indicator level (Brody A. & Carter A.P., 1971: 46).
I-O Table is designed primarily to describe the important
relationships among markets and to measure their consequences. When we are
interested in the quality of life in a given area, the regional model is
probably more appropriate (Brody A. & Carter A.P., 1971: 46). Also, there
are issues concerning the type of activities that should be included in the
«structural» part of I-O. At the national level, identifying
household, government, and investment in final demand in Rwanda has generally
proved effective for example.
For urban analyses, however, strong arguments can be made for
including local government, household and investment as part of the endogenous
structure. Additionally, there are questions regarding the kind of sectoring
that are most appropriate for urban input-output tables. A number of sectors in
the usual I-O tables are directly related to the quality of life in the sense
that their «output» measures correspond to specific quality of life
indicators (Brody A. & Carter A.P., 1971: 47). For example, household
incomes and welfare expenditures can readily be translated into indicators of
quality of life in the context of sustained economic development in Rwanda.
Quality of life indicators can be viewed as outcomes or
by-products associated with the production and consumption activities
represented by the inter-industry transactions. Some of these outcomes
represent a social cost, as in the case of pollution. Other outcomes such as
sector-provided or healthcare represent positive contribution to the welfare of
urban residents.
4.4.1.4. Applying Techniques to Specific Quality
Indicators
4.4.1.4.1. Linkage application
The application of the linkage technique to economic
indicators in Rwanda would be considerably enhanced by the disaggregating of
the household sector into income groups. These disaggregated data could then be
used directly by linkage technique. For example, numbers of high, medium, and
low income workers, average and medium income, proportion of workers above some
poverty line can be obtained by using the estimates of the levels of output of
the producing sectors (Agriculture, Industry, and Services) in combination with
the appropriate coefficients showing the type of labours used by each sector.
The appropriate disaggregation of Household for Rwanda seems to be based on
Region and Activity, as stated below:
Households
Rural
Urban
Agricultural
Self-Employed
Non-Agricultural
Self-Employed
Wage-
Earning
Agricultural
Self-Employed
Non-Agricultural
Self-Employed
Wage-
Earning
Applying linkage to community service indicators requires
desegregation of the government sector into specific functional activities.
Indicators can be linked to expenditures on these functional activities:
Examples of this type are: Pupil per teacher, Student by class room, Hospital
and Clinics per unit of population. However, as public service output quality
measurements are improved they can be used in place of the input quality
measurements by linking them to functional expenditures.
Linkage Technique would help Rwanda policymakers and
macro-accountants to disaggregate and to specify labour categories in Rwanda,
the disaggregation may be helpful also when studying the impact of Services
Sector in total economy of Rwanda. Disaggregation of labour categories may be
stated as follow:
1. Unskilled Labour (No-education and primary education)
2. Semi-skilled Labour (Secondary Education and Vocational
Training)
3. Highly Skilled (University Degree)
4.4.1.4.2. Dummy technique application
In Rwanda dummy sector technique can be used for analyses of
land pollution, land degradation, and land use. For the land pollution dummy
sector combines coefficient that measure the amount of solid wastes disposed of
by the using sector into landfills or dumps with coefficients measure the
amount of input used in the land reclaiming or cleaning sector.
To estimate land use, policymakers in Rwanda have to create
two land related sector:
· Space occupied by buildings
· Non building space
With knowledge of the space currently available, the level of
conversion of raw land into sector-usable land in the aggregate and separately
for each producing sector, household, and government can be estimated, given
the final demand specification. Such information can be useful also in showing
the relative amount of land used and available in the provision of housing
services, recreation, commercial enterprises, and transportation facilities.
The linkage technique can allow planers in Rwanda to identify
the producing sector and the kind of final demand sales that significantly
influence the rate of by-product output flow. Such information is relevant
particularly to taxation and regulation policies.
Planers would like to know the expenditure that various
sectors make in seeking to control the by-product flow. Often these
expenditures are not distinguishable from the sectors purchases required for
the sectors goods and services production. The specification technique can
provide some such information and permits calculation of how these expenditures
would change as final demand changes.
Planers would like also to know the feasibility, in terms of
expenditures and resources required, of achieving alternative rates of
by-product output flow; the dummy technique can provide some such information
necessary for Economic Development of Rwanda.
For example by stipulating target levels of allowable
pollution and estimated deliveries to final demand, the dummy technique allows
calculation of the level of resources that must be committed to pollution
suppression activities. Such information is useful particularly for situation
in which the government is seeking to reduce pollution directly to rough its
own programmatic expenditure (Bulmer-Thomas V., 1982: 256-278).
Obviously, Supply and Use framework and Input-Output framework
are not applied in Rwanda due to the lack of information in the following field
even though System of National Accounts is experiencing improvement:
· Intermediate consumption by Product (Agricultural
Products, Industrial Products, Services) and By industry (Agriculture,
Industry, Service).
· Output of Industries (Agriculture, Industry, Service)
by Products (Agricultural Products, Industrial Products, Services).
· Final Uses by Product (Agricultural Products,
Industrial Products, Services) and by Category ( Final Consumption, Gross
capital Formation, exports)
· Import by Products (Agricultural Products, Industrial
Products, Services)
This problem of lack of information constraint the compilation
of Input-Output table from Supply and use Tables in Rwanda in order to perform
the above Techniques.
The first hypothesis «The development of Supply and Use
Tables/Input-output Table has a significant role in the perspective analysis of
economic development of Rwanda» was not verified because those tables are
not applied as such in Rwanda, but if Rwandan Macro-accountants and planer come
on the point of compiling those tables, they will play significant role in the
perspective analysis of economic development of Rwanda as their usefulness have
been stated above. The main root of these problems are technical reasons that
include huge informal and non-monetary sectors (about 65% of the economy in
2006) and data availability among others (Republic of Rwanda, NISR, 2010, GDP
Annual Estimates for 2009 based on 2006 benchmark).
Even though Rwanda is suffering from the lack of information
to compiled Supply and Use Tables and Symmetric Input Output Table, SUT linear
models are applied to provide some macroeconomic indicators such as GDP, Value
Added, Consumption, Investment, Import and export but further analysis from
those figures are not possible because they are totals but not by Industries
(Agriculture, Industry, and Services) and by Products (Agricultural Products,
Industrial Products, Services). Therefore that information is not sufficient as
that provided by SUT.
4.5. The role of Supply and Use tables/Input-Output Table in
economic analysis and prevision, decision taking, and policy making for a
sustained economic development
In addition to the role of Supply and use framework mentioned in
the above part, this framework serves also as a basis for various
interconnections with satellite accounts, such as Social Accounting Matrix
(SAM), Employment Statistics, Linkage with other physical flows related to
Environmental issues ( emission, waste, sewage) and other forms of Satellite
System for tourism, Transport, health and education.
Various Input-Output models as shown above can be used to
evaluate with the new dataset the economic and environmental impacts of
different policies on macroeconomic variables such as employment, GDP,
consumption, investments, competitiveness, etc. and on environmental variables,
such as CO2 emissions and resource consumption. Hence, the IO model
shall provide a powerful tool for assessing economic and environmental impacts
on the policies proposed by the Planners and/ or Policymakers in Rwanda.
The second Hypothesis «Supply and Use tables/Input-Output
Table have significant role in economic analysis and prevision, decision
taking, and policy making for a sustained economic development of Rwanda»
was also not verified because the use of SUT and IO models are not applied as
such in the economic analysis of Rwanda. But basing on the above analysis it
should be better to compile those tables in Rwanda in order to reach a
Sustained Economic Development.
Because those tables are not available in Rwanda the following
analysis was based on SUT linear model which provide a limited number of
macro-economic indicators with limited information, and the focus was made on
GDP as the main aggregate from this linear model and on HDI as rich measurement
of Economic Development derived from three component: GDP per Capital, Life
Expectance, and Literacy.
The following analysis was adopted in the way relating
production and expenditure approaches to compute GDP and other Economic
Indicators towards Economic Development.
4.5.1. Quality of life, poverty and economic inequality
Some desirable features that one may think of are reflected in
GDP: Spacious, well constructed homes, good restaurants and stores, a variety
of entertainment and high quality medical services. However other indicators of
good life are not sold in market so that they may be omitted from GDP.
In Rwanda absolute poverty has been declining. Today many
families whose income is below to days' official line is 57% and own their
health insurance (htt://www.undp.org.rw/Poverty_Reduction.html).
But, even though absolute poverty seems to decrease in Rwanda,
inequality of income has not generally well improved. In contrast, because GDP
focus on total production rather than on the distribution of input in all
sectors or production from those sectors, therefore GDP does not capture the
effects of inequality (htt://www.undp.org.rw/Poverty_Reduction.html).
4.5.2. GDP and economic well-being
Even though, GDP is an imperfect measure of economic
well-being. Among other factors affecting well being omitted by the real GDP
are the availability of leisure time, non-market services such as unpaid
homemaking and volunteer services, environmental quality and resource
conservation, and quality of life indicators such as low crime rate. The GDP
also does not reflect the degree of economic inequality in country; because
real GDP is not the same as economic well-being, therefore proposed policy
should not be evaluated strictly in terms of whether or not they increase the
GDP. But this gap may be fulfilled using SUT and IO-T.
Although the GDP is not the same as economic well-being, it is
positively associated with many things that people value: better homes , better
life, better health, higher life expectancy, higher rate of literacy. This
relationship between real GDP and economic well-being tend to evaluate economic
development of Rwanda and this relationship has led Rwanda to the improvement
of their way of producing, saving and consuming, health and education in search
of better life and has motivated policymakers in Rwanda to try to increase the
rate of economic growth oriented to economic development of Rwanda through out
many strategic policies such as EDPRS, RSSP.
Obviously, as the model of production and expenditure improve
and that the GDP increases, Rwandans are likely to possess more and better
goods and services. On average, like the GDP of Rwanda is increasing, Rwandans
tend to enjoy larger, better constructed, and more comfortable homes, higher
quality food and clothing, a greater variety of entertainment and cultural
opportunities, better access to transportation and travel, better
communications and sanitation, and other advantages.
Through 10 years ago, Rwandans have made tremendous sacrifices
and taken great risks to secure a high standard of living themselves and their
families. In fact this initiative may be better viewed in SUT structure year by
year and improvement of satellite accounts data which their improvement may
ameliorate Rwanda's economic development indicators such as HDI, Life
expectancy, people living in good hygienic conditions.
Beyond an abundance of consumer goods, the increase of GDP
brings other basic advantages. Those advantages include some important
indicators of well-being, including life expectancy, reduce in infant and child
mortality rates, number of doctors, measures of nutrition and education
opportunity, but all those factors may be captured in satellites accounts in
order to perform further analysis with STU and IO-T in SAM «education
account, Health account, Environmental account» and compiled with GDP from
SUT. One may conclude from the list of important factors omitted from the
official figures that GDP is useless as a measure of income welfare. But as
explained above GDP has a closer relationship with Socio-Economic Well-being of
Population.
Clearly, in evaluating the effects a proposed economic policy,
considering only the likely effects on GDP is not sufficient. Planer must also
ask whether the policy will affect aspect of economic well-being that is not
captured in GDP. Environmental regulations may reduce the production of some
products as wood, fish, and pottery for example, consequently decrease of GDP;
but that factor is not sufficient basis on which to decide whether such
regulations are good or bad. The right way to decide on that question is to
apply cost benefit principle. Therefore to promote Economic development, Rwanda
policymakers have to think about how to introduce SUT and IO frameworks in
order to complete necessary information rather than focusing only on the output
from Production and Expenditure Approaches due to its deficiency as a measure
of Economic Development.
4.5.3. Environment quality and resource depletion
Another macroeconomic question concerns the impact or economic
growth on environmental quality. Do high rate of growth that is, increase in
GDP of Rwanda, implies greater environmental degradation or might the opposite
be true? It is to note that «some pollution increases during the early
stages of a country's development and then begins to diminish as country gain
adequate resources to tackle pollution problems». This happen because at
low incomes' people tend to value development over environmental quality, but
as the country achieves greater wealth it willing to devote greater resources
to environmental quality improvements. This is a matter of greater
importance for Rwanda.
Rwanda however, was thought to have fewer environmental
problems because their reindustrialized technology was more environmental
benign, and it had no yet committed itself to a materialistic style of life.
Ideas have changed, however. For one thing, it has become clear that massive
environmental degradation has occurred in Rwanda; rural areas have seen
large-scale soil erosion and water-quality deterioration, deforestation and
declining in soil productivity. But the government of Rwanda is trying to
rehabilitate all those constraints towards sustainable economic
developments.
A number of efforts have been made to incorporate factors like
air quality and resource depletion into a comprehensive measure of GDP. Doing
so has been difficult, since it often involves placing a monetary unit value on
intangibles, like having clean river as it is the policy of Rwanda by
eradicating erosion, planting bamboos at least in 50 m from rives or lakes and
resource conservation are hard to measure even though forests conservations are
being developed by creating Nation Park to promote Tourism in Rwanda.
Table 4.3. Environmental
Indicators
|
Environment
|
|
Threatened species
|
2009
|
53
|
|
Forested area (% of land area)
|
2007
|
21.7
|
|
CO2 emission estimates (000 metric tons and metric tons per
capita)
|
2006
|
795/0.1
|
|
Energy consumption per capita (kilograms oil equivalent)
|
2007
|
19
|
|
Rainfall, total mean (millimetres)
|
|
1028
|
Source: NISR: Statistical Yearbook 2009
Edition: 64-66.
4.5.4. Tourism
The movement of population across national borders is another
mark of integration and development. In Rwanda some of expenditures on tourism
sector are captured by GDP through investment or gross fixed capital formation
induced by private sector or government. And some others are captured in
Tourism satellite accounts.
Receipts from tourisms were 6.5% of export in 20009. The
receipts from tourists has increased the capacity of Rwanda's economy and
improved also the Rwanda's rest of the world account. More further, due to
development of tourism Rwanda's gross saving had increased from 25 billion Frw
in 1999 to reach 404 billion Frw in 2009 (Republic of Rwanda, NISR: Statistical
Yearbook 2009: 64-66).
4.5.5. Human Development Index
Analysis
HDI trend decreased from 1985 to 1994 due to war. This
decrease was explained by the low GDP per capital, decrease in life expectance
and low literacy level, Low investment, Low Export and high Import, Low
productivity in Agricultural sector, and this period was characterized by Gini
coefficient of 28.9 (1980) which shows how the income was highly unequally
distributed among pupation.
HDI has increased from 1995 with the economic rehabilitation
and reorientation, from since economic activities were boosted and the
production begins to increase. These policies caused an increase in GDP per
capita and the recent figures show that GDP per capita was 213.9 current $ in
2000 and 258.8 Current $ in 2005 to reach 458.5 current $ in 2008. The Gini
coefficient increase from 28.9 in 1980 to 46.8 in 2007, with the life
expectance at birth of 51 years in 2009, and in Education data of 2005-2008
show a Primary-Secondary gross enrolment ratio of women and men per 100 of 89.7
and 98.6 respectively. But, even though HDI experienced improvement, Rwanda is
steal classified in Low Developed Countries at Rank 167 in 2006 with HDI lower
than 0.5 (Republic of Rwanda, NISR: Statistical Yearbook 2009: 5-121; Human
Development Report 2009).
Figure 4.2. Human
Development Index Trend (1980-2005)
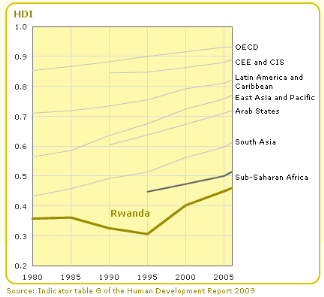
The Urban population growth from 2005 to 2009 was estimated to
4.2% against 2.4% in rural areas. These figures show that many person in Rwanda
are concentrating in town where they are expecting good life (Sanitation and
Hygiene), and due to those factors in 2007, 18% of population of Rwanda lived
in urban areas. And the large wage gap between rural and urban population,
especially for unskilled and semiskilled labour, is the main cause of that
dramatic increase in number of people living in urban areas in Rwanda.
Consequently, this movement has an important contribution in
redressing rural development, because flow of formal transfers from people
living in urban areas back to their rural region of origin has been increased
rapidly and has become the larges source of capital for many rural areas in
Rwanda.
Figure 4.3. Evolution of
Human Development Index
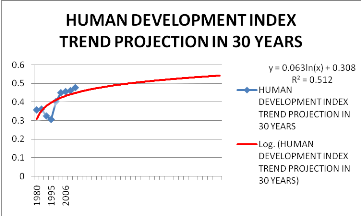
If the HDI in Rwanda continue to
increase as it was increasing last 30 years, the HDI of Rwanda can exceed value
of 0.5 in 30 years beyond the period of the study.
4.6. Challenges in information provided by Linear Model
From the analysis of SUT and IO-T and Linear Model, it is
remarkable that Linear Model does not provide sufficient information necessary
to measure the role of System of National Accounts in the perspective analysis
of economic development of Rwanda. The main challenge encountered by the Linear
Model is the lack of information in Intermediate Consumption by Product and by
Industry. This information is the main intra in the so-called central equation
system for input-output analysis which offers multiple approaches for analysis.
Mathematically, this equation is defined as Z =
B*(I-A)-1F, where B is a
matrix of input coefficients for a specific variable (intermediate uses, labor,
capital, energy, emissions, etc.), (I-A)-1 stands
for the Leontief inverse, F represents a diagonal
matrix for final demand and Z a matrix with results
for direct and indirect requirements (intermediates, labor, capital, energy,
emissions, etc.). Basically, this approach would provide quantitative
assessment (José M. Rueda-Cantuche et al., 2005: 8; Eurostat, 2002).
The following analysis tried to estimate SUT and IO-T for
Rwanda in 2007 basing on the main indicators provided by Linear Model.
Information not provided by Linear Model are highlighted in order to show its
deficiency and to demonstrate that with Linear Model it is not easy to perform
central equation system for input-output analysis. In order to estimate those
tables some assumption had been stated and some Ratios had been fixed in order
to estimate attached indicators:
· The row and column items were computed basing on
percentages of GDP decomposition by sectors [Services 46%, Industry 14%, and
Agriculture 40 (John RWIRAHIRA, 2008: 11)].
· Each Product is produced in its own specific way,
irrespective of the industry where it is produced.
· Each industry has its own specific way of production,
irrespective of its product mix.
· Input in each sector and Production from each sector
were estimated basing on that Intermediate consumption was 122.8 % of GDP and
Production was 212.87% of GDP (AfDB-EIU-UNIDO Infobase-World Bank-Wold Economic
Forum-World Factor Book, 2008: 1-2;
htt://www.docstoc.com/docs/48810565/RWANDA--Kigali)
· The distribution of Intermediate Consumption and
Production was based on percentage of GDP decomposition by Sectors
(Agriculture, Industry, and Services).
Table 4.4. Estimated
Simplified Supply and Use Framework of Rwanda in Billion Frw (in Constant 2006
Prices)
|
|
Products
|
Industries
|
Final Uses
|
Total
|
|
Agricult. Products
|
Industrial Products
|
Services
|
Agri-culture
|
Industry
|
Service Activities
|
Final Con- sumption
|
Gross Capital Formation
|
Exports
|
|
Products
|
Agricult. products
|
|
334
|
117
|
384
|
728
|
138
|
78
|
1778
|
|
Industrial products
|
117
|
41
|
134
|
255
|
48
|
27
|
622
|
|
services
|
384
|
134
|
442
|
837
|
158
|
89
|
2044
|
|
Industries
|
Agriculture
|
630
|
220
|
724
|
|
|
1574
|
|
Industry
|
220
|
77
|
253
|
551
|
|
Service Activities
|
724
|
253
|
833
|
1811
|
|
Value Added
|
|
740
|
259
|
851
|
|
1849
|
|
Imports
|
204
|
71
|
234
|
|
|
509
|
|
Total
|
1778
|
622
|
2045
|
1574
|
551
|
1811
|
1819
|
344
|
194
|
10738
|
The above
Estimated simplified SUT shows the information which are not easily available
in Rwanda, those information are: Input, Production, Final use, Value Added,
and Import Matrices, even though they are available in single element for
example, Import Total is available but import by products is not available,
Export Total is available but Export by Product is not available in clean
forms, Value Added Total is available but Value Added by Industry in not easily
available because they are available in percentages of GDP. Those are the
weakness of not using integrated SUT and IO-T. The part in yellow is not
applicable.
Table4. 5. Estimated
Simplified Symmetric input-output table (product by product) of Rwanda in
Billion Frw (Constant Price)
|
Products
|
Products
|
Final Uses
|
Total
|
|
Agricult. Products
|
Industrial Products
|
Services
|
Final Con- sumption
|
Gross Capital Formation
|
Exports
|
|
Agricult. products
|
334
|
117
|
384
|
728
|
138
|
78
|
1778
|
|
Industrial products
|
117
|
41
|
134
|
255
|
48
|
27
|
622
|
|
services
|
384
|
134
|
442
|
837
|
158
|
89
|
2044
|
|
Value Added
|
740
|
259
|
851
|
|
1849
|
|
Import
|
204
|
71
|
234
|
|
509
|
|
Supply
|
1778
|
622
|
2045
|
1819
|
344
|
194
|
6802
|
From SUT a Simplified Symmetric Input-Output Table was
estimated, the information from this IO-T were used in the estimation of Input
Coefficients in order to perform further analysis related to economic
development, even though the analysis in this study was limited on the use of
Input Coefficients further analysis for economic development may be based on
those table and on the Input Coefficients Matrix through many techniques to
evaluate the quality of life such as: Linkage, Activity Specification, and
Dummy Sector Technique.
Apart from those techniques STU and IO-T are the basic steps
in constructing SAM, because most of the details from those tables are carried
over without modification to SAM, where there are reassembled in Matrix form
(GRAHAM Pyatt, 1999: 365-386), and SAM has an important advantages on analyzing
Economic development of an economy, among them: reduction of risk of confusion,
and it emphases on consistence and the importance of complete articulation,
both of which are the essence in trying to understand feedback systems, in
general, and the interdependence of the distribution of income and the
structure of income, in particular.
Table4.6
Input Coefficients
|
Products
|
Products
|
|
Agricult. Products
|
Industrial Products
|
Services
|
|
Agricult. products
|
0.19
|
0.19
|
0.19
|
|
Industrial products
|
0.07
|
0.07
|
0.07
|
|
services
|
0.22
|
0.22
|
0.22
|
|
Import
|
0.11
|
0.11
|
0.11
|
|
Wages, Salaries etc. + Oper. Srplus
|
0.42
|
0.42
|
0.42
|
|
Supply
|
1
|
1
|
1
|
The Input
Coefficients were computed in order to highlight the role of using Leontief
inverse in the perspective economic analysis, its role is not only limited in
the central equation system for input-output analysis but also it may be used
to measure ecosystem structure and function, sensitivity, Cycling, dependence
and contribution effects between compartments, loop analysis tropic dynamics,
and self-organization (Manfred Lenzen, 2006: 334-342).
These
analyses are efficient to measure economic development of an economy, but due
to the non availability of that information in Rwanda, those depth analyses are
not done, therefore its use in economic development is still under considered.
The Leontief inverse can play a consolidated role in economic development of
Rwanda as it has a multiple uses.
Through this study its consolidated role was shown in central
equation system for input-output analysis to balance production by Products and
by Industry and in output function to measure the impact of increasing or
decreasing intensity of Input Coefficients in an economy.
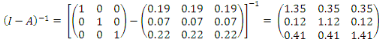
Leontief inverse = (I-A)-1
4.6.1. Use of central equation
system for input-output analysis
Z = B*(I-A)-1F

The above function is used as a central equation system for
input-output analysis which offers multiple approaches for analysis. After
verifying that the production provided using the above equation basing on Input
Coefficient Matrix, Leontief Inverse Matrix, and Diagonal Matrix of Final
Demand is equal to the production Matrix in the above Simplified Supply and Use
Table, therefore further analysis may be made and (Z) Matrix can be useful when
analyzing the impact of how the increase in Input will influence the Total
production within the whole economy (José M. Rueda-Cantuche et al.,
2005: 8).
4.6.2. Use of output function
to measure the impact of increasing or decreasing intensity of Input
Coefficients
X = B* *
(I-A)-1y
B is a row vector matrix from Matrix
A for Agriculture, Industry, and Services, and
B* Matrix is equal to Matrix A (Input
Coefficients Matrix) (Eurostat, 2002: 17-23).
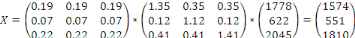
X = Output from Sectors which contribute in production within an
economy.
Basing on the equation system for input-output analysis,
Output from each sector can be computed, and the above equation provide total
production in the three sectors, and the solution is the same as the figures in
Supply and Use Tables.
Through this study the focus was made only on the policy of
increasing Input Coefficients from product (i) to industry (j). The policy used
in this study was to test the impact of fixing input coefficients on 0.30 for
each coefficient other things held constant, in order to see how this policy
may or will influence the production basing on the production of 2007.
The results of this policy are stated in the following table,
and the highlighted column contain the higher production; therefore this policy
will be efficient when the Coefficient from Services (product) to Industry
(industry) (S-I) is increased and at this stage the production
will be maximized basing on the Input and Production Matrices of 2007. This
means that the increase of services Inputs in Industrial sector has a positive
effect to increase economic capacity of Rwanda.
Table 4.7. Changes in Input
Coefficients
|
|
Period 1
|
The Impact of Increasing Input Coefficients to 0.3 on
Sectoral Production
|
|
P (2007)
|
A-A
|
I-A
|
S-A
|
A-I
|
I-I
|
S-I
|
A-S
|
I-S
|
S-S
|
|
Agriculture S.
|
1574
|
2174
|
1754
|
2187
|
1877
|
1706
|
1927
|
1676
|
1609
|
1704
|
|
Industry S.
|
551
|
606
|
567
|
607
|
1513
|
970
|
1673
|
587
|
563
|
596
|
|
Services S.
|
1810
|
1990
|
1864
|
1994
|
2158
|
1962
|
2216
|
2218
|
1950
|
2327
|
|
Total Product.
|
3934
|
4770
|
4186
|
4788
|
5548
|
4637
|
5816
|
4481
|
4122
|
4627
|
Assuming that the Input-Output Coefficients as derived from
Input-Output Table remain more or less constant for a certain period of time
(say a couple of years), they may in a meaningful way be used in so called
Input-Output Models or Inter-Sectoral Models, which describe the relationship
between the output of various branches on the one hand and their different
input requirements on the other hand as used in the above analysis. Such kind
of models may play a role in different types of analysis related to policy
preparation and planning in Rwanda as shown in this research, and input out put
approach would be a powerful too in analyzing and planning process of economic
development and industrial growth in Rwanda.
Figure 4.4. Change in
Production due to Changes in Input Coefficients (2007 Basic
Years)
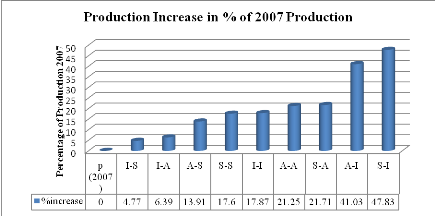
Due to the lack of information in SUT and IO-T this analysis
is not easy to apply on the economy of Rwanda, the results from the analysis of
economy basing on STU and IO-T stipulates that is the increase in production
which determine the quantity to Export and/ or the quantity to import, the
evolution of industry sector and its contribution to development, and the
improvement of the increasing in production of Services Sector has an important
impact when analysing satellite accounts such heath, environmental, and Tourism
satellite accounts.
Table 4.8. Used Abbreviations
|
P(2007)
|
Basic Production base Year 2007
|
|
A-A
|
Agriculture Inputs in Agriculture Sector
|
|
I-A
|
Industry Inputs in Agriculture Sector
|
|
S-A
|
Services Inputs in Agriculture sector
|
|
A-I
|
Agriculture Inputs in Industry Sector
|
|
I-I
|
Industry Inputs in Industry Sector
|
|
S-I
|
Services Inputs in Industry Sector
|
|
A-S
|
Agriculture Inputs in Services Sector
|
|
I-S
|
Industry Inputs in Services Sector
|
|
S-S
|
Services Inputs in Services Sector
|
Chapter V: CONCLUSION AND
RECOMMENDATIONS
5.1. Conclusion
Supply and Use Tables can play important role in the economy
of Rwanda as an integrated framework of the National Accounts. With existing
policies to improve SNA, Rwanda's System of Accounts tend to be fully
Consistent with the world-wide System of National Accounts (SNA 1993) but it
suffers from loss of information to implement SAM as stated in Chapter IV
because Income Approaches to compute to compile SUT and to compute GDP is not
applied in Rwanda. However, Rwanda's System of Accounts is focused more on the
circumstances and data needed in Rwanda and Supply and Use System remain unused
due to its complexity.
The Input-Output Framework basing on the information from
Supply and Use Framework consists of three types of tables: Supply Tables, Use
Tables, and Input-Output Tables.
In Chapter IV it was proved that in Rwanda rather than using
Supply and Use Tables linear model was adopted in production and consumption
models. It only reflects total Domestic Production, Import, Export, Savings,
and Consumption behaviours in Rwanda.
Supply and Use Tables serve not only Statistical but also
analytical purpose, especially when they are transformed into Symmetric
Input-Output Tables. Basing on the analysis done in Chapter IV, Input and
Output Framework is not available, and therefore IO-T can not be available, but
through the analysis of GDP the example of GFCF shows for each sector the use
of Investment which were necessary to produce the primary and secondary output,
the analysis shows also how the education system was improved in the period of
1999 to 2009 due to the investment done in this sector, and investment injected
in health system justify the reduction of morbidity and mortality in Rwanda
during this period as result there has been increase in Life Expectance.
Along this period, it was proved that the use of Linkage
Technique in Rwanda can play an important role in development. The linkage can
be applied though many policies of the Government of Rwanda through which
households can be disaggregated into income group.
Apart from Linkage technique, the importance of Dummy
technique in economic development was proved when analysis management of land,
Land productivity and land protection. In order to manage land the government
of Rwanda has implemented different policies such as Land Consolidation,
IMIDUGUDU, and other policies for managing swamps.
Also the role of activity specification technique was
emphasized when trying to analyze the socio-economic welfare during the period
of 1999 to 2009 whereby the government of Rwanda has implemented different
Program such as PRSP (Poverty Reduction Strategic Paper) in 2000 and EDPRS
(Economic Development and Poverty Reduction Strategy) in 2005 and this
Specification Technique is used to estimate Input-Output Sector expenditures
directed toward influencing the quality of Urban and Rural life in Rwanda.
This study proved how the estimation of quality of life lead
to the estimation of social welfare in Rwanda through GDP per Capita, Literacy,
and Life expectancy. This study shows how Literacy rate has improved due to the
important investment injected in education sector and the education for all
Policy, and also Life expectancy has been improved from 1999 to 2009 due to the
reinforcement of health sector and this is explained by the reduction of
Morbidity and Mortality in Rwanda during this period.
From Supply and Use Tables, Symmetric Input-Output Tables to
the Estimation of Quality of Life and Social Welfare, Economic Development can
be measured. This study proved this, and showed that the best and rich measure
of Welfare for Economic Development is the Human Development Index, and the
analysis shows how the improvement in HDI was from 1980 to 2009 (0.357 to
0.477). Even though there has been an improvement, Rwanda is still classified
into Low Developed Countries (0.50-0.00 HDI) and in Low Income Countries (500$
Per Capita Income), but the forecast states that Rwanda will reach the group of
Medium Developed Countries (0.80-0.50 HDI) in the following 30 years.
The results of this study showed that the first hypothesis was
not verified, because SUT/I-O's significant role in the perspective analysis of
economic development of Rwanda is not recognized. This means that, even though
the role of SUT and IO-T in the perspective analysis of economic development
was proved, SUT and IO-T are not available.
The second hypothesis was also not verified because as SUT and
IO-T are not available, their role in economic analysis and prevision, decision
taking, and policy making for a sustained economic development of Rwanda are
not applicable.
The reason why I have combined SUT/I-O Analysis with the
Economic Development of Rwanda was to highlight the role of SUT/I-O analysis in
economic development and to show that they have a key role to play in the
perspective analysis of Economic Development of Rwanda if they are compiled.
Much analysis of economic development of Rwanda needs to be based on economy
wide basis (e.g. development planning) and this suggests the need for
macro-economic approach; most macro-models however are so highly aggregated
that they must perforce assume a degree of resource mobility which is just not
present in Rwanda. The only answer seems to be SUT/input-output analysis, which
is macro in terms of its coverage and get «micro» in terms of its
approach.
The interface of SUT and economic development is one of the
most exciting and most challenging fields of System of National Accounting. It
involves relevant aspects such as planning, budgeting, auditing, taxation,
finance, programming, capital formation, project appraisal, and yet others
which pertain the overall aim of economic development at both micro and macro
levels.
This study was designed to highlight the role of SUT and its
wider range of responsibilities imposed on accountant in developing countries
like Rwanda, and how it demands a high level of intellectual calibre, knowledge
and capacity, and determination so that the accountant responds to the needs of
economic development process of Rwanda.
5.2. Recommendations
Rwanda National Accountants have to make an effort and
introduce the income approach to compile Supply and Use Tables and Input-Output
Table and to compute GDP, because this approach could help in Social
Accounting Matrix designing.
The use of SUT and SAM should allow the evaluation of relative
burden of taxation across households types and should also allow to consider
how best to use taxation and transfers system to alleviate poverty. Through
this, the government should collect taxes and spends the funds on public
projects and on transfers to poor segments of the population.
In Rwanda the youth occupies an important portion of the total
population. Even though, policy should focus not only on youth's opportunities
but also on their capabilities and second chances. This will increase the
productivity capacity of Rwanda, and transformation initiative which also will
increase value added on goods and services which are domestically produced for
final consumption or for export.
The government of Rwanda should make the services work. Making
services work requires changing the institutions relationship among key
sectors.
Rwanda's economic growth «a major determinant of human
development outcomes» would need to be substantially faster than it has
been in last 10 years to make dramatic improvements of economic development of
Rwanda.
The government of Rwanda should build blocks of economic
growth, human capital, empowerment, and social protection. The blocks are
mutually dependent. And these blocks are all captured in SUT/I-O tables through
salaries as remittances of human capital, empowerment and social protection
through investment and economic growth through GDP.
SUT/I-O Tables should be used to forecast and predict the
development of Rwanda. Basing on data in SUT/I-O tables it is possible to
visualize the behaviour of SUT/I-O Tables in previous years. SUT/I-O Tables
Should also be used to foster balance of payment by improving investment for
promoting export.
In Rwanda environmental protection activities should be
carried out by all sectors. They should be concentrated, however in three
sectors which sell protection services: a) Government, b) Trade and transport
and c) other services which provide private waste disposal services,
environmental consulting and recycling.
However, to maintain the progress towards economic
development, the researcher proposed to promote skilled personnel including
accountants and other economic planners able to compile and consolidate SUT and
IO-T, in order to design plans and programs that aim at enhancing the economy.
In addition to this; social, commercial and credit conditions should be
accessible for farmers. And again, Supply and use identity should serve as a
basis for various interconnection with satellite accounts such as labour
statistics, linkage with physical flows (land use, energy), linkage with other
physical flows related to environmental issues (emission of CO2, waste, sewage)
and other form of satellite accounts system for tourism, transport, health, and
education.
REFFERENCES
Brody A. & Carter A.P., 1971, Input-Output
Techniques, Geneva
Bulmer-Thomas V.,1982, Input-Output Analysis in
Developing Countries, Queen Mary College, London University.
Claire Grelet TERRIOU, 2005, La nouvelle
comptabilité ; 2nd Edition, Imprimerie
Floch; France.
Eurostat, 2002, The ESA-95 Input-Output Manual.
Compilation and Analysis. (Luxembourg, Eurostat).
Grahan Pyatt, 1988, A SAM Approach to modeling,
Journal of Policy Modeling, University of Warwick.
------------------, 1999, Some Relationships
Between T-Accounts, Inout-Ouput Tables and Social Accounting
Matrices : Economic System Research, Vol. 11, No. 4,
htt://en.wikipedia.org/wiki/logistic_regression reached on
16th September 2010.
htt://www.docstoc.com/docs/48810565/RWANDA--Kigali, Accessed
on 28th September 2010.
Htt://www.undp.org.rw/Poverty_Reduction.html, Accessed on
28th September 2010.
Jan W. Van Tongeren and Bertha Vallejo, 2007,
Course : Macro Accounting I. Macro Accounting for Policy
Analysis, NUR, Rwand.
Jean-Paul Azan, Gerard C., Patrick and Slyviane G., 1989,
The Impact of Macroeconomics Policies on the Rural
Poor :Analytical Framework and Indicators, UN Publication,
New York, USA
Jean-Paul PIROU, 2006, La comptabilité
nationale,14th Edition. Europa Media Duplication
à Lassay-les-château. Paris, France.
John RWIRAHIRA, 2008, Rwanda agriculture Sector Situational
Analysis : An IPAR Sector Review.
José M. Rueda-Cantuche, Jörg Beutel, Frederik
Neuwahl, Andreas Löschel, Ignazio Mongelli, 2005, A Symmetric
Input-Output Table for EU27: Latest Progress
KAREN Wilson, 2004, The Architecture of the System of
National Accounts: A three-way international comparison Canada, Australia and
the United Kingdom.
Leontief W., 1936, Quantitative input and output
Relations in the economic system of the united states, Review of economic
Statistics.
Longman, 2009, Dictionnary of Contemporary
English, New Edution, Pearson, United Kingdom.
Manfred Lenzen, 2006, Structural Path Analysis of
Ecosystem Networks: Ecological Modelling, Elsevier, Australia.
Nicolas C,Vincent K, Bruno T, 2005, Economic
Forecasting, London, United Kingdom.
Republic of Rwanda, September 2007, Economic
Development and Poverty Reduction Strategy, Rwanda
--------------------------, NISR, 26/March/2010, GDP
Annual Estimates for 2009 based on 2006 banchmark. Kigali,
Rwanda
--------------------------, USAID, NUR, and World Health
Organization, June 2008, National Health Accounts Rwanda 2006: With
HIV/AIDS, Malaria, and reproductive Health Sub-Accounts,
Rwanda.
--------------------------, NISR, 2009, Statistical
Yearbook 2009 Edition, Kigali, Rwanda
Rueda-Cantuche, J.M. (2007) Stochastic Input-Output
Analysis Applied to the Andalusian Economy, (Seville,
Institute of Statistics of Andalusia) [in Spanish; English
version available upon request to the author], in press.
Todaro P. Michael & Smith C. Stephen, 2006,
Economic Development, 9th Edition, Pearson Education
Limited, New York, USA
Steven J. Keunig, 1996, Accounting for Economic
Development and Social Change, Los Press, Amsterdam, Oxford,
Tokyo
ten Raa, T. and Rueda-Cantuche, J.M. (2007)
Stochastic Analysis of Input-Output Multipliers on the basis of Use
and Make Matrices, Review of Income and Wealth.
United Nations,1993, Integrated Environmental and
economic accounting (Interim version).Study in Methods , Series F
,No 61 (United Nations New York)
---------------------, Eurostat, International Monetary Fund,
Organization for economic Cooperation and Development, and World Bank,
1993,System of National Accounts 1993,Series
F,No2,Rev 4 (United Nations, New York etc..)
---------------------, 2002, Use of Macro-accounts
in policy Analysis, Department of Economic and Social Affairs,
New York.
---------------------, 1986, Hand Book of National
Accounting, accounting for production: sources & methods,
Series F, No39, Department of International Economic and Social Affaires, New
York.
APPENDICES
Figure 1. Appendices: From Supply and Use tables to
Input-Output Tables
Supply Table
Use Table
Production Matrix
Use table for Imports
Use table for Domestic output
Transformation of Supply and Use Tables to Symmetric
Input-Output Table
Technology Assumption
Assumption of fixed sales structure
Model A Production Technology
Assumption
Model B Industry Technology
Assumption
Model C Fixed Industry Sales
Assumption
Model D Fixed Product sales
Structure Assumption
Product by Product Input-Output Tables
Industry by Industry Input-Output Tables
Source: José M. Rueda-Cantuche, Jörg Beutel, Frederik
Neuwahl, Andreas Löschel, Ignazio Mongelli, 2005, A Symmetric
Input-Output Table for EU27: Latest Progress: 20.
Table 1. Appendices: Transformation of make and use
matrices into symmetric input-output tables
|
MODEL A
Product by Product
Product technology based
|
MODEL B
Product by Product
Industry technology based
|
MODEL C
Industry by Industry
Fixed Industry sales structure
|
MDEL D
Industry by Industry
Fixed Product sales structure
|
|
Input Coefficients
|
AA(U,V) = UV-T
|
AB(U,V)=
U(diag(Ve))-1V(diag(VTe))-1
|
AC(U,V) =
diag(Ve)V-TU(diag(Ve))-1
|
AD(U,V) =
V(diag(VTe))-1U(diag(Ve))-1
|
|
Intermediates
|
ZA = AA(U,V)diag(VTe)
|
ZB = AB(U,V)diag(VTe)
|
Zc = AC(U,V)diag(Ve)
|
ZD = AD(U,V)diag(Ve)
|
|
Final Demand
|
FA = Y
|
FB = Y
|
FC = diag(Ve)V-TY
|
FD = V(diag(VTe))-1Y
|
|
Value Added
|
VAA =
WV-Tdiag(VTe)
|
VAB = W(diag(Ve))-1V
|
VAC = W
|
VAD = W
|
|
Output
|
qA =
(I-AA(U,V))-1FAe
|
qB = (I -
AB(U,V))-1FBe
|
gC =
(I-AC(U,V))-1FCe
|
gD = (I-AD(U,V))-1FDe
|
|
Negatives
|
YES
|
NO
|
YES
|
NO
|
Legend for the transformation of make and use tables into
input-output tables at basic prices
A=
Technical Coefficients Matrix Y = Matrix for
Final demand by Product and Category VT =
Supply Matrix
W = Matrix of Value added by component and by Industry
U = Use Matrix
e = Column Vector of Ones
Note: T will
denote transposition and -1 inverse of matrix. Since the two operations
commute, their composition may be denoted -T. Also, diag will denote
diagonalization whether by suppression of the off-diagonal elements of a square
matrix or by placement of the elements of a vector
Source: José M. Rueda-Cantuche, Jörg
Beutel, Frederik Neuwahl, Andreas Löschel, Ignazio Mongelli, 2005,
A Symmetric Input-Output Table for EU27: Latest
Progress: 21
Table 2. Appendices: Input-Output Table Set in the Form of a Social
Accounting Matrix
(i) (ii) (iii)
(iv) (v)
Domestic Production
Institutions
Products
Activities Factor Services Domestic RoW
TOTALS
Domestic Production Use of
Raw Dom. Final Export of goods Demand
(i) Products Materials
Demand (market & non Factors for
Products
.
Prices)
Services (f.o.b) market prices
(ii) Activities Gross Out-
Gross output
. .
Puts
of products
.
(Producer
(producer
.
Price )
price)
(iii)Factor Services Payments for
Demand for
. Factor services
fact. services
. . .
(including VAT)
market prices
Institutions I. Taxes on I.
Taxes on Factor services Factor income
Total income
(iv)Domestic Products +
activities + supplied plus received from
generated by
. . . import operating
surplus VAT receipt abroad
contributions
. . . duties
of Government
or production
(v)Rest of the World Import of
Factor income Total
domestic . . .
goods and paid abroad
expenditure on
. . . . non-factor
and imports of
foreign goods .
services factor
services and
services . . .
(c.i.f)
TOTALS Supply of Gross
outputs total supply of Total expenditure Total foreign
. products at of products
factor services on production expenditure
. market valued at pro- at
market prices at market prices on domestic
. . prices ducer prices
goods
&services
Source: Grahan Pyatt, 1988, A SAM Approach to
modeling, Journal of Policy Modeling, University of Warwick.
| 

