4.5.2 Teacher satisfaction
Considered the linking point between the investors and the
target audience (pupils), teachers in the educational field play an important
role in the process of delivering what could be described as the `product' that
is the teaching and learning. As such, an analysis of the teacher's own
observations of the investment was deemed necessary. In order to assess
teachers' satisfaction, questionnaires were sent to 25 teachers of 5 private
schools in Kibera. The questions sought to find out if they were happy with
their working environments with regards to different aspects. The 12 female and
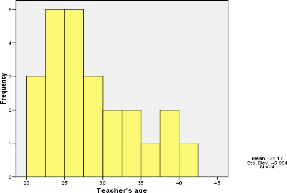
13 male teachers' age of the five schools ranged between 21 years old and 41
years old, with a mean of 28 yrs and a standard deviation of 6 yrs. (See table
and Figure 22)
Table 10:Teacher's age
Descriptive Statistics
|
N
|
Minimum
|
Maximum
|
Mean
|
Std. Deviation
|
|
Teacher's age Valid N (listwise)
|
24
24
|
21
|
41
|
28.17
|
5.954
|
Figure 22: Teachers' age
The study equally presents a valuable point related to the
teachers of private schools in Kibera: The qualifications or better still their
highest education level. Of the 25 teachers in the 5 schools, 7 of them have
attained the secondary school level (school up to age 16-18), while 14 have a
college certificate and 4 of them have a diploma.(see table 11). These two
factors (Teachers' age and qualifications) are a determinant factor in
assessing their satisfaction level. The following development addresses this
issue.
Table 11: Teachers' educational level
The highest education level of the teacher
|
Frequency
|
Percent
|
Valid Percent
|
Cumulative
Percent
|
|
Valid Up to Secondary
|
7
|
23.3
|
28.0
|
28.0
|
|
Up to college certificate
|
14
|
46.7
|
56.0
|
84.0
|
|
Up to Diploma
|
4
|
13.3
|
16.0
|
100.0
|
|
Total
|
25
|
83.3
|
100.0
|
|
|
Missing System
|
5
|
16.7
|
|
|
|
Total
|
30
|
100.0
|
|
|
In understanding the degree of their satisfaction, we set to
scrutinize their respective opinions towards certain issues, the main important
consisting of:
Teacher salaries
Only 3 teachers out of 25 reported to be satisfied with their
salaries while 13 said they were dissatisfied and the remaining 9 very
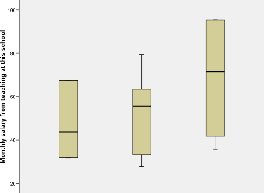
dissatisfied. Their average monthly salaries ranged from a minimum wage of
£28 to a maximum of £95, thus a mean of 53.94 and a standard
deviation 19.921(see table 12). Most importantly the average monthly amount
earned by teachers differs from one another depending of their highest
educational level. The teachers' whose highest education level is up to
secondary school earn less money than their colleagues whose highest education
level is up to a diploma (see figure 24).
Figure 23: salaries' satisfaction
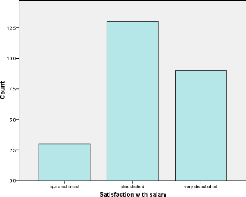
Table 12: Teachers' salaries
Descriptive Statistics
|
N
|
Minimum
|
Maximum
|
Mean
|
Std. Deviation
|
|
Monthly salary from teaching at this school
Valid N (listwise)
|
25
25
|
28
|
95
|
53.94
|
19.921
|
Figure 24: Teachers' salaries

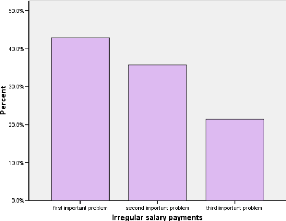
The study equally found that in most schools, the agreed
amount of salary was not paid to teachers on a regular basis. This is
considered in serious handicap in the teachers' motivations as more than 40%
teachers said this was one of their first important problems with private
schools in Kibera (see figure 25).
Figure 25: Irregular salary payments.
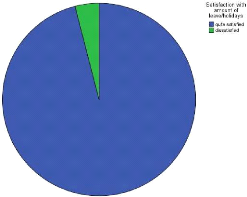
Amount of leave or holidays
Over 96% of the teachers expressed that they were satisfied
with the amount of leave that is granted to them in their schools and just
1teacher out of 25 declared being dissatisfied. This is quite valuable
information for the teachers in Kibera. The holidays or leave period offer an
opportunity to focus on something else not related to teaching and thus prove
to be revitalising in terms of energy.
Figure 26: Holidays' satisfaction rate
Teacher's social status in the community
The status in the community in many developing countries is an
important aspect which determines the incentive for joining the teaching
profession by many youngsters. For the case of teachers of private schools in
the slum of Kibera, 1 out of 25 felt «very satisfied» with his social
status, while 19 reveal they are «quite satisfied» and 5 expressed a
negative point of view concerning the issue (see table 13)
Table 13: Social status in the community
Satisfaction with the social status in the
community
|
Frequency
|
Percent
|
Valid Percent
|
Cumulative
Percent
|
|
Valid very satisfied
|
1
|
3.3
|
4.0
|
4.0
|
|
quite satisfied
|
19
|
63.3
|
76.0
|
80.0
|
|
dissatisfied
|
5
|
16.7
|
20.0
|
100.0
|
|
Total
|
25
|
83.3
|
100.0
|
|
|
Missing System
|
5
|
16.7
|
|
|
|
Total
|
30
|
100.0
|
|
|
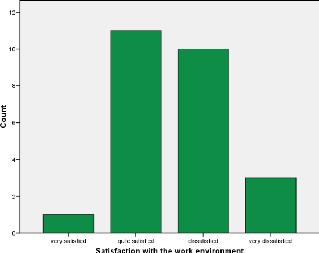
The work environment
The term work environment means the cooperation ties that
prevail on one hand between the teachers and the school administration and on
the other, between the teachers and the pupils both in class and in the
community. At this effect, our study found that there was a divergence of
opinions. 1 teacher out of 25 said they were satisfied with the working
environment, while 11 said they were quite satisfied. On the negative side of
the group 10 teachers declared being dissatisfied and finally 3 of them
reported as being very dissatisfied.(See figure 27)
Figure 27: Satisfaction with the work
environment
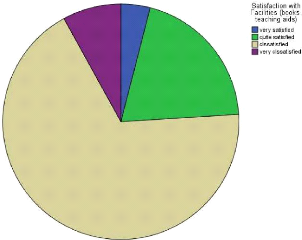
The facilities (books, teaching aids etc)
The facilities offered to teachers play an invaluable role in
the knowledge transmission process. Without these, the act of teaching would
simply be more difficult especially when dealing with children from poor homes
whose parents cannot afford all the learning materials. As the figure below
presents it, a vast majority of teachers (17) do not value the facilities that
are put at their disposal. They feel dissatisfied with the overall facilities
in their schools. The remaining teachers are divided into three categories: 1
teacher says he is very satisfied with the facilities, 5 are quite satisfied
and finally 2 teachers are very dissatisfied (see figure 28).
Figure 28: Satisfaction with facilities
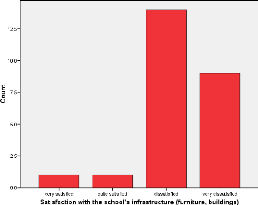
The infrastructure (furniture, buildings etc)
Concerning the school buildings, an unprecedented number of
teachers expressed their dissatisfaction. Like it was the case with pupils, the
teachers in a great majority think their school infrastructures including the
buildings and the furniture are very poor. 2 teachers said they were either
very satisfied or satisfied, while 14 said they were dissatisfied and finally,
9 out of the 25 said they were very dissatisfied.
Figure 29: Satisfaction with the school
infrastructure
Finally, a question was asked to the teachers requesting them
to rank in the order of importance, what they thought were the crucial problems
they face as teachers in the slum of Kibera. Three major points emerged from
this question. 19 teachers reported that poor infrastructures was their first
and most important problem follow by lack of facilities which 17 teachers said
was of second importance and finally, a number of 14 teachers mentioned
irregular salaries as the third problem.
It would seem that teachers' satisfaction in private school
investment in Kibera (taking this to be infrastructure etc) varies from one
teacher to the other. However, our study has shown that the satisfaction of
teachers in Kibera is quite difficult to assess from an individual points of
view. The general trend that could be noted here is that in a great majority of
cases the teachers believe that issues regarding their salaries, the
infrastructures and the buildings in private schools of Kibera need to be
addressed.
Table 14: First important problem
Poor infrastructure
|
Frequency
|
Percent
|
Valid Percent
|
Cumulative
Percent
|
|
Valid first important problem
|
7
|
23.3
|
36.8
|
36.8
|
|
second important problem
|
7
|
23.3
|
36.8
|
73.7
|
|
third important problem
|
5
|
16.7
|
26.3
|
100.0
|
|
Total
|
19
|
63.3
|
100.0
|
|
|
Missing System
|
11
|
36.7
|
|
|
|
Total
|
30
|
100.0
|
|
|
Table 15: Second important problem
Lack of teaching aids
|
Frequency
|
Percent
|
Valid Percent
|
Cumulative
Percent
|
|
Valid first important problem
|
9
|
30.0
|
52.9
|
52.9
|
|
second important problem
|
4
|
13.3
|
23.5
|
76.5
|
|
third important problem
|
4
|
13.3
|
23.5
|
100.0
|
|
Total
|
17
|
56.7
|
100.0
|
|
|
Missing System
|
13
|
43.3
|
|
|
|
Total
|
30
|
100.0
|
|
|
Table 16: Third important problem
Irregular salary payments
|
Frequency
|
Percent
|
Valid Percent
|
Cumulative
Percent
|
|
Valid first important problem
|
6
|
20.0
|
42.9
|
42.9
|
|
second important problem
|
5
|
16.7
|
35.7
|
78.6
|
|
third important problem
|
3
|
10.0
|
21.4
|
100.0
|
|
Total
|
14
|
46.7
|
100.0
|
|
|
Missing System
|
16
|
53.3
|
|
|
|
Total
|
30
|
100.0
|
|
|
| 

