2. METHOD
2.1. Study techniques
2.1.1. Site Selection of permanent transect and plot
From GIS shapefiles and SPOT images of the area covered by the
study has been identified for the preparation of a baseline map.
This map has been enriched by a layer of contour lines which
allowed us to identify the best location of the permanent transect and plot for
the study of habitat variation according to an altitudinal gradient.
Using the Map Source software and Arc GIS 9.2, we created
geographic coordinates of the beginning and the direction of the permanent
transect. These coordinates were then uploaded into the GPS and using the
«GoTo function» of GPS; thus the planned transect was established in
the field.
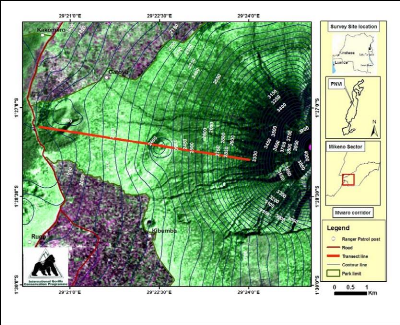
Figure 1. Location of Mwaro ecological corridor: setting of
the permanent botanical 7 km long transect and 1-ha plot

Page 12


Page 14
The plot's, establishment was carried out according to the
recommendations of Kuebler (2003), using a vegetation long-term monitoring
method alowing to assess the biomass, the growth, the structure and composition
the forest.
2.1.2. Establishment of the permanent transect and plot
2.1.2.1 Opening the transect
The coordinates created and downloaded into the GPS were: S
1.45535; E29.34112 On the ground, thanks to the «Go To» function of
the GPS, we approximately located the starting point at the coordinates
S1.45535, E29.3411, at an altitude of 1867 m and corresponding to the starting
point of the permanent transect.
Using a compass, we ran the tracker responsible for the
opening of the transect in the East of the magnetic direction corresponding to
the orientation of the corridor. The tracker, who opened the transect using a
machete was brought back on course at every slightest deviation. Along the
transect, each 50 m was marked with a colored ribbon on which was inscribed the
distance reached. The distance along the transect was known by reading the
figure indicated by the pointer function "map" of GPS. This corresponds to the
distances travelled measured as the crow flies (rather tan distance traveled on
foot, for example), which are best suited for representation in 2 dimensions of
surfaces such as those used when making maps.
2.1.2.2. Establishment of the plot
A 1 ha plot was identified and located in a vegetation of 4 ha
earlier prospected on a homogenous ground in Mwaro corridor. The making of the
plot started with the opening of two perpendiculars lines in the target
vegetation, one towards the east and the other towards the south and each with
100m long subdivided in 5 intervals of 20cm each. The first 2 intervals of 20 m
of each transects were attributed the coordinates (00, 20) and (20, 00). At 40
m of each transect the coordinates become (00, 40) et (40, 00), likewise, at 60
m they were (00, 60) and (60, 00). From this we deduce that the coordinates at
the end of the transects were: (00, 100) and (100, 00).
To establish a 1ha plot easily as well as to limit 25
quadrates of 20 m X 20 m within the plot, KUEBLER (2003) recommands, to limit
the first quadrat at coordinates (20, 20) which corresponds to the
perpendicular point at the distances of 20 m of 2 transects. The next point of
the limitation of the quadrat n° 2 had thus (40, 20) as coordinates; the
third point for quadrat 3 was (60, 20, then (80, 20) for the fourth quadrat and
(100, 20) for the fifth.
At this level, the next stage, according to the same method,
consisted in identifying the point of limitation of quadrat n° 10 just
near quadrat n° 1. This is the point of coordinates (20, 40) then the
point of coordinates (20, 60), (20, 80), (20, 100). There followed the
identification of point (40, 40) and in the same way the identification of
point (60, 40) ; (80, 40) ; and (100,40) as well as (40, 60) and (40, 80) (40,
100). The next identified point was (60, 60) followed by (80, 60) and (100, 60)
and then (80, 80) and (100, 100).
Biodiversity survey of Mwaro corridor, Altitudinal
distribution of the vegetation and assessment of Gorilla food
availability
Then the 25 quadrats were identified by reference numbers in 1 -
5, 5-6; 6-10; 10-11; 11-15; 15-16; 16-20; 20-21; 21-25 (figure 4).

|
5
|
6
|
15
|
16
|
25
|
|
4
|
7
|
14
|
17
|
24
|
|
3
|
8
|
13
|
18
|
23
|
|
2
|
9
|
12
|
19
|
22
|
|
1
|
10
|
11
|
20
|
21
|
|
|
20 m
Figure 2. Schematic representation of the 1-ha plot
established in Mwaro corridor
| 

