4 RESULTS AND DISCUSSION
The results of this modeling exercise are divided into three
sections: the first section presents the summary results of the model as a
whole along with the different aggregation and classification schemes; then
statistics are shown for the multiple factors that make up the model; finally,
the effect of changing one assumption about the model is analyzed.
4.1 Results by Linear Combination Schemes
Participants in the Expert Opinion survey ranked waste as the
major source of pollution (0.14) above traffic, markets and housing density,
which equally came second with a weight of 13%. A lesser weight was allocated
to cemetery, hospitals, and high voltage, which accounted for 8%. Indeed, the
largest gap between the factors' weight was at most 6%.
4.1.1 Expert Opinion Survey, Equal Influence (Equal Weight),
and Personalized Weightings
Irrespective of the combination or the classification
technique used, about 41% of the study area was found exposed to high and very
high environmental health risks, all factors considered. This result was
brought out by simultaneously averaging the Expert Opinion survey, the equal
influence, and the personalized combination schemes on one hand, the quintile,
the natural breaks, the equal interval, and the geometric interval techniques
on the other hand, so that this number is freed of the influence of any single
combination method or classification technique. The averaged results are
displayed in the table below. A more complete set of results is provided in
Table 16 in Appendix A.
Table 9: Percent of areas
per vulnerability level - Average score for the four classification
techniques
|
Combination scheme
|
Very High
|
High
|
Moderate
|
Low
|
Total
|
|
Expert Opinion
|
15.6
|
25.4
|
35.9
|
23.1
|
100.0
|
|
Equal Weight
|
14.4
|
21.6
|
38.3
|
25.7
|
100.0
|
|
Personalized assignment
|
14.9
|
25.9
|
36.5
|
22.7
|
100.0
|
|
Average
|
14.9
|
25.9
|
36.5
|
22.7
|
100.0
|
The standardized classification scheme, which terms as a control
(Table 10), led to a far different result with no areas exposed at very high
risk and at most 15.9% of areas with high risks. In both cases the largest
percentage was found in the category moderate risks, which amounts up to 59.3%
in the standardized classification versus 36.5% in the first case. This
perceptible discrepancy brings forward how the analysis built on one or another
technique may lead to erroneous conclusions.
Table 10: Percent of areas
by risk level and aggregation scheme using a standardized
classification
|
Combination scheme
|
Very High
(3-4)
|
High
(2-3)
|
Moderate
(1-2)
|
Low
(0-1)
|
Total
|
|
Expert Opinion
|
0.0
|
16.6
|
60.2
|
23.2
|
100.0
|
|
Equal Weight
|
0.0
|
11.7
|
59.7
|
28.6
|
100.0
|
|
Personalized assignment
|
0.0
|
19.5
|
58.0
|
22.5
|
100.0
|
|
Average
|
0.0
|
15.9
|
59.3
|
24.8
|
100.0
|
Comparing the three methods used to combine the multiple factors,
EOW and the personalized approach provided very similar results displaying a
maximum difference of 0.7% for areas at very high risks (Figure 4). Whereas
the gap between the EOW and the personalized weighting was minimal, a greater
percentage (maximum 4.3%), discriminated them from the equal influence
technique. The equal weighting technique was prone to assign more cells in low
and moderate levels and consequently promoted the influence of low values over
high values than did the two other techniques. Despite this difference the
general trend showed a larger percentage of areas at moderate and low risk
irrespective of the classification technique utilized, as it appears on the
figure below. What may explain this?
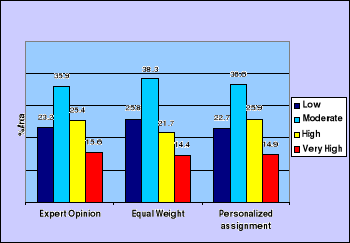
Figure 4: Environmental
Health Risks -
Average percent of areas by combination
scheme
Most of the parameters did not have a spatial domain covering the
entire area. The average area extent for all the parameters was 52%, with only
housing density having 100% assignment. For a given factor, areas with no risk
participating in the combination reflect on the result. Large scores (values
greater than 3) can be obtained only if the largest possible number of cells
participating in the combination contributes with a maximum score. In other
words, the various factors considered are dispersed over the area of study with
few cases of high value overlap. Since the equal weighting method does not
discriminate the variables, the final grid calculation was heavily affected by
these zeros. This fact is evident in the standardized classification technique
which established the classes based on discrete values at fixed interval. The
category 4 (values ranging from 3 to 4) was virtually absent in all the
combination schemes.
The map displayed on Figure 5 results from the EOW combination
using the geometric interval reclassification technique. It indicates a
concentration of high risk areas in the downtown area and heading toward the
coast. Conversely, areas at moderate and low risks are located away from the
downtown toward the periphery mostly made of high slopes. This observation
confirms the assertion that high population density associated to untidy
urbanization in a context of weak institutional framework is mainly responsible
for the daily occurrence of life-threatening hazards.
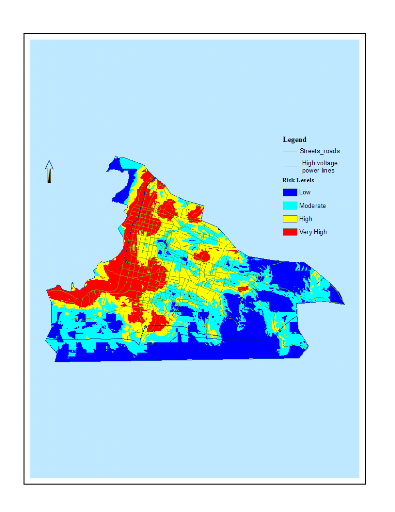
Figure 5: Environmental
Health Risks in Port-au-Prince - EOW classified with the geometric interval
technique
| 

