3. METHODS
3.1 Study Area
Port-au-Prince (Figure 1) is the administrative, commercial, and
political capital of Haiti, but regarding the size it is the second smallest
commune of the country. It measures 36 km2 (IHSI 2003). The study
area, which is the populated areas within Port-au-Prince, is about 28
km2. Elevation in the study area ranges between the sea level and
600 meters. The last census realized in 2003 indicated that more than 730,000
inhabitants (9% of the country's population) populated this place, which
represents about 20,500 people per km2. This pressure of dense
population on this narrow strip of land is not without negative impacts on the
environment. The Atlantic Ocean forms the northwesternmost boundary of the
study area, which in turn verges on several slums. The study area was obtained
by cutting off the south section of the base map approximately at latitude UTM
2049000 meters as indicated on Figure 1(left). This cut was done for several
reasons. First, the topographic map sheet used for digitization missed a
portion of the south section of port-au-Prince. Efforts to find the missing
part at the same scale (1:12,500) were fruitless. The largest scale found,
1:50,000 would difficultly allow digitizing the contours 10 meters apart.
Another fundamental reason was the fact that the missing area was poorly
inhabited with the density of housing close to zero. Since we wanted to assess
health risks in populated places, we felt that the exclusion of this area in
the study would not substantially affect the study. The last reason concerned
time-efficiency. The elevation at these excluded areas was the highest (about
600 meters). Consequently, a lot of contours needed to be digitized, which
would add to the burden of digitizing tasks without contributing to the
improvement of the study. Therefore, the most convenient choice was to take
this section off of the study area.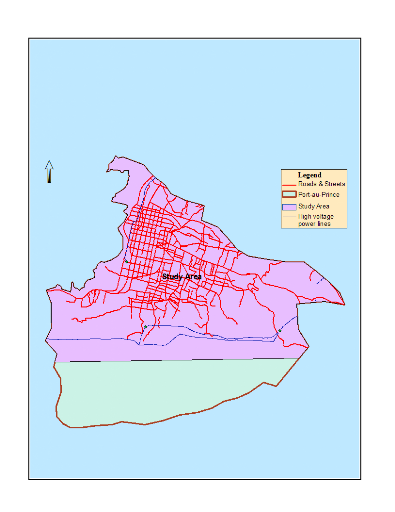
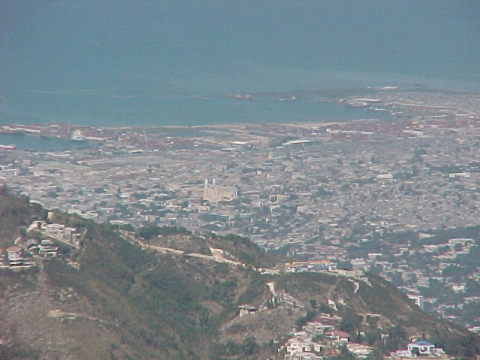
Figure 1: left: Base map of
Port-au-Prince and the study area; right: Port-au-Prince's view from the
southeast hills.
3.2 Data collection
The features included in the dataset derive from two main
sources: a) data readily available from the Remote Sensing and GIS Unit of
Haiti's Planning Ministry (formerly UTSIG, currently CNIGS) and IHSI; b)
digitization of multiple layers from topographic map, scale 1:12,500 prepared
in 1994 by the Defense Mapping Agency, Hydrographic/Topographic Center,
Bethesda, MD. The first source category includes the administrative boundary
of Port-au-Prince, the habitat density, and the land use. The IHSI's SDE
delimitation contributed to the reattribution of the habitat density layer.
Features digitized within an ArcMap interface included: contours, rivulets and
other waterways, high voltage power lines relay-centers and power energy
centrals, the main roads and other high-traffic-density streets, the waste
collection network, formal and informal marketplaces, the main hospitals, the
cemetery, the seashore, and the very important points (VIPs), which are
landmarks found on the topographic map. All the layers were standardized to
UTM projection, NAD83, Zone 18N, unit in meters. As can be seen most of the
features were obtained by the laborious digitization process.
After digitization the features where edited in accordance to
pre-established set of topologic rules in order to ensure the integrity of the
database. Overlaps, dangles, unwanted intersections, wrong attributions, and
any other topologic errors revealed by the topology validation tool were
corrected with the editing tools provided in ArcMap until all the errors were
adjusted.
| 

