Table of content
Abstract i
Acknowledgement ii
Table of Content iii
List of figures v
List of tables viii
Glossary ix
Chapter 1 Introduction to thesis page 1
1.1 Background 1
1.2 Research questions 3
1.3 Objectives 4
1.4 Methodology 4
1.5 Structure of thesis 7
1.6 Data sources 7
1.7 Key assumption 7
1.8 Choice of performance measures 8
1.9 Summary 9
Chapter 2 ASECNA's region Air Transport Industry
10
2.1 Economic characteristics 11
2.2 Transport infrastructure 13
2.2.1 Roads 13
2.2.2 Railways 13
2.2.3 Ports 14
2.3 Air Transport Industry 14
2.3.1 Airport Infrastructure 15
2.3.2 Airlines 16
2.3.3 Fleet 17
2.4 Regulatory 25
2.5 Air Travel Demand 26
2.6 Conclusion 32
Chapter 3 Air navigation Performance Review
34
3.1 Introduction 34
3.2 Airspace organization 34
3.2.1 Description of ASECNA's strategy 34
3.2.2 Fragmentation 36
3.3 Traffic 38
3.3.1 Airport activity 38
3.3.2 En-route traffic 40
3.4 Delays 44
3.5 Impact of future trends 44
3.5.1 Prospects 44
3.5.2 Impact on runway capacity 45
3.5.3 Impact on en-route capacity 46
3.6 Traffic complexity 47
3.7 Safety 48
3.7.1 Air Proximities 48
3.7.2 Users' claims 49
3.7.3 Birdstrikes 49
3.7.4 Safety Review System 50
3.8 Efficiency 50
3.8.1 Flight efficiency 50
3.8.2 Fuel efficiency 51
3.9 Cost effectiveness 54
3.9.1 Navigation charges 54
3.9.2 Air Navigation Costs 55
3.10 Cooperation 57
3.11 Training 59
3.12 Financing 59
3.13 CNS and Aviation weather management issues
60
3.13.1 Shortcomings of conventional systems 60
3.13.2 ASECNA's systems' performance 64
3.15 Conclusion 69
Chapter 4 CNS/ATM systems and concepts 70
4.1 Introduction 70
4.2 Suitable CNS/ATM systems for ASECNA 72
4.2.1 Geographic characteristics 72
4.2.2 Efficiency 72
4.2.3 Capacity for Safety 73
4.2.4 Surveillance 73
4.3 Study of selected systems 73
4.3.1 Communications 73
4.3.2 Navigation 83
4.3.3 Surveillance 92
4.3.4 Air Traffic Management 97
4.4 Transition phase 98
4.6 Affordability 99
4.7 Conclusion 100
Chapter 5 Analysis of ASECNA's modernization strategy
102
5.1 Description of the strategy 102
5.1.1 Communications 102
5.1.2 Navigation 103
5.1.3 Surveillance 103
5.1.4 Systems on board the aircraft 105
5.1.5 Aviation weather 105
5.1.6 Air Traffic Management 106
5.1.7 Cooperation 107
5.1.8 Training 110
5.1.9 Financing 110
5.1.10 Implementation schedule up to 2015 112
5.2 Analysis 113
5.3 Conclusion 115
Chapter 6 Recommendations and Conclusion 117
References 122
Appendix 1 Presentation of ASECNA 126
Appendix 2: Ground Based Navigation Systems Principles
130
1 How the VOR works 130
2 How DME works 132
3 How ILS works 133
4 Multilateration 134
Appendix 3 WGS-1984 136
Appendix 4 ASECNA'S Telecommunications Network
137
Appendix 5 Air Traffic Projected Growth by world region
138
Appendix 6 ICAO's Navigation SARPs 139
Appendix 7 ASECNA's Satellite Navigation Circuits
140
Appendix 8 ASECNA'S ATS/Direct Speech Network
141
Appendix 9 CNS/ATM: Drivers and Origins 142
List of Figures
Chapter 1
Figure 1.1 Short term evolution of crude oil 2
Figure 1.2 Analytical Framework of ASECNA's performance analysis
5
Chapter 2
Figure 2.1 ASECNA area in this report 10
Figure 2.2 Share of population and GDP by country 12
Figure 2.3 Stakeholders 15
Figure 2.1 Repartition of Aircraft types in Africa 18
Figure 2.2 Intra African market Fleet (Jets + Turbo Propellers)
19
Figure 2.3 African fleet annual utilization 20
Figure 2.4 African fleet Evolution from 2003 to 2023 21
Figure 2.5 RPK, ASK (Billion) and Passengers load factors in
Africa 21
Figure 2.6 Trend in Aviation fuel cost 23
Figure 2.7 Yields and Unit costs in Key markets 23
Figure 2.8 African Airlines 1 Operating costs (Unit
cost $ per tonne per Km) 24
Figure 2.9 Regional share of global international air passenger
traffic 26
Figure 2.10 Evolution of passenger traffic (1994-2003) 27
Figure 2.11 Average Airport Passenger Traffic (2000-2004) 28
Figure 2.12 Evolution of Cargo traffic (1994-2003) 31
Chapter 3
Figure 3.1 ASECNA's Flight Information Regions 37
Figure 3.2 Number of flights from 1993 to 2003 38
Figure 3.3 Number of aircraft movements at 15 key airports 39
Figure 3.4 Areas of Routing 41
Figure 3.5 Average number of flights controlled per hour and per
controller 43
Figure 3.6 Projected growth over the next decade 45
Figure 3.7 Projected runway occupancy in ASECNA's main airports
46
Figure 3.8 Projected controllers' productivity in 2015 47
Figure 3.9 Evolution of Air Proximities 48
1 Flight Equipment comprises maintenance, insurance, and rental.
The others operating expenses are not mentioned here. But it's interesting to
note that administration unit costs for non efficient airlines are extremely
high, almost twenty times higher than an efficient airline' unit costs.
Figure 3.10 Evolution of incidents during the last six years
49
Figure 3.11 Flight paths between Douala and Dakar 51
Figure 3.12 The different phases of a flight 52
Figure 3.13 Evolution of air navigation charges 54
Figure 3.14 Personnel, ANS and transport costs from 1996 to 2003
55
Figure 3.15 Evolution of the average cost per flight from 1996 to
2003 56
Figure 3.16 Evolution of en route revenues from 1996 to 2003
57
Figure 3.17 Regional fragmentation of ATM sectors 58
Figure 3.18 Financial results from 1994 to 2003 59
Figure 3.19 OPMET availability rate 68
Chapter 4
Figure 4.1 Communication links in ASECNA 74
Figure 4.2 CPDLC test message 75
Figure 4.3 Estimated capacity gained as a function of % of CPDLC
equipage 76
Figure 4.4 Aeronautical telecommunications network concept 82
Figure 4.5 Comparison between EGNOS and GPS 85
Figure 4.6 Lateral and Vertical Total System Error 87
Figure 4.7 Comparison between RNAV, RNP and conventional
navigation 89
Figure 4.8 Atlanta SID trials: Non RNAV tracks 90
Figure 4.9 Atlanta SID trials: RNAV tracks 90
Figure 4.10 Projected RNP-RNAV capable aircraft 91
Figure 4.11 ADS-B operational capabilities 94
Figure 4.12 ADS-B performances Vs Radar 96
Chapter 5
Figure 5.1 Classification of CNS/ATM expenditure 112
Figure 5.2 Possible Airspace redesign by 2030 115
Appendices
Statutory structure 128
External representations' organisation chart 129
VOR station 131
World Geodetic System 136
ASECNA's Telecommunication Network 137
ASECNA's Satellite connectivity 140
ASECNA's ATS/DS network 141
Evolution of CNS/ATM implementation 145
List of Tables
Table 2.1 Comparative GDP and Population 11
Table 2.2 Situation of aircraft operated in the world 19
Table 2.3 Daily passenger traffic between city pairs 29
Table 2.4 International traffic at major regional airports 30
Table 3.1 The main airstream in ASECNA 40
Table 3.2 Traffic by FIR 40
Table 3.3 Average traffic density from 2001 to 2003 42
Table 3.4 Average traffic density by 2015 46
Table 3.5 Average ANS cost per flight in Europe, ASECNA and the
USA 56
Table 3.6 Equipments availability 65
Table 3.7 Air circulation control: controlled routes 67
Table 4.1 Workload reduction as a function of aircraft equipage
77
Table 4.2 Delays reduction as function of aircraft equipage 77
Table 4.3 Results for lateral and vertical accuracy with EGNOS
87
Table 4.4 Results for availability during trials Vs ICAO's SARPs
87
Table 4.5 ICAO's SARPs for lateral and vertical accuracy 87
Glossary A
ACC Area Control Centre
ADS Automatic Dependent Surveillance
ADS-B Automatic Dependent Surveillance Broadcast mode
ADS-C Automatic Dependent Surveillance Contract mode
AFI Africa Indian ocean area
AFS Aeronautical Fixed Service
AFTN Aeronautical Fixed Telecommunication Network
AIS Aeronautical Information Service
AMS(R) S Aeronautical Mobile-Satellite (R) Service
AMHS Aeronautical Mobile Handling System
AMSS Aeronautical Mobile-Satellite Service
ANSP Air Navigation Service Provider
AOC Airline Operation Centre
APIRG AFI Planning and Implementation Regional Group
APV Approach with vertical guidance
AR Area of routing
ASECNA Agency for Security, Aerial Navigation in Africa and
Madagascar
ASM Airspace Management
ASK Available Seat Kilometre
ATC Air Traffic Control
ATFM Air Traffic Flow Management
ATM Air Traffic Management
ATN Aeronautical Telecommunication Network
ATS Air Traffic Services
ATS/DS Air Traffic Services Direct Speech
C
CDM Collaborative Decision Making
CDMA Code Division Multiple Access
CFIT Controlled Flight Into Terrain
CNS/ATM Communications, Navigation, Surveillance / Air Traffic
Management
CPDLC Controller pilot data link communications
D
DECCA A low frequency hyperbolic radio navigation system
DFIS Data Link Flight Information Services
DME Distance Measuring Equipment
E
EGNOS Eurpean Geostationary Navigation Overlay Service
EUR European Region
EUROCAT Thales ATM (Commercial organisation) air traffic
management
automation product
F
FAF Final Approach Fix
FANS Future Air Navigation Systems
FIR Flight Information Region
FDPS Flight Data Processing System
FL Flight Level
FMS Flight Management System
G
GLONASS Global Orbiting Navigation Satellite System (Russian
Federation)
GNSS Global Navigation Satellite System
GPS Global Positioning System (United States)
H
HF High Frequency
HFDL High Frequency Data Link
I
IATA International Air Transport Association
ICAO International Civil Aviation Organization
IFR Instrument Flight Rules
ILS Instrument Landing System
INS Inertial navigation system
ITU International Telecommunication Union
L
LORAN Long Range Air Navigation
M
MET Meteorological services for air navigation
METAR Aviation routine weather report
MLS Microwave Landing System
MODE S Mode Select
N
NDB Non-directional beacon
NOTAM Notice To Airmen
NPA Non-precision approach
NSE Navigation System Error
O
OPMET Operational Meteorology
P
PDN Paquet data Network
PIRG Planning and Implementation Regional Group
R
RIMS Ranging Integrity Monitoring Station
RNAV Area Navigation
RNP Required Navigation Performance
RPK Revenue Passenger Kilometre
RTK Revenue Tonne Kilometre
RVSM Reduced Vertical Separation Minimum
S
SAM South American Region
SARPs Standards and Recommended Practices
SAS Scandinavian Airways
SAT South Atlantic
SATCOM Satellite Communication
SBAS Satellite-based augmentation system
SID Standard Instrument Departure
SIGMET Significant Meteorological event
SIGWX Significant Weather
SITA Société Internationale de
Télécommunications Aéronautiques
SSR Secondary Surveillance Radar
T
TACAS Terminal Access Controller Access Control System
TACAN Tactical Air Navigation
TAF Terminal area forecast
TDMA Time Division Multiple Access
TMA Terminal Manoeuvring Area
TSE Total System Error
V
VDL VHF Data Link
VFR Visual flight rules
VHF Very High Frequency
VOR VHF Omnidirectional Radio Range
W
WGS-84 World Geodetic Reference System 1984
Chapter 1 : Introduction to Thesis
The aim of this chapter is to introduce the research topic and to
present the objectives and the methodology used to respond to the research
question.
1.1. Background
Agency for Air Navigation Safety in Africa
(ASECNA1) is a regional publicly held establishment that provides
navigation services to 15 West and Central African Countries2, plus
Madagascar and the Comoro islands in the Indian ocean.
The region is relatively poor. Economic characteristics are those
of developing countries. Some of the less advanced countries are located
there.
ASECNA covers an area of 16 million square
kilometres3, most of which is unoccupied and dominated by the Sahara
desert, oceans and forests.
The Air Transport Industry has changed significantly over the
past decade. These changes were dictated by a combination of factors, mainly
operational and financial, following a succession of crisis4. The
airline industry is increasingly sensitive to the cost of doing business.
Efficiency
Air carriers demand direct routes, flight level optimization,
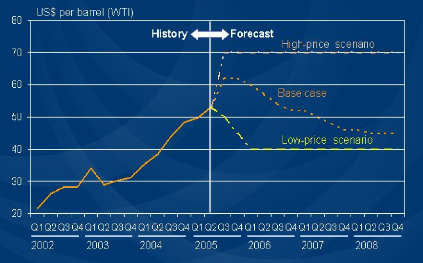
efficient in-flight and improved en-route fuel5 consumption. Figure
1.1 below shows the projected upwards evolution of crude oil prices. That means
airlines' fuel bill will significantly increase. Cost reduction is one aspect
of mitigating the effects of fuel high price. It explains why airspace users
want more efficiency. It is one of the factors that led them
to incite suppliers, such as air navigation service providers (ANSP) to improve
their effectiveness and the quality of service provision.
1 In the present study designates both the agency or the
geographic region
2 Benin, Burkina Faso, Cameroon, Central African Republic, Chad,
Congo Brazzaville, Equatorial Guinea, Gabon, Ivory Cost, Mali, Mauritania,
Niger, Senegal, Togo. France is also an observer member.
3 Equivalent to almost 66 times Great Britain size.
4 September Eleven, SARS, Bird Flu, Second Golf War...
5 Crude oil price was around 50 dollars per barrel in 2005
Figure 1.1: Short-term evolution of crude oil
prices
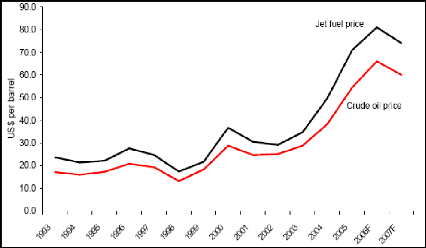
Source: IATA, 2006
Capacity
Air travel and air traffic are continuously growing. The
number of aircraft movements has increased by 5.3 per cent per year on average
over the past 15 years in ASECNA region, which is in line with worldwide
trends. The growth is forecast to continue at an estimated yearly pace of 5 per
cent. That activity means an increasing pressure will be put on airports and
air navigation systems, which may raise airspace and airport capacity
concerns.
Safety
Safety records are worrying in Africa. The
continent represents only about 3 per cent of global traffic.
Nevertheless, statistics show that almost one third of fatal
accidents over the past ten years occurred in Africa according to
IATA.
Air Transport is a catalyst for development and trade.
Efficiency, Capacity and Safety of air navigation systems are
therefore strategic components for a viable regional6 air transport
industry and growing national economies.
The important question is whether ASECNA will manage to
overcome the current and future challenges. Will they respond to users'
requirements while delivering a safer service, in the interest of regional air
transport?
The agency has embarked on a modernisation programme since
1994. It is implementing modern air navigation systems, known as Future Air
Navigation Systems (FANS) or CNS/ATM (Control, Navigation, Surveillance and Air
Traffic Management).
CNS/ATM systems are a complex and interrelated set of
technologies and concepts largely based on satellite communication. They are
the response brought forward by the aviation community, under the aegis of the
International Civil Aviation Organisation (ICAO), in response to the challenges
described above. Regional work groups have been put in place to coordinate
efforts. ASECNA is member of AFI7 Planning and Implementation
Regional Group (APIRG), which regroups African and Indian Ocean countries
The thesis intends to investigate current systems' performance
in ASECNA. It highlights regional shortcomings and needs, and examines the
agency's modernisation strategy, CNS/ATM adopted solutions, and their
implications on service provision for the next 15 years.
1.2. Research Questions
The main research question of the thesis is: Will ASECNA meet
the needs of African Air Navigation for the 21st Century?
Responding to that question requires that the following
intermediate questions are dealt with:
6 ASECNA region
7 Africa and Indian Ocean
1. What are the needs and the priorities of African Air
Navigation for the 21st century?
2. Are CNS/ATM systems the suitable tool with regard to regional
characteristics?
3. Will ASECNA's modernisation strategy respond effectively to
the needs?
1.3. Objectives
The objectives of the study are to:
1. Examine the state and the performance of air navigation
service provision in
ASECNA
2. Study the potential benefits of CNS/ATM systems to the
region
3. Analyse ASECNA's modernisation plans
1.4. Methodology
This research is based on an analytical approach to assessing
ASECNA's capability to respond to airspace users' needs and requirements and
regional air transport's interests. To answer to the first research
question that aims at defining the needs and the priorities of African
Air Navigation, we process as follows:
First, the region's air transport industry is assessed.
This is done by examining local air transport characteristics:
1. Analysis of air travel demand
2. Assessment of air carriers types
3. Examination of air carriers performance
4. Examination of airport and alternative transport
infrastructures
5. Overview of regulations and the factors that influence air
traffic.
Secondly, the air navigation system's performance is
studied, by analysing key performance areas and related indicators:
Chapter 1 Introduction to Thesis
1. Traffic demand, Capacity, Delays
2. Complexity, Safety, Aircraft proximities
3. Performance of CNS and Met systems.
4. Fragmentation, Cost Effectiveness
5. Flight efficiency
6. Cooperation.
The analytical framework used is described in figure 1.2
below. The structure is based on a model developed by the Eurocontrol
Performance Review Commission to assess European Air Traffic Management
performance. It has been adapted for the present study.
Figure 1.2: Analytical Framework of ASECNA's performance
analysis

Performance
Drivers
Performance
indicators
ANS Key
performance Areas
Service
provision
cost
Flight
Efficiency
Fragmentation
Cooperation
Safety
Complexity
Traffic demand
AIRPROX
CNS Met
Systems
Availability
Delays
Productivity
Capacity
Cost
Effectiveness
ASECNA performance
Source: Eurocontrol, Performance Review Report 8, 2005
Finally, the impact of traffic growth is estimated. We apply
forecasted growth rates to current data, in this case 2003.
To answer to the second research question, which
aims at determining the relevance of CSN/ATM systems in ASECNA, we adopt the
following method:
Based on the system's deficiencies and local characteristics
drawn from the previous performance analysis:
1. Identification of potentially suitable CNS/ATM
technologies and systems based on FANS performance during worldwide trials.
These trials are performed under certain geographic and operational conditions;
some of them match ASECNA area's characteristics.
2. Their affordability is assessed At last, the third
research question is dealt with as follows:
1. Assessment of the technology solutions adopted
2. Assessment of the implementation process, and we analyse the
strategies in the areas listed below:
a. Communication
b. Navigation
c. Surveillance
d. Met
e. Air Traffic Management
f. Training
g. Programme financing
h. Cooperation
3. Assessment of the timeframe by confronting the predicted
timetable and realized projects.
When quantifiable data are not available, interviews allow to
have an idea of the situation. Interviewees are ASECNA's high profile staff,
airlines directors, and other ANSPs' personnel.
1.5. Structure of Thesis
The choice of performance areas is discussed in chapter 1. The
overview of ASECNA region's air transport industry is discussed in Chapter 2.
An insight of regional characteristics is given, which provides a better
understanding of the operational environment and the context, as well as the
importance of a performing air navigation system for the region. A detailed
analysis of air navigation systems' performance is provided in Chapter 3. Local
navigation characteristics are discussed, and predefined performance areas
presented in chapter 1 are examined. That allows highlighting the areas that
require improvements and to define what should be the priorities for the
region. Chapter 4 presents CNS/ATM systems and concepts and looks at their
potential benefits, with regard to local characteristics. Finally, the strategy
adopted by the agency to respond to those priorities is examined in chapter
5.
1.6. Data Sources
The instruments for this study include a one
week visit to ASECNA's headquarter in Dakar, Senegal, to collect data and
documents, to discuss with professionals involved in daily operations and to
observe the actual state of the implementation of the strategy on the ground.
Telephone interviews, email-statements, internet documentation are intensively
used. Key internet documents come from ICAO, ASECNA, IATA, and
CANSO8's CNS/ATM related literature.
1.7. Key Assumptions
The geographic boundaries of the study are clearly the region
covered by ASECNA. However, as ASECNA9 is part of the wider
geographic entity, the study of this region naturally implies to investigate
its interactions with the neighbourhood.
8 Civil Air navigation Services Organisation
9 Seen here as a region, not the organization itself
A key assumption in the study is that average economic and air
traffic prospects that are applicable to the African continent are applicable
to ASECNA. This is a sensitive approach as the economic characteristics of the
region are similar to the continent's patterns. However, the average growth
figures may be driven up by air transport leading countries. In particular, air
transport is less developed in ASECNA then Southern, Eastern Africa, and North
Africa.
Another key assumption is that the relative importance of
individual countries' air transport performance is frozen over the period
studied. Therefore, the relative importance of airports size and spatial
distribution of traffic flows within the region is supposed to remain
unchanged.
1.8. Choice of performance indicators
A large number of indicators could be used to assess ASECNA's
performance. How ever, for this study, several factors influenced the choice of
indicators:
The availability of data: several other indicators
could have been used but ASECNA does not collect the corresponding data.
Moreover, some chosen indicators could have been broken down into more detailed
data, but that has not been possible.
The effectiveness of chosen indicators in assessing an
ANSP's performance:
Safety, Capacity, Flight efficiency, Cost Effectiveness, cross
border cooperation are aspects of an ANSP operation that effectively evaluate
the quality of service provision.
Safety
Safety performance measures are hardly available in ASECNA.
However, indicative incidents reports are used to assess the safety level. A
comparison with other Regions' safety records with respect to the level of
traffic gives an idea of ASECNA's performance.
Capacity
Capacity is closely related to delays and the level of traffic.
Although delays data are not available, interviews allow having an idea of
influent factors.
Chapter 1 Introduction to Thesis
Flight Efficiency
The availability of a maximum number of direct routes and the
possibility to chose optimum flight levels are crucial to airlines as it allows
reducing their fuel bill.
Cost effectiveness
The bill paid by airlines for service provision depends on
ASECNA's ability to maintain low operating costs.
Cooperation
The level of technical and political cooperation indicates how
states and ANSPs work together to avoid unnecessary costs to airlines, and make
the airspace as seamless as possible.
1.9. Summary
This chapter laid the foundations for the thesis. It
introduced the research problem and questions: Will ASECNA meet the needs of
the African Air Navigation for the 21st century? In addition, what
are the problematic and the challenges related to the achievement of that
mission? The research was justified, and the methodology, based on an
analytical approach was detailed. Performance indicators have been presented
and discussed. Key assumptions were presented.
Chapter 2: ASECNA's Air Transport Industry
The aim of this chapter is to find out the region's air
transport industry's characteristics. This is an important step as it helps to
understand in which environment ASECNA evolves, and the factors that may
influence its activities. Further details on ASECNA as an organization and its
history are included in appendix 1.
Figure 2.1: ASECNA area in this report
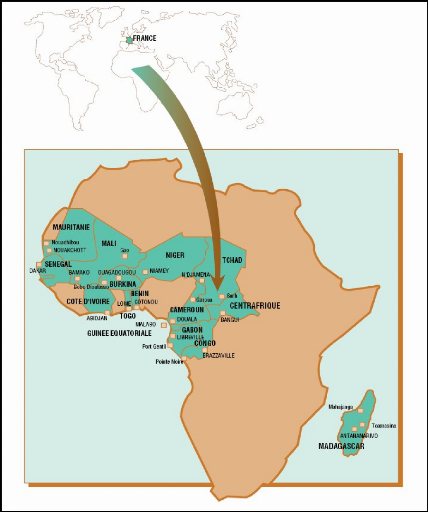
Source: ASECNA
2.1 Economic Characteristics
ASECNA comprises developing countries, mainly located in
western or Central Africa, except Madagascar and the Comoros Islands located in
the Indian Ocean (See map above). Their Economies are relatively weak. Mali,
Niger, Chad, Burkina Faso Togo and the Central African Republic (CAR) are among
the poorest country in the world. The general picture is one of
underdevelopment, political instability, economic volatility and high poverty.
Comparative Gross Domestic Products and populations between ASECNA, the world
average and UK's performance reflect that situation (Table below).
|
Region
|
GDP
($ billion)
|
GDP /Capita
($ thousand)
|
Population
(million)
|
|
ASECNA1
|
93
|
1.7
|
141
|
|
WORLD
|
43920
|
9.5
|
6,526
|
|
UK
|
2218
|
31
|
60
|
Table2.1: Comparative GDP and
populations;
Source: CIA World fact book, 2006
The region accounts for just 0.2 per cent of world
GDP. But in contrast to its low share of economic activity worldwide,
as the table above shows it, 141 million people live in ASECNA, which is 2.2 %
of world population. That combination of low input and high population means
the GDP per capita in ASECNA is the lowest among the world regions (1700
dollars). UK for instance is 24 times wealthier, and its GDP per capita is 26
times ASECNA's average. 46 per cent of the population lives under the poverty
line in the region.
Countries in ASECNA remain to a large extent producers of raw
materials. They export agricultural goods such as coffee, cocoa and cotton, or
mineral such as crude oil and copper. Trade exchanges in ASECNA region tend to
be dominated by agricultural exports.
1 Data compiled from CIA world Fact book 2006
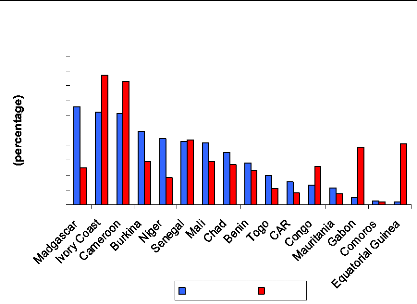
However, economic development is not
homogeneous within the region. Noticeable disparities between
countries exist. For example, while Equatorial Guinea represents only 0.4 per
cent of regional population, it accounts for 8.3 per cent of GDP. In contrast,
Madagascar that contains 13 per cent of total population accounts only for 4.9
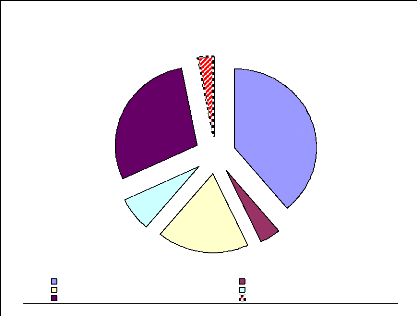
per cent of regional GDP. (Figure 2.2)
Figure 2.2: Share of Population and GDP by
country
20
18
16
14
12
10
8
6
4
2
0
% Population %GDP
Source: CIA fact book 2006
Ivory Coast, Cameroon, Senegal, Gabon and Equatorial Guinea
account for almost 60 percent of ASECNA GDP and one third of the population,
while Comoros, Niger, Mauritania, Togo, and CAR own 9.3 per cent of GDP and
host 20 per cent of population.
Regional integration processes are on the
way. ASECNA members countries located in West Africa are part of ECOWAS
(Economic Community of West African States). Those located in Central Africa
are members of CEMAC (Central Africa Economic and Monetary Union). The level of
integration varies significantly. The ECOWAS is much more advanced than the
CEMAC. But the two entities are confronted to the economic
disparities described above, which slow the pace of
integration. The lack of a real political will in CEMAC, or persisting
political instability and civil wars in key countries such as Ivory Coast, and
the Republic of Congo have also had a damaging impact on regional economic and
political integration.
In other respects, bad Governance is a common
practice at the state level and in public companies. States continue to own a
high number of companies in strategic sectors such Telecommunications, Water,
Energy and Transports, although privatisations are spreading across the region,
mainly on the basis of International Monetary Funds Recommendations (IMF). It
is generally admitted that state ownership, «poor management and
monitoring, and anti-competitive arrangements have bred corruption in
Africa» and particularly in the ASECNA area (Morrell, 2005)
These factors, combined with the low level of investments
(Foreign Direct Investments are among the lowest in the world), contribute to
explain the underdevelopment of basic infrastructures, particularly in the
transport sector.
2.2 Transport infrastructure
2.2.1 Roads
Roads are the predominant mode for freight and pas senger
transport in Africa (World Bank, 2005). But within individual countries, very
often, only the main cities are linked by paved roads. Regional interconnection
is very limited. There are only 3 9,000 Kilometres of paved roads in the entire
region, which represents 18 percent of total road network. Moreover, these
roads are often in a relatively bad state due to poor maintenance. In
comparison, UK alone has 392,931 Kilometres of highways, which is ten times
more. That situation renders economic exchanges very difficult and slows their
intensity as well as it limits regional integration.
2.2.2 Railways
Railway links are very poor or do not exist within and between
countries. Two third of the actual rail infrastructure were inherited from the
colonial period (OEDC, 2005, P.22).
There are only 8228 Kilometres of railways in ASECNA countries
(17300 in the UK). Some states such as Niger, Chad, Equatorial Guinea, Comoros,
and CAR have simply no railway infrastructure, which means their economic
activity depends heavily on the road system.
2.2.3 Ports
There are a dozen key ports in ASECNA. The most important of
them is Dakar, with about 10 millions tonnes of goods. The essential of ASECNA
countries trade activities is carried out through these ports. For instance, 98
per cent of exchanges between Cameroon and the outside world are done through
Douala autonomous port, with about 5.2 millions tonnes per year (Mission
Economique, 2006)
But, the reliability and the speed of exchanges of goods and
mobility of people is a crucial factor for regional integration. Given the
under performance of road, and rail systems, and the slowness of sea transport,
the availability of an adequate air transport infrastructure is therefore of
paramount importance for ASECNA countries as they try to integrate into the
world economy.
2.3 Air Transport industry
A developed air transport industry is a driving force for
economy, and a catalyst for development and trade. It facilitates exchanges
between countries in which air transport substitutes, the road
and rail systems are underdeveloped.
Passenger aviation is the principle mean of transport for
business and tourism travellers. Airports link the movement of passengers and
goods to national economies; they serve as a primary hub for the tourism
industry, and as key logistical centre for international trade.
Stakeholders in ASECNA are the states, airlines, ANSPs,
airports and international institutions. The study focuses on the relation
between ANSPs and other stakeholders (Figure 2.3).
States are represented by civil aviation authorities and
Governments. They make air transport policies, on the basis of strategic
objectives, through legislations applying to all the others stakeholders in the
region.
Airlines are of different types: International, Domestic, and
Regional. Both ASECNA originated airlines and the others are considered.
Airports are divided into main and secondary airports.
The region only air navigation service provider is ASECNA. The
institution has links with others neighbouring ANSPs.
Figure 2.3: The stakeholders2

Policy Makers
Governments
Civil
Aviation
Authorities
Air Travel
Customers
Other ANS
Providers
Policy
Objectives
Cooperation
Airlines
Domestic
Regional
International
Legislations
Institutions
Air Navigation
Provider
ASECNA
Performance
Airports
Main
Secondary
2.3.1 Airport Infrastructure Main
Airports
The airport infrastructure (airstrips, air terminals, aircraft
hangars) of ASECNA member states comprises about 25 international airports
(2400 to 3500 m of tarred runways) regularly used. The main airports are Dakar,
Abidjan, Douala, Libreville, Brazzaville and Antananarivo. They are served by
major regional, continental and intercontinental airlines. The service provided
is acceptable, but is far from being good.
The airport sector is not free from financing, safety and
security problems. Built for the
most part in the 1960s and 1970's, they
present deficiencies. These vary from State to
State.
Runways are generally in a bad state, taxiways and parking
areas are often
2 All the stakeholders are not taken into account:
Ground Handling, Maintenance, Catering... etc
unsuitable; passenger terminals are cramped
or saturated in peak hours. There are insufficient cargo hangars, refrigerating
warehouses and fencing (African Union, 2005). There are needs for the updating
of these installations to meet international standards. The inexistence of
airport fences or in disrepair poses serious security and safety problems.
Secondary Airports
The region counts about 150 domestic airports (runways of 1000
to 2000 m, usually unpaved) and about 200 other national aerodromes (poorly
maintained), with for several of them inexistent traffic. These airports do not
often have adequate navigation aids, or basic airport commodities, which
constrains their accessibility.
2.3.2 Airlines
In West Africa, and particularly in ASECNA, the liquidation of
Air Afrique after 40 years of existence marked the end of a symbol of African
airline integration.
Data from Air Transport Intelligence show that nearly
81 per cent of airlines serving ASECNA are African. 50 per cent are from member
states and 31 per cent from other continents.
The main local carriers are Air Madagascar, Air Senegal
international, Cameroon Airlines, Air Gabon, Air Ivoire, Air Burkina, Air
Mauritania, Air Togo, and Toumai Air Tchad.
Domestic Airlines
The poor domestic markets are served by national carriers or very
small companies of which the fleet is often constituted by a single
aircraft.
Regional Airlines
Air Senegal International, Bellview (Nigeria), Air Ivoire,
Cameroon Airlines, Toumaï Air Chad and Air Burkina have put in a lot of
efforts to fill up the vacuum left following the demise of Air Afrique. These
airlines propose flights to travel within the region from and to the main
cities in the regions.
International Airlines
The region can be divided into two groups of countries:
1) Those that no longer have national long-haul carriers with
their market largely dominated by foreign companies.
2) Countries that still have national airlines but these are
facing strong competition from foreign companies (Cameroon, Gabon, and
Madagascar).
Local Airlines
Cameroon Airline, Air Gabon, Air Madagascar and Air Senegal
International are the three main local flag carriers. They link the respective
countries to Africa and mainly Western Europe and less regularly the Middle
East (During the hajj3)
Foreign Airlines
Air France-KLM is the dominant carrier on the long haul
market. It serves all ASECNA's main airports. Swiss, SN Brussels, Iberia,
Lufthansa and Alitalia also regularly flight to the region. An
important figure to highlight is the percentage of international traffic
ensured by Western airlines. In fact, according to ASECNA about 80 per cent of
the commercial traffic is operated by these carriers4.
The Libyan carrier, Afriqiyah Airways is now operating to most
of the defunct Air Afrique member countries transforming Tripoli into a hub for
passengers connecting to Europe and the Middle East. Tunisia has also started
flying to Bamako and Abidjan. Royal Air Maroc (RAM) has opened routes to Dakar,
Douala and Gabon.
Ethiopian, South African Airways, Kenyan Airways and Air
Inter5 also have regular connections with ASECNA.
2.3.3 Fleet
A study by Boeing showed that about 75 per cent of African
fleet is composed by
regional jets or single aisle aircraft (Boeing, 2005).
This does not take into account
secondary airports exclusively exploited by
very small aircraft (Less than 30 seats).
3 Pilgrimage to Mecca
4 Air France-KLM, TAP, Alitalia, SN Bruxels, SWISS,
Iberia, Lufthansa...
5 South African carrier
Most intra African routes are operated with narrow bodies, or
very small jets or turbo propellers.
Figure 2.4: Proportion of Aircraft types in
Africa
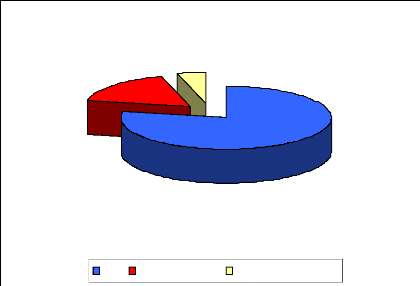
415
78%
92
17%
24
5%
Jets Turbo PropellersSmall size aircraft
Source: Afraa, 2005
Figure 2.5: Intra African market Fleet (Jets + Turbo
Propellers)
Source: Ambraer, 2006
|
New
|
Average
|
Old
|
Total
|
% of Old
|
|
Africa
|
162
|
111
|
316
|
589
|
54
|
|
America
|
1654
|
2581
|
1301
|
5536
|
24
|
|
Europe
|
1768
|
1363
|
237
|
3368
|
7
|
|
Asia
|
1154
|
969
|
295
|
2418
|
12
|
|
Middle East
|
240
|
144
|
155
|
539
|
29
|
|
Pacific
|
155
|
102
|
15
|
272
|
6
|
|
WORLD TOTAL
|
5371
|
5529
|
2712
|
13 612
|
20
|
Table 2.2: Situation of aircraft operated in the
world
Source: African Union, 2006
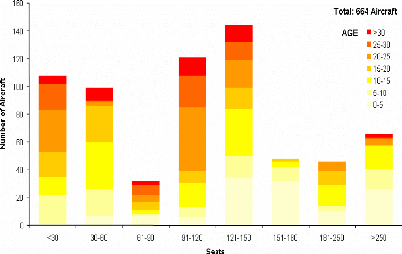
About 54 % of aircraft operated in Africa are considered to be
old or very old. Nearly 45 % of aircraft are more than 15 years old. 20 % are
between 10 and 15. 13 % are aged between 5 and 10. Around 22 % are less than 5
years olds (figure 2.5). The average age of the fleet is comprised
between 16 and 20 years old. A large proportion of aircraft still
operated are aged over 25 and even 30. These aircraft are largely fuel
inefficient.
Figure 2.6: African fleet annual utiization
2500
2000
3000
1500
1000
500
0
(Flights Hours per Aircraft)
Fleet age (Years)
45
40
25
20
35
30
5
0
15
10
TP20 TP35 J35 J44 TP50 J50 TP70
J70 J80 J100 J120 J150 J175 J250 J>300
African annual fleet utilization African Fleet Average Age
Source: Ambraer, 2006
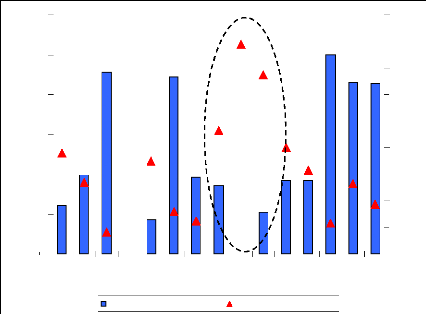
The average annual utilization is 1167 hours per aircraft. There
is a strong correlation between fleet utilization and fleet age (Coefficient of
correlation equal to «- 0.8»).
Figure 2.7: African fleet Evolution from 2003 to
2023

392
Growth
309
Replaced
332 Stay
60
641 aircraft
701
Source: Airbus, 2005
Airbus estimates that African airlines will take delivery of
about 641 new aircraft to replace the current fleet or to sustain growth
(Figure above).
2.3.4 Performance
Figure 2.8: RPK, ASK (Billion) and Passengers load
factors in Africa
Source: AFRAA, 2005
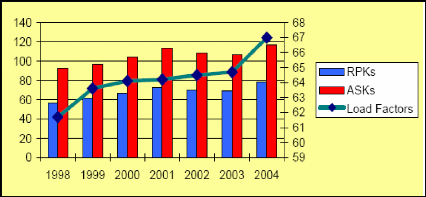
Load factors, RPK and ASK are improving. But the overall
industry's health remains critical in Africa. Load factors may look remarkably
high, but they highlight the airlines' dilemma in the African operating
climate. The problem is that break even load factors remain higher.
Financial Performance
A sample of 8 airlines serving ASECNA region, comprising South
African Airways, Royal Air Maroc, Ethiopian Airlines, Kenya Airways, Air
Mauritius, Bellview airways, and Tunisair, made a net profit of over $200
million in 2005 (AFRAA, 2005, p.4). These are encouraging and remarkable
results in a world where airlines made huge losses in the recent past But they
do not reflect the real picture of the industry's performance. Most airlines,
some very small, some bigger, are facing serious difficulties.
Excessive debts, uncoordinated operating networks,
liquidation, bankruptcy, are examples of discrepancies generally observed
(African Union, 2005). Airlines post very poor financial results. The
issue of profitability is crucial in the region: as the market
is narrow; it is difficult for local airlines to raise the necessary investment
required by the standards of modern airlines. These airlines often
operate the same routes. That competition leads to a price war resulting merely
in weakening the economic health of these companies which have difficulties in
covering their operating costs. Air Afrique6 best
represents the airline industry's situation in the area. Air Afrique
officially lost 194 million dollars between 1984 and 1996. It almost
never made significant profit. In 2002, after years of financial crisis, the 11
states that owned the pan-African airline decided to file for bankruptcy. The
Bankruptcy came after the failure of a restructuring plan brokered by the World
Bank.
The Yaoundé treaty countries have revised their
national carriers by designating them as the flag carriers. But they are left
under the control of private interests, like Air Ivoire, Air Senegal
International, Toumaï Air Chad... etc. Cameroon Airlines and Air Gabon,
once the two leading carriers in the region, are now being liquidated or
privatized.
High Fuel prices
Fuel price is constantly rising. Fuel represents on average 25
per of operating costs. One
barrel costs on average 70$ world wide and up to
90$ in Africa (2005). The trend is
6 Air Afrique was established in 1961 to provide
passenger and cargo service within the 12 West African Nations of Benin,
Burkina Faso, Central African Republic, Cote d'Ivoire, Congo, Mali, Mauritania,
Niger, Senegal, Chad, Togo & Guinea Bissau.
expected to last. These sky-rocketing fuel prices are devastating
the industry. As airlines are struggling to improve their bottom lines, fuel
efficiency is critical.
Figure 2.9: Trend in Aviation fuel cost
Source: Airbus, 2005
Yields and Unit Costs
Figure 2.10: Yields and Unit costs in Key
markets
14,0

|
12,0
|
|
|
|
|
|
|
|
|
|
|
|
|
|
|
|
|
10,0
|
|
|
|
|
|
|
|
|
|
|
|
|
|
|
|
8,0
|
|
|
|
|
|
|
|
|
|
|
|
|
|
|
6,0
|
|
|
|
|
|
|
|
|
|
|
|
|
|
|
|
|
|
|
|
|
|
|
|
|
|
|
|
|
4,0
|
|
|
|
|
|
|
|
|
|
|
|
|
|
|
|
|
|
|
|
|
|
|
|
|
|
|
|
2,0
|
|
|
|
|
|
|
|
|
|
|
|
|
|
|
|
|
|
|
|
|
|
|
|
|
|
|
|
|
|
|
|
|
|
|
|
|
|
|
|
|
|
0,0
|
|
|
|
|
|
|
|
|
|
|
|
|
|
|
|
|
|
|
|
|
|
|
|
|
|
|
|
|
|
|
|
|
|
|
|
|
|
|
|
|
|
|
|
|
|
|
|
|
|
|
|
|
|
|
Europe Southern Europe Western Within Europe North Atlantic
Africa Africa
Yield Unit Cost Yield Cost Margin

Source: Airbus, 2005
Yields are declining and the margins remain low. The Southern
Africa - Europe market has the lowest unit cost but also the lowest yields, and
the lowest margins. Europe - Western Africa is a healthy market for efficient
airlines, mainly European, with relatively high yields. Yields are also low in
the domestic market. The industry is not expecting a significant improvement of
yield.
Most African airlines are inefficient. This results into high
unit costs as the figure below shows it. These airlines possess old fleets
which are highly oil-consuming. High unit costs reflect low aircraft
utilization rates, high maintenance, rental and insurance costs. High air
navigation and airport unit costs reflect their old avionics, and their low
aircraft utilization.
Figure 2.11: African Airlines 7 Operating
costs (Unit cost $ per tonne per Km)
0,5 0,4 0,3 0,2 0,1
0
0,6

Fuel & Oil Flight Equipment Airport and Navigation
Charges
Avg inefficient Airline Avg Efficient Airline Avg Efficient
Worldwide

Source: Airbus, 2005
7 Flight Equipment comprises maintenance, insurance,
and rental. The others operating expenses are not mentioned here. But it's
interesting to note that administration unit costs for non efficient airlines
are extremely high, almost twenty times higher than an efficient airline' unit
costs.
2.4 Regulatory
In the absence of valid local carriers, ASECNA states have
liberalized their skies because bilateral agreements (Principle of reciprocity)
are no longer functioning. Although the deregulation process is on the way,
with the ongoing implementation of the Yamoussoukro8 liberalisation
decision, the open sky agreements, civil aviation codes are still obsolete and
not harmonised. Texts on competition are not fully applied:
Current regulations impose restrictions over the number of operating
airlines, and frequency and capacity.
Western carriers want more liberalization, and would like to see
the process speeded up, as they are in a position to dominate the market
further.
8 Ivory Coast, 1999
2.5 Air Travel demand
2.5.1 Traffic figures
Africa accounts for about 3% of global air traffic in term of
Passenger Kilometres performed (African Union, May 2005).
Figure 2.12: Regional share of global international
scheduled air passenger traffic
Europe Latin America and Caribbeans
North America Middle East
Asia Pacific Africa
587,998 (29%)
132,934 (7%)
Percentage share by region
( Passenger-kilometres
performed in millions, 2004)
354,353 (18%)
64,326 (3 %)
88,027 (4%)
785,828 (39%)
Source: UNESCAP, 20059
This situation reflects its low income, and the lack of air
transport infrastructure. This being said, the situation of air transport in
Africa is not uniform. It varies from one region to another. Northern, Southern
and Eastern Africa's air transport performance is good (Kenyan airways, South
African, Ethiopian and Royal Air Maroc). ASECNA area remains in a difficult
situation with less traffic and unreliable structures. ASECNA's figures show
that the region generates about 7 million passenger traffic per year (2003),
which is below what South Africa alone represents in term of annual air
passengers.
9 United Nation Economic and Social Commission for
Asia Pacific
Propensity to travel
Given the low level of incomes, and the widespread of poverty
across the region, the propensity to travel is very low. Moreover, the tariffs
are «very high», 20 to 30% higher than the rest of the world
according to the African Union. High air travel fares reflect the low level of
traffic, and limited load factors in most of the routes. Moreover, there are
little frequencies between city pairs. That increases aircraft operating
costs.
Passenger Traffic10
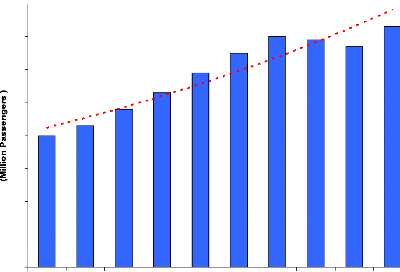
Figure 2.13: Evolution of passenger traffic
(1994-2003)
8,0
7,0
6,0
5,0
4,0
4,0
7,3
3,0
2,0
1,0
0,0
1994 1995 1996 1997 1998 1999 2000 2001 2002 2003
(Year)
Source: ASECNA, annual reports (1994-2003)
Passenger traffic has grown by about 75% from 1994 to 2003,
increasing from about 4 million to around 7 million in 2003.
This evolution is due to a sustained economic growth on the continent
and worldwide. Traffic recovery is particularly significant in some countries.
After recent political unrests in Madagascar and Congo, passenger traffic in
main airports grew respectively by 70 and 17 per cent between 2002 and 2003.
The increase of figures in the region is also driven by oil- related activities
in Chad and
10 Ässengers Traffic in ASECNA main Airports
Equatorial Guinea. The construction of the pipeline between that
country and the oceanic coast through Cameroon has stimulated traffic.
Passenger Traffic by Airport
Figure 2.14: Average Airport Passenger Traffic
(2000-2004)
Dakar (Senegal)
Abidjan (Ivory Coast)
Libreville (Gabon)
Douala (Cameroun)
Brazzaville (Rep Congo)
Antanarivo (Madagascar)
Pointe Noire (Rep Congo)
Bamako (Mali)
Malabo (Guinea)
Port Genrtil (Gabon)
Cotonou (Benin)
Yaounde (Cameroon)
Ouagadougou (Burkina)
LOME (Togo)
Nouakchott (Mauritania)
Ndjamena (Chad)
Niamey (Niger)
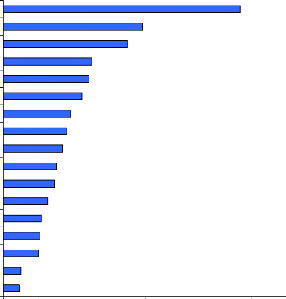
787
700
500
484
1336
0 200 400 600 800 1000 1200 1400 1600
(Thousand Passengers)
Source: ASECNA, annual reports (2000-2004)
Among the main airports, Dakar airport is the first in the
region with more than 1 million passengers per year. It's has been the fastest
growing airport in term of passenger volume. The important tourism activity in
Senegal is the major factor that explains this performance. The traffic is
globally increasing in other airports.
Secondary airports in ASECNA receive insignificant passenger
traffic and are often served by very small aircraft.
Domestic passenger traffic
Domestic markets are particularly poorly developed across the
region. People tend to travel by road or rail despite the poor state of the
network. Only the elite, and business men who can afford it, use air travel to
move within countries. Only Gabon has a relatively developed domestic market
with more than 340,000 passengers in 2003 (Bergonzi, 2006, P7).
Regional passenger traffic
While regional traffic has significantly increased within the
other African regions, it has stagnated in West and Central Africa from 1994 to
2001.
Political trips, seminars, regional emigration and business
travels are the main drivers of regional traffic. However, the mobility from
one country to another remains extremely difficult. It's sometimes easier to
reach another country within the region through Paris for instance. On the 276
regional city pairs, only 5 per cent of them have 150 passengers per day (table
below). The busiest city-pair is Abidjan - Dakar.
|
Daily passenger
|
Number of
city pairs
|
Percentage (%)
|
|
More than 150
|
14
|
5
|
|
70 - 150
|
28
|
10
|
|
30 - 70
|
69
|
25
|
|
10 - 30
|
69
|
25
|
|
Less than 10
|
96
|
35
|
Table 2.3: Daily passenger traffic between city
pairs.
Source: Délia Bergonzi, 2006
The most frequent connections in ASECNA are: Dakar-Bamako,
Dakar-Abidjan, Bamako-Abidjan, Douala-Libreville, and Cotonou - Pointe Noire.
They all have more then 100,000 passengers per year. Dakar and Abidjan are the
two destinations with the highest regional passenger traffic, performing
respectively 350000 and 200000 passengers per year (OEDC, 2005). Dakar has 15
direct links with others regional cities and Abidjan is directly linked to 12
others West African cities. The heaviest traffic flows are the Gulf of Guinea
(Abidjan-Accra-Lagos corridor), then the Dakar/Abidjan axis.
The lack of air links in the Central and
Western regions is at a damaging situation with the presence of a number of
landlocked states (e.g. Congo, Central African Republic, Chad, Mali, Niger),
where aviation is needed most.
International Passenger traffic
Almost 50% of passenger traffic (6 million out of 11 in 2003)
in western and central Africa is international. Traffic at major airports in
ASECNA is presented in table below.
|
2000
|
2001
|
2002
|
2003
|
|
Dakar
|
803.8
|
863.2
|
918.3
|
1005.6
|
|
Abidjan
|
744.6
|
6448
|
301.9
|
3127
|
|
Douala
|
198.8
|
252.9
|
246
|
283.5
|
|
Bamako
|
168.2
|
132.2
|
112.1
|
197.1
|
|
Antananarivo
|
198.2
|
209.9
|
98.5
|
176.1
|
|
Libreville
|
246.4
|
203.9
|
198.9
|
149.6
|
|
Malabo
|
42
|
64
|
73,9
|
100.2
|
Table 2.4: International traffic at major regional
airports (Thousand).
Source: ASECNA
In international traffic, for the West and Central Africa region,
and particularly in ASECNA, the dominant connection is towards Europe.
This traffic can be divided in 3 groups: The ethnic
Passenger Group, who has ties with the former European colonial powers,
France mainly, creates a natural emigration of workers in both directions
(South-North, North-South). The Leisure and Tourism group, concerns
high-income people who travel to Europe, America or Asia for reasons such as
shopping, Visits to family and friends. The Business travellers,
because of economic ties with Europe, and oil companies are also important
drivers for air traffic in the region. A large part of the traffic is also due
to governmental, non-governmental and international bodies' staff.
Traffic towards the Middle East is increasing, mostly due to
the attraction of Dubai and
pilgrimage to Mecca. North Africa / West and
Central Africa traffic is also increasing
due to the dynamism of Maghrebian airlines, which take a large
share of the 6th freedom11 traffic departing from Paris to
ASECNA.
There is also a significant traffic between African sub
regions and ASECNA, mainly towards South Africa. Traffic towards the United
States of America is carried out essentially via Europe.
Cargo Traffic
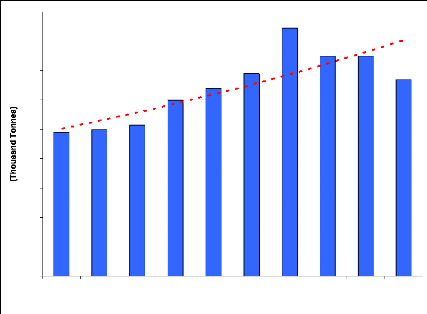
Figure 2.15: Evolution of Cargo traffic
(1994-2003)
1994 1995 1996 1997 1998 1999 2000 2001 2002 2003
(Year)
134
180
160
140
120
100
80
60
40
20
0
98
Source: ASECNA, annual reports (1994-2003)
Freight traffic has regularly increased from 1994 to 2000 due
to economic upturn. The
decrease observed since 2001 is
explained by a dramatic reduction of cargo traffic at
11 The right to carry passengers or cargo from a second country
to a third country by stopping in one's own country.
main cargo airports (Pointe Noire and Brazzaville in the republic
of Congo). But overall cargo traffic has increased by nearly 37 per cent since
1994.
2.6 Conclusion
The aim of this chapter was to introduce to ASECNA's air
transport industry, and to find out its main characteristics. This is what was
found.
1. ASECNA region is characterised by under development and
extreme poverty
2. Air Transport infrastructure is in a bad state or is largely
insufficient and the substitutes to air transport are poorly developed.
3. The airline industry is very weak, and mostly composed of
small aircraft
a. Local companies are facing economic and financial
difficulties
b. Operating costs are hit by soaring fuel costs, and low
aircraft utilisation
c. Yields and margins are low on the domestic market
d. Most local airlines are very small and very often
inefficient
e. The fleets are very old
f. The long haul and medium haul markets are dominated by
foreign carriers
g. The domestic market is insignificant
4. Air travel is still constrained
a. On the demand side by low incomes
b. On the supply side by regulations
5. Some changes are being observed
a. Aircraft manufacturers expect a fleet renewal over the next
years
b. Liberalization policies are slowly being adopted on the basis
of the Yamoussoukro decision
c. New entrants are expected, even low cost carriers
What do these characteristics mean for air navigation service
provision and for ASECNA?
The poor development of air transport substitutes means air
transport is crucial to ASECNA region and should be among the priorities. In
order to develop safely and orderly, the region's air transport industry needs
a reliable air navigation infrastructure and an adapted air navigation service
provision. Air transport cannot develop without these conditions.
Airlines facing difficulties need to improve their efficiency
to mitigate the effects of high fuel costs. With the very low level of yields
on the domestic markets and on some international routes, and given the ultra
competitive environment in a limited number of profitable routes in ASECNA, it
is unlikely that there is significant scope for a recovery in the yields in the
next years. Airlines are going to renew their assaults on costs according to
African Airlines Association (AFRAA). These include flying the shortest routes,
carrying optimum of fuel, cruising at optimum speed, minimizing flights at low
altitude during descend and climb. Therefore ASECNA must deliver enough
capacity and airspace flexibility to its customers
But efficiency also means that ASECNA must deliver a cost
effective service provision.
These airlines' fleets are often very old. Ageing fleet means
they are unable to cope with technological advancements and automation of
security and safety systems. However the fleet renewal expected by
manufacturers means higher speeds, and increased speed variability in ASECNA's
airspace.
The predominance of foreign carriers in ASECNA means the agency
must pay attention to their requirements as well as those of local airlines.
The liberalisation process and the growth of economies in the
region will have a positive impact on competition and on air travel. ASECNA
must anticipate these mutations, and their foreseeable impact on the air
navigation system, and articulate its strategy to match the other exigencies
mentioned above.
| 

