ANNEXES
|
Annexe 1 : Evolution des données
macroéconomiques
|
|
Année
|
PE (1)
|
PG (2)
|
PP (3)
|
PIB (4)
|
RF (5)
|
IPC (6)
|
TC (7)
|
|
1980
|
84
|
62
|
51
|
85607
|
9521,5
|
12,07
|
90
|
|
1981
|
107
|
68
|
59
|
89086
|
8956
|
13,54
|
90
|
|
1982
|
107
|
68
|
59
|
94094
|
11006
|
14,34
|
90
|
|
1983
|
80
|
85
|
68
|
102892
|
10482
|
15,51
|
117,41
|
|
1984
|
100
|
85
|
68
|
120451
|
14415
|
17,73
|
119,71
|
|
1985
|
100
|
85
|
76
|
131347
|
17414
|
18,4
|
120,69
|
|
1986
|
100
|
85
|
76
|
140842
|
19808
|
18,71
|
114,17
|
|
1987
|
100
|
85
|
76
|
143590
|
15822
|
20,04
|
123,56
|
|
1988
|
100
|
92
|
85
|
152456
|
21616
|
20,94
|
140,4
|
|
1989
|
100
|
92
|
85
|
174501
|
25135
|
23,38
|
158,8
|
|
1990
|
130
|
120
|
120
|
189141
|
22413
|
25,02
|
171,51
|
|
1991
|
135
|
125
|
125
|
209950
|
28523
|
27,27
|
181,51
|
|
1992
|
135
|
125
|
125
|
233717
|
29578
|
27,77
|
208,3
|
|
1993
|
140
|
130
|
130
|
234764
|
32932
|
30,46
|
242,73
|
|
1994
|
140
|
130
|
130
|
286547
|
36082
|
34,98
|
252,66
|
|
1995
|
160
|
145
|
142
|
309953
|
40694
|
41,72
|
249,7
|
|
1996
|
230
|
205
|
165
|
265413
|
35359
|
52,75
|
302,75
|
|
1997
|
350
|
320
|
180
|
346099
|
39247
|
69,16
|
352,35
|
|
1998
|
350
|
320
|
180
|
404382
|
55445
|
77,8
|
447,7
|
|
1999
|
350
|
320
|
180
|
460266
|
59956
|
80,45
|
563,56
|
|
2000
|
570
|
520
|
480
|
576979
|
86595
|
100
|
720,67
|
|
2001
|
685
|
635
|
630
|
549981
|
95513
|
109,24
|
830,75
|
|
2002
|
750
|
700
|
680
|
584605
|
95587
|
107,8
|
930,75
|
|
2003
|
880
|
830
|
810
|
644680
|
105587
|
116,28
|
1082,62
|
|
2004
|
1000
|
1000
|
940
|
748486
|
117529
|
128,7
|
1100,91
|
|
2005
|
1100
|
1150
|
1100
|
860902
|
141510
|
146,11
|
1107,81
|
|
2006
|
1220
|
1244
|
1025
|
944900
|
163639,3
|
150,21
|
1104,35
|
|
2007
|
1370
|
1394
|
1316
|
1059200
|
185600
|
153,02
|
1137,91
|
|
2008
|
1900
|
1736
|
1678
|
1378100
|
237095,5
|
154,9
|
1185,69
|
|
2009
|
1630
|
1600
|
1300
|
2540400
|
289024,2
|
171,17
|
1230,14
|
Source : (1), (2), (3) : Ministère du
Commerce, de l'Industrie, des Postes et du Tourisme :
Différentes Ordonnances
Ministérielles.
(4), (5), (6) : République du
Burundi, Ministère de la Planification, du
Département et
de la Reconstruction, Service de la Planification
macroéconomique.
(7) : Rapports Annuels de la BRB.
Avec : PE : Prix de l'Essence,
PG : Prix du Gasoil, PP : Prix du
Pétrole, PIB : Produit Intérieur Brut, IPC : Indice des
Prix à la Consommation, TC : Taux de Change et RF : Recettes
Fiscales.
Annexe 2 : Evolution des
importations des carburants en T en M BIF
|
|
|
|
|
|
|
|
|
|
Importation des carburants (en T)
|
Importations des carburants (en M BIF)
|
|
|
|
Année
|
Essence Super
|
Pétrole
|
Gasoil
|
Essence Super
|
Pétrole
|
Gasoil
|
|
|
|
1980
|
16988
|
1196
|
13559
|
1265,3
|
73,1
|
746,6
|
|
|
|
1981
|
15652
|
1629
|
14301
|
1685,0
|
112,7
|
934,2
|
|
|
|
1982
|
13559
|
1414
|
15225
|
1449,0
|
112,8
|
1002,2
|
|
|
|
1983
|
13217
|
1831
|
19367
|
1141,2
|
116,8
|
1198,7
|
|
|
|
1984
|
17617
|
3018
|
26146
|
1560,4
|
245,2
|
1954,0
|
|
|
|
1985
|
16570
|
2590
|
21966
|
1619,2
|
200,0
|
1699,4
|
|
|
|
1986
|
15305
|
3050
|
22163
|
1044,2
|
203,8
|
1363,1
|
|
|
|
1987
|
18492
|
1970
|
24168
|
1367,2
|
136,9
|
1593,4
|
|
|
|
1988
|
18532
|
1954
|
23733
|
1380,7
|
140,4
|
1583,4
|
|
|
|
1989
|
17868
|
1871
|
19924
|
1322,8
|
135,2
|
1357,9
|
|
|
|
1990
|
25234
|
3399
|
28646
|
2443,6
|
303,9
|
2134,8
|
|
|
|
1991
|
22398
|
4155
|
23186
|
2351,9
|
430,4
|
1984,1
|
|
|
|
1992
|
22791
|
8332
|
22419
|
2100,3
|
806,6
|
1800,6
|
|
|
|
1993
|
19437
|
1941
|
21218
|
2074,4
|
203,5
|
1942,4
|
|
|
|
1994
|
23300
|
3360
|
26823
|
2673,3
|
364,8
|
2687,5
|
|
|
|
1995
|
17093
|
4422
|
27348
|
2185,6
|
463,3
|
2758,2
|
|
|
|
1996
|
14559
|
2170
|
24482
|
1859,2
|
248,9
|
2699,1
|
|
|
|
1997
|
7679
|
359
|
14499
|
1661,0
|
67,5
|
2759,0
|
|
|
|
1998
|
17771
|
2013
|
19499
|
3851,3
|
392,7
|
3685,6
|
|
|
|
1999
|
18817
|
1032
|
20290
|
4368,1
|
607,8
|
4333,6
|
|
|
|
2000
|
22192
|
2062
|
24019
|
6114,4
|
400,8
|
5775,3
|
|
|
|
2001
|
19886
|
1364
|
25408
|
5138,1
|
584,5
|
6277,6
|
|
|
|
2002
|
27352
|
1536
|
32082
|
5971,7
|
1216,8
|
5803,6
|
|
|
|
2003
|
27130
|
1862
|
22523
|
7405,0
|
2012,6
|
6685,7
|
|
|
|
2004
|
22585
|
766
|
291
|
10017,4
|
408,0
|
412,9
|
|
|
|
2005
|
24042
|
1001
|
14076
|
8406,0
|
284,9
|
9706,6
|
|
|
|
2006
|
33341
|
1213
|
35027
|
23631,1
|
1078,8
|
26002,0
|
|
|
|
2007
|
27026
|
1144
|
33429
|
25159,6
|
1039,1
|
28283,7
|
|
|
|
2008
|
26511
|
1600
|
33501
|
37544,9
|
2131,6
|
53941,2
|
|
|
|
2009
|
16026
|
6543
|
21639
|
18072,8
|
6436,9
|
23706,2
|
|
|
Source : ISTEEBU.
Annexe 3 : Part des Importations
des Carburants dans les Importations Totales du Burundi
|
Année
|
MT
|
MT C
|
MTC/MT (en %)
|
|
1980
|
15114,4
|
2186,8
|
14,47%
|
|
1981
|
14509,4
|
2891,3
|
19,93%
|
|
1982
|
19280,0
|
2695,2
|
13,98%
|
|
1983
|
17074,9
|
2467,3
|
14,45%
|
|
1984
|
22383,0
|
3774,8
|
16,86%
|
|
1985
|
22754,3
|
3860,7
|
16,97%
|
|
1986
|
23194,5
|
2950,3
|
12,72%
|
|
1987
|
25465,3
|
3543,8
|
13,92%
|
|
1988
|
28884,5
|
3497,2
|
12,11%
|
|
1989
|
29909,7
|
3112,5
|
10,41%
|
|
1990
|
40179,3
|
5192,8
|
12,92%
|
|
1991
|
46154,2
|
5307,7
|
11,50%
|
|
1992
|
46105,7
|
5375,0
|
11,66%
|
|
1993
|
47434,3
|
5956,7
|
12,56%
|
|
1994
|
56467,6
|
7319,8
|
12,96%
|
|
1995
|
58186,1
|
6223,9
|
10,70%
|
|
1996
|
37331,7
|
5486,9
|
14,70%
|
|
1997
|
43249,3
|
4873,3
|
11,27%
|
|
1998
|
70274,6
|
8761,5
|
12,47%
|
|
1999
|
66307,3
|
10198,7
|
15,38%
|
|
2000
|
106059,4
|
13705,1
|
12,92%
|
|
2001
|
115254,1
|
12702,3
|
11,02%
|
|
2002
|
121050,2
|
14112,5
|
11,66%
|
|
2003
|
169743,0
|
18705,2
|
11,02%
|
|
2004
|
193605,3
|
15206,2
|
7,85%
|
|
2005
|
289123,4
|
21980,3
|
7,60%
|
|
2006
|
442511,2
|
55819,2
|
12,61%
|
|
2007
|
346100,2
|
54834,7
|
15,84%
|
|
2008
|
477781,3
|
93673,4
|
19,61%
|
|
2009
|
494828,6
|
48218,3
|
9,74%
|
Source : Rapports Annuels de la
BRB.
AVEC : MT : Importations
totales
MTC : Importations totales
du carburant
Annexe 4 : STRUCTURE DE
L'ESSENCE SUPER, DU GAS OIL ET DU PETROLE IMPORTES VIA ELDORET ET
DAR-ES-SALAAM-DEPOT BUJUMBURA (O.M du 22 Novembre 2010).
|
ELEMENTS DE LA STRUCTURE
|
ESSENCE SUPER
|
GASOIL
|
PETROLE
|
|
FOT ($/L)
|
0,661
|
0,665
|
0,677
|
|
TRANSPORT ($/L)
|
0,165
|
0,172
|
0,172
|
|
CF ($/L)
|
0,826
|
0,837
|
0,849
|
|
TAUX DE CHANGE (FBU/US $)
|
1246,00
|
1246,000
|
1246,000
|
|
COUT ET TRANSPORT(en FBU)
|
1029,1
|
1042,46
|
1057,44
|
|
COULAGE TRANSPORT
|
3,09
|
3,13
|
3,17
|
|
ASSURANCE
|
5,15
|
5,21
|
5,29
|
|
CIF BUJUMBURA
|
1037,24
|
1050,80
|
1065,90
|
|
DECHARGEMENT SEP
|
2,00
|
2,00
|
2,00
|
|
FRAIS SEP
|
8,00
|
8,00
|
8,00
|
|
FRAIS BANCAIRES
|
15,44
|
15,64
|
15,86
|
|
DROITS DE DOUANES
|
0
|
0
|
0
|
|
REDEVANCE ADMINISTRATIVE
|
5,19
|
5,25
|
5,33
|
|
DROITS D'ACCISE
|
246,41
|
234,85
|
54,70
|
|
PRIX DE REVIENT
|
1314,27
|
1316,54
|
1151,79
|
|
COULAGE DEPOT
|
3,94
|
3,95
|
3,46
|
|
FRAIS STOCK GOUVERNEMENT
|
0,21
|
0,21
|
0,21
|
|
FONDS ROUTIER NATIONAL
|
80,00
|
80,00
|
0
|
|
IMPACT SOCIAL CARBURANT
|
10,00
|
10,00
|
10,00
|
|
FONDS STOCK STRATEGIQUE
|
20,00
|
20,00
|
0
|
|
T.V.A.
|
251,24
|
251,60
|
203,90
|
|
COUTS ET TAXES AVEC LA T.V.A
|
1679,66
|
1682,30
|
1369,35
|
|
MARGE DE GROS
|
71,67
|
70,10
|
65,46
|
|
PRIX DE GROS
|
1751,33
|
1752,40
|
1434,81
|
|
MARGE DE DETAIL
|
48,67
|
47,60
|
45,19
|
|
PRIX A LA POMPE
|
1800,00
|
1800,00
|
1480,00
|
Source : Ministère du
Commerce, de l'Industrie, des Postes et du Tourisme.
Annexe 5 : STRUCTURE DE L'ESSENCE SUPER, DU GAS
OIL ET DU PETROLE IMPORTES VIA ELDORET ET DAR-ES-SALAAM-DEPOTGITEGA (O.M du 22
Novembre 2010).
|
ELEMENTS DE LA STRUCTURE
|
ESSENCE SUPER
|
GASOIL
|
PETROLE
|
|
FOT ($/L)
|
0,661
|
0,665
|
0,677
|
|
TRANSPORT ($/L)
|
0,165
|
0,172
|
0,172
|
|
CF ($/L)
|
0,826
|
0,837
|
0,849
|
|
TAUX DE CHANGE (FBU/US $)
|
1246,00
|
1246,000
|
1246,000
|
|
COUT ET TRANSPORT(en FBU)
|
1029,1
|
1042,46
|
1057,44
|
|
COULAGE TRANSPORT
|
3,09
|
3,13
|
3,17
|
|
ASSURANCE
|
5,15
|
5,21
|
5,29
|
|
CIF BUJUMBURA
|
1037,24
|
1050,80
|
1065,90
|
|
DECHARGEMENT SEP
|
2,00
|
2,00
|
2,00
|
|
FRAIS SEP
|
8,00
|
8,00
|
8,00
|
|
FRAIS BANCAIRES
|
15,44
|
15,64
|
15,86
|
|
DROITS DE DOUANES
|
0
|
0
|
0
|
|
REDEVANCE ADMINISTRATIVE
|
5,19
|
5,25
|
5,33
|
|
DROITS D'ACCISE
|
246,41
|
234,85
|
54,70
|
|
PRIX DE REVIENT
|
1314,27
|
1316,54
|
1151,79
|
|
COULAGE DEPOT
|
3,94
|
3,95
|
3,46
|
|
FRAIS STOCK GOUVERNEMENT
|
0,21
|
0,21
|
0,21
|
|
FONDS ROUTIER NATIONAL
|
80,00
|
80,00
|
0
|
|
IMPACT SOCIAL CARBURANT
|
0
|
0
|
10,00
|
|
FONDS STOCK STRATEGIQUE
|
0
|
0
|
0
|
|
TRANSPORT GITEGA-BUJUMBURA
|
30,00
|
30,00
|
0
|
|
T.V.A.
|
251,24
|
251,60
|
203,90
|
|
COUTS ET TAXES AVEC LA T.V.A
|
1679,66
|
1682,30
|
1369,35
|
|
MARGE DE GROS
|
71,67
|
70,10
|
65,46
|
|
PRIX DE GROS
|
1751,33
|
1752,40
|
1434,81
|
|
MARGE DE DETAIL
|
48,67
|
47,60
|
45,19
|
|
PRIX A LA POMPE
|
1800,00
|
1800,00
|
1480,00
|
Source : Ministère du Commerce,
de l'Industrie, des Postes et du Tourisme.
Annexe 6 : STRUCTURE DE
L'ESSENCE SUPER, DU GAS OIL ET DU PETROLE IMPORTES VIA KIGOMA (O.M du 22
Novembre 2010)
|
ELEMENTS DE LA STRUCTURE
|
ESSENCE SUPER
|
GASOIL
|
PETROLE
|
|
FOB ($/L)
|
0,791
|
0,795
|
0,814
|
|
TAUX DE CHANGE (FBU/US $)
|
1246,000
|
1246,000
|
1246,000
|
|
FOB KIGOMA (en FBU)
|
985,40
|
990,13
|
1013,83
|
|
TRANSPORT KIGOMA-BUJUMBURA
|
20,00
|
20,00
|
20,00
|
|
COULAGE TRANSPORT
|
2,96
|
2,97
|
3,04
|
|
ASSURANCE
|
4,93
|
4,95
|
5,07
|
|
CIF BUJUMBURA
|
1013,28
|
1018,05
|
1041,94
|
|
DECHARGEMENT SEP
|
2,00
|
2,00
|
2,00
|
|
FRAIS SEP
|
8,00
|
8,00
|
8,00
|
|
FRAIS BANCAIRES
|
14,78
|
14,85
|
15,21
|
|
DROITS DE DOUANES
|
0
|
0
|
0
|
|
REDEVANCE ADMINISTRATIVE
|
5,07
|
5,09
|
5,21
|
|
DROITS D'ACCISE
|
246,09
|
234,85
|
54,70
|
|
PRIX DE REVIENT
|
1289,54
|
1282,84
|
1127,05
|
|
COULAGE DEPOT
|
3,87
|
3,85
|
3, 38
|
|
FRAIS STOCK GOUVERNEMENT
|
0,21
|
0,21
|
0,21
|
|
FONDS ROUTIER NATIONAL
|
80,00
|
80,00
|
0
|
|
IMPACT SOCIAL CARBURANT
|
10,00
|
10,00
|
10,00
|
|
FONDS STOCK STRATEGIQUE
|
44,68
|
53,64
|
24,41
|
|
T.V.A.
|
251,37
|
251,76
|
203,98
|
|
COUTS ET TAXES AVEC LA T.V.A
|
1679,66
|
1682,30
|
1369,03
|
|
MARGE DE GROS
|
71,67
|
70,10
|
65,78
|
|
PRIX DE GROS
|
1751,33
|
1752,40
|
1434,81
|
|
MARGE DE DETAIL
|
48,67
|
47,60
|
45,19
|
|
PRIX A LA POMPE
|
1800,00
|
1800,00
|
1480,00
|
Source : Ministère du Commerce,
de l'Industrie, des Postes et du Tourisme.
Annexe 7 : Les Prix à la Pompe de
l'Essence Super, du Gasoil et du Pétrole selon les localités du
Burundi
|
LOCALITES
|
ESSENCE SUPER
|
GASOIL
|
PETROLE
|
|
Prix/litre (Fbu)
|
Prix/litre (Fbu)
|
Prix/litre (Fbu)
|
|
BUBANZA
|
1745
|
1735
|
1435
|
|
BUJUMBURA
|
1730
|
1720
|
1420
|
|
BURURI
|
1760
|
1750
|
1450
|
|
CANKUZO
|
1775
|
1765
|
1465
|
|
CIBITOKE
|
1745
|
1735
|
1435
|
|
GITEGA
|
1760
|
1750
|
1450
|
|
KARUZI
|
1765
|
1755
|
1455
|
|
KAYANZA
|
1760
|
1750
|
1450
|
|
KIRUNDO
|
1775
|
1765
|
1465
|
|
MAKAMBA
|
1770
|
1760
|
1460
|
|
MURAMVYA
|
1745
|
1735
|
1435
|
|
MUYINGA
|
1770
|
1760
|
1460
|
|
MWARO
|
1750
|
1740
|
1440
|
|
NGOZI
|
1760
|
1750
|
1450
|
|
RUTANA
|
1770
|
1760
|
1460
|
|
RUYIGI
|
1770
|
1760
|
1460
|
Source : Ministère du Commerce,
de l'Industrie, des Postes et du Tourisme
Annexe 8 : Tests de corrélations entre les
variables
Pour l'IPC
|
DLIPC
|
DLPE
|
DLPG
|
DLPP
|
|
DLIPC
|
1.000000
|
0.647808
|
0.654662
|
0.323724
|
|
DLPE
|
0.647808
|
1.000000
|
0.767930
|
0.573867
|
|
DLPG
|
0.654662
|
0.767930
|
1.000000
|
0.713304
|
|
DLPP
|
0.323724
|
0.573867
|
0.713304
|
1.000000
|
Pour le PIB
|
DLPIB
|
DLPE
|
DLPG
|
DLPP
|
|
DLPIB
|
1.000000
|
0.198915
|
0.362240
|
0.074977
|
|
DLPE
|
0.198915
|
1.000000
|
0.791338
|
0.607331
|
|
DLPG
|
0.362240
|
0.791338
|
1.000000
|
0.685684
|
|
DLPP
|
0.074977
|
0.607331
|
0.685684
|
1.000000
|
Pour les RF
|
DLRF
|
DLPE
|
DLPG
|
DLPP
|
|
DLRF
|
1.000000
|
-0.019835
|
0.021544
|
0.257858
|
|
DLPE
|
-0.019835
|
1.000000
|
0.784355
|
0.589218
|
|
DLPG
|
0.021544
|
0.784355
|
1.000000
|
0.672428
|
|
DLPP
|
0.257858
|
0.589218
|
0.672428
|
1.000000
|
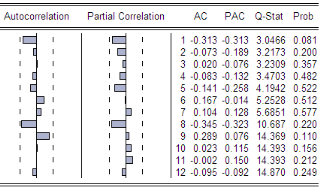
Annexe 9 : Correlogramme de la
série des résidus
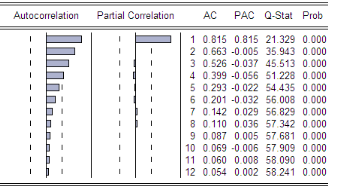
Correlogramme PIB
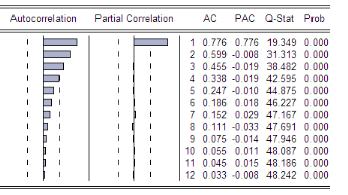
Correlogramme RF
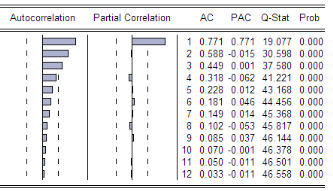
En différence première
Correlogramme IPC
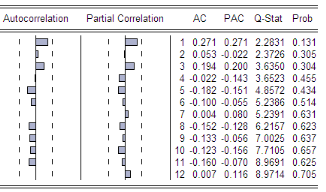
Correlogramme PIB
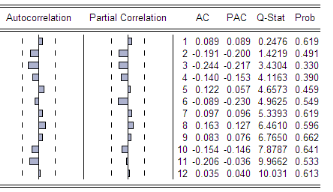
Correlogramme RF
Annexe 10 : Test de
décomposition de la variance de l'erreur de prévision
|
|
|
|
|
|
|
|
|
|
|
|
|
Décomposition de la
variance de l'IPC
|
|
Période
|
S.E.
|
DLIPC
|
DLPE
|
DLPG
|
DLPP
|
|
|
|
|
|
|
|
|
|
|
|
|
|
1
|
0.070038
|
100.0000
|
0.000000
|
0.000000
|
0.000000
|
|
2
|
0.099626
|
98.70875
|
1.075903
|
0.211294
|
0.004057
|
|
3
|
0.123310
|
96.00796
|
3.431589
|
0.547479
|
0.012970
|
|
4
|
0.144442
|
92.33643
|
6.690435
|
0.950558
|
0.022572
|
|
5
|
0.164239
|
88.09565
|
10.49074
|
1.383026
|
0.030577
|
|
6
|
0.183231
|
83.60363
|
14.54174
|
1.818329
|
0.036301
|
|
7
|
0.201653
|
79.08966
|
18.63146
|
2.239023
|
0.039854
|
|
8
|
0.219600
|
74.70614
|
22.61742
|
2.634805
|
0.041637
|
|
9
|
0.237090
|
70.54573
|
26.41167
|
3.000497
|
0.042101
|
|
10
|
0.254107
|
66.65811
|
29.96591
|
3.334332
|
0.041645
|
|
|
|
|
|
|
|
|
|
|
|
|
|
Décomposition de la variance de
PE
|
|
Période
|
S.E.
|
DLIPC
|
DLPE
|
DLPG
|
DLPP
|
|
|
|
|
|
|
|
|
|
|
|
|
|
1
|
0.150178
|
41.96555
|
58.03445
|
0.000000
|
0.000000
|
|
2
|
0.193557
|
48.68939
|
50.64244
|
0.531445
|
0.136732
|
|
3
|
0.222161
|
54.78543
|
44.35927
|
0.647706
|
0.207594
|
|
4
|
0.243874
|
60.32565
|
38.83467
|
0.597399
|
0.242279
|
|
5
|
0.261943
|
65.13535
|
34.08605
|
0.519455
|
0.259145
|
|
6
|
0.278159
|
69.02895
|
30.22887
|
0.476437
|
0.265740
|
|
7
|
0.293597
|
71.88400
|
27.35470
|
0.495758
|
0.265544
|
|
8
|
0.308904
|
73.66780
|
25.48642
|
0.585226
|
0.260556
|
|
9
|
0.324443
|
74.43532
|
24.57198
|
0.740516
|
0.252188
|
|
10
|
0.340384
|
74.30846
|
24.49969
|
0.950288
|
0.241564
|
|
|
|
|
|
|
|
|
|
|
|
|
|
Décomposition de la variance de PG
|
|
Période
|
S.E.
|
DLIPC
|
DLPE
|
DLPG
|
DLPP
|
|
|
|
|
|
|
|
|
|
|
|
|
|
1
|
0.120896
|
42.85826
|
20.37098
|
36.77076
|
0.000000
|
|
2
|
0.166177
|
52.80326
|
24.84406
|
22.06853
|
0.284151
|
|
3
|
0.197211
|
60.37921
|
23.12248
|
16.20554
|
0.292769
|
|
4
|
0.221093
|
66.74019
|
20.00994
|
13.00037
|
0.249500
|
|
5
|
0.241294
|
71.86902
|
17.00314
|
10.91769
|
0.210151
|
|
6
|
0.259701
|
75.65478
|
14.71587
|
9.446884
|
0.182471
|
|
7
|
0.277398
|
78.06383
|
13.39951
|
8.372588
|
0.164072
|
|
8
|
0.295001
|
79.16946
|
13.09582
|
7.583256
|
0.151467
|
|
9
|
0.312831
|
79.13357
|
13.71497
|
7.009428
|
0.142029
|
|
10
|
0.331017
|
78.16976
|
15.09474
|
6.601353
|
0.134146
|
|
|
|
|
|
|
|
|
|
|
|
|
|
Décomposition de la variance de
PP
|
|
Période
|
S.E.
|
DLIPC
|
DLPE
|
DLPG
|
DLPP
|
|
|
|
|
|
|
|
|
|
|
|
|
|
1
|
0.187157
|
10.47975
|
22.85008
|
22.18641
|
44.48376
|
|
2
|
0.241749
|
16.13921
|
25.42205
|
18.37752
|
40.06123
|
|
3
|
0.273775
|
22.13744
|
25.61608
|
16.20639
|
36.04010
|
|
4
|
0.296008
|
28.24189
|
24.52030
|
14.58716
|
32.65066
|
|
5
|
0.313471
|
34.16470
|
22.78193
|
13.24575
|
29.80763
|
|
6
|
0.328630
|
39.63800
|
20.88581
|
12.09941
|
27.37678
|
|
7
|
0.342846
|
44.44490
|
19.19728
|
11.11690
|
25.24091
|
|
8
|
0.356914
|
48.43690
|
17.96523
|
10.28170
|
23.31617
|
|
9
|
0.371294
|
51.54135
|
17.32699
|
9.580927
|
21.55073
|
|
10
|
0.386225
|
53.75815
|
17.32289
|
9.001826
|
19.91713
|
|
|
|
|
|
|
|
|
|
|
|
|
|
|
|
|
|
|
|
|
|
|
|
|
|
Décomposition de la variance du PIB
|
|
Période
|
S.E.
|
DLPIB
|
DLPE
|
DLPG
|
DLPP
|
|
|
|
|
|
|
|
|
|
|
|
|
|
1
|
0.068422
|
100.0000
|
0.000000
|
0.000000
|
0.000000
|
|
2
|
0.102830
|
91.39079
|
0.006049
|
6.893612
|
1.709546
|
|
3
|
0.129800
|
86.39390
|
0.529702
|
9.594507
|
3.481893
|
|
4
|
0.153669
|
82.06264
|
1.898831
|
10.90521
|
5.133324
|
|
5
|
0.176104
|
77.97520
|
3.839953
|
11.60137
|
6.583477
|
|
6
|
0.197839
|
74.14316
|
6.073582
|
11.97114
|
7.812120
|
|
7
|
0.219232
|
70.61921
|
8.394758
|
12.15312
|
8.832913
|
|
8
|
0.240476
|
67.43104
|
10.67155
|
12.22399
|
9.673420
|
|
9
|
0.261686
|
64.57937
|
12.82757
|
12.22910
|
10.36396
|
|
10
|
0.282937
|
62.04707
|
14.82431
|
12.19612
|
10.93250
|
|
|
|
|
|
|
|
|
|
|
|
|
|
Décomposition de la variance de
PE
|
|
Période
|
S.E.
|
DLPIB
|
DLPE
|
DLPG
|
DLPP
|
|
|
|
|
|
|
|
|
|
|
|
|
|
1
|
0.155979
|
3.956730
|
96.04327
|
0.000000
|
0.000000
|
|
2
|
0.206847
|
7.654656
|
89.35801
|
2.054646
|
0.932690
|
|
3
|
0.245639
|
11.15034
|
83.10920
|
3.503268
|
2.237191
|
|
4
|
0.279342
|
14.35875
|
77.43659
|
4.597161
|
3.607498
|
|
5
|
0.310415
|
17.23009
|
72.40067
|
5.468535
|
4.900710
|
|
6
|
0.339987
|
19.76159
|
67.99831
|
6.180623
|
6.059481
|
|
7
|
0.368662
|
21.97767
|
64.17938
|
6.771700
|
7.071243
|
|
8
|
0.396810
|
23.91336
|
60.87438
|
7.268203
|
7.944057
|
|
9
|
0.424682
|
25.60514
|
58.01160
|
7.689485
|
8.693782
|
|
10
|
0.452461
|
27.08694
|
55.52506
|
8.050117
|
9.337880
|
|
|
|
|
|
|
|
|
|
|
|
|
|
Décomposition de la variance de PG
|
|
Période
|
S.E.
|
DLPIB
|
DLPE
|
DLPG
|
DLPP
|
|
|
|
|
|
|
|
|
|
|
|
|
|
1
|
0.133218
|
13.12180
|
53.86824
|
33.00996
|
0.000000
|
|
2
|
0.183767
|
16.39710
|
62.08812
|
21.09499
|
0.419790
|
|
3
|
0.223644
|
19.96061
|
61.45920
|
17.00003
|
1.580161
|
|
4
|
0.259245
|
23.12084
|
58.76713
|
15.08348
|
3.028555
|
|
5
|
0.292695
|
25.75501
|
55.75718
|
14.01636
|
4.471442
|
|
6
|
0.324888
|
27.90882
|
52.95608
|
13.35329
|
5.781803
|
|
7
|
0.356287
|
29.66514
|
50.50408
|
12.90847
|
6.922311
|
|
8
|
0.387183
|
31.10375
|
48.40779
|
12.59248
|
7.895976
|
|
9
|
0.417784
|
32.29108
|
46.63007
|
12.35782
|
8.721036
|
|
10
|
0.448253
|
33.27960
|
45.12366
|
12.17728
|
9.419464
|
|
|
|
|
|
|
|
|
|
|
|
|
|
Décomposition de la variance de PP
|
|
Période
|
S.E.
|
DLPIB
|
DLPE
|
DLPG
|
DLPP
|
|
|
|
|
|
|
|
|
|
|
|
|
|
1
|
0.181189
|
0.562151
|
36.54166
|
13.98439
|
48.91181
|
|
2
|
0.227620
|
3.055136
|
45.52409
|
9.746467
|
41.67430
|
|
3
|
0.255269
|
7.535592
|
48.77944
|
8.937587
|
34.74738
|
|
4
|
0.279386
|
12.85787
|
49.11179
|
9.006458
|
29.02388
|
|
5
|
0.304029
|
17.99808
|
47.88246
|
9.326405
|
24.79305
|
|
6
|
0.329984
|
22.42532
|
46.02542
|
9.677772
|
21.87148
|
|
7
|
0.357137
|
26.01059
|
44.08734
|
9.986457
|
19.91561
|
|
8
|
0.385216
|
28.82699
|
42.32538
|
10.23573
|
18.61191
|
|
9
|
0.413998
|
31.01230
|
40.82707
|
10.42955
|
17.73109
|
|
10
|
0.443340
|
32.70462
|
39.59669
|
10.57767
|
17.12102
|
|
|
|
|
|
|
|
|
|
|
|
|
|
|
|
|
|
|
|
|
|
|
|
|
|
Décomposition de la
variance de RF
|
|
Période
|
S.E.
|
DLRF
|
DLPE
|
DLPG
|
DLPP
|
|
|
|
|
|
|
|
|
|
|
|
|
|
1
|
0.121076
|
100.0000
|
0.000000
|
0.000000
|
0.000000
|
|
2
|
0.163363
|
78.49649
|
0.167300
|
18.34575
|
2.990462
|
|
3
|
0.192698
|
66.86051
|
0.584496
|
25.77584
|
6.779156
|
|
4
|
0.217878
|
57.63172
|
2.243335
|
29.47009
|
10.65485
|
|
5
|
0.241758
|
49.81018
|
4.804023
|
31.22495
|
14.16084
|
|
6
|
0.265319
|
43.20204
|
7.797585
|
31.88018
|
17.12019
|
|
7
|
0.288882
|
37.67576
|
10.87002
|
31.92440
|
19.52983
|
|
8
|
0.312536
|
33.07900
|
13.80975
|
31.64902
|
21.46223
|
|
9
|
0.336306
|
29.25541
|
16.51277
|
31.22371
|
23.00811
|
|
10
|
0.360203
|
26.06294
|
18.94216
|
30.74382
|
24.25108
|
|
|
|
|
|
|
|
|
|
|
|
|
|
Décomposition de la variance de PE
|
|
Période
|
S.E.
|
DLRF
|
DLPE
|
DLPG
|
DLPP
|
|
|
|
|
|
|
|
|
|
|
|
|
|
1
|
0.154422
|
0.039342
|
99.96066
|
0.000000
|
0.000000
|
|
2
|
0.201362
|
0.102551
|
96.31665
|
2.125148
|
1.455649
|
|
3
|
0.235994
|
0.374818
|
90.86151
|
4.744470
|
4.019205
|
|
4
|
0.266546
|
0.729802
|
84.85569
|
7.405266
|
7.009243
|
|
5
|
0.295500
|
1.082709
|
79.09722
|
9.843956
|
9.976110
|
|
6
|
0.323737
|
1.396039
|
73.94582
|
11.96186
|
12.69628
|
|
7
|
0.351618
|
1.659887
|
69.49538
|
13.75323
|
15.09150
|
|
8
|
0.379325
|
1.876844
|
65.71251
|
15.25192
|
17.15873
|
|
9
|
0.406972
|
2.053793
|
62.51587
|
16.50298
|
18.92735
|
|
10
|
0.434650
|
2.198205
|
59.81455
|
17.55018
|
20.43707
|
|
|
|
|
|
|
|
|
|
|
|
|
|
Décomposition de la variance de PG
|
|
Période
|
S.E.
|
DLRF
|
DLPE
|
DLPG
|
DLPP
|
|
|
|
|
|
|
|
|
|
|
|
|
|
1
|
0.129491
|
0.046413
|
61.61254
|
38.34105
|
0.000000
|
|
2
|
0.175576
|
1.702743
|
71.11732
|
25.78847
|
1.391462
|
|
3
|
0.212162
|
2.626266
|
69.73385
|
23.16428
|
4.475601
|
|
4
|
0.245816
|
3.162997
|
65.99042
|
22.78662
|
8.059959
|
|
5
|
0.278252
|
3.459461
|
62.04790
|
23.01786
|
11.47478
|
|
6
|
0.310004
|
3.609285
|
58.54820
|
23.37698
|
14.46554
|
|
7
|
0.341290
|
3.672515
|
55.62266
|
23.71650
|
16.98833
|
|
8
|
0.372241
|
3.686177
|
53.23125
|
23.99869
|
19.08389
|
|
9
|
0.402966
|
3.672532
|
51.28788
|
24.22203
|
20.81756
|
|
10
|
0.433566
|
3.644756
|
49.70501
|
24.39552
|
22.25471
|
|
|
|
|
|
|
|
|
|
|
|
|
|
Décomposition de la variance
de PP
|
|
Période
|
S.E.
|
DLRF
|
DLPE
|
DLPG
|
DLPP
|
|
|
|
|
|
|
|
|
|
|
|
|
|
1
|
0.178986
|
6.649050
|
35.33702
|
10.46067
|
47.55326
|
|
2
|
0.224954
|
11.52318
|
43.64315
|
7.441201
|
37.39247
|
|
3
|
0.251323
|
14.17182
|
47.01762
|
8.584368
|
30.22620
|
|
4
|
0.274726
|
15.23111
|
47.89595
|
11.08071
|
25.79222
|
|
5
|
0.299163
|
15.16613
|
47.37172
|
13.78414
|
23.67800
|
|
6
|
0.325233
|
14.46757
|
46.26152
|
16.16515
|
23.10576
|
|
7
|
0.352656
|
13.49735
|
45.05203
|
18.07274
|
23.37788
|
|
8
|
0.381047
|
12.46697
|
43.96599
|
19.53471
|
24.03233
|
|
9
|
0.410105
|
11.48107
|
43.07275
|
20.63578
|
24.81041
|
|
10
|
0.439642
|
10.58279
|
42.37005
|
21.46333
|
25.58383
|
|
|
|
|
|
|
|
|
|
|
|
|
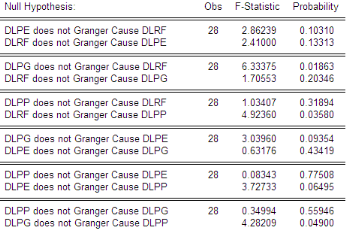
Annexe 11 :
Résultats du Test de Causalité au sens de
Granger
Pour IPC
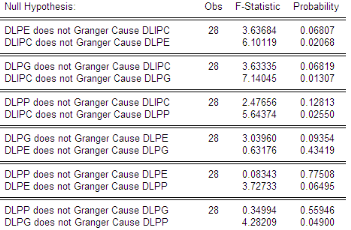
Pour PIB
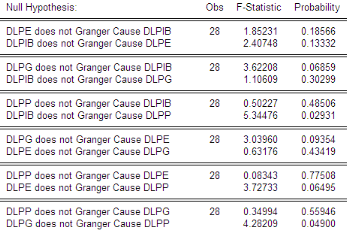
Pour RF
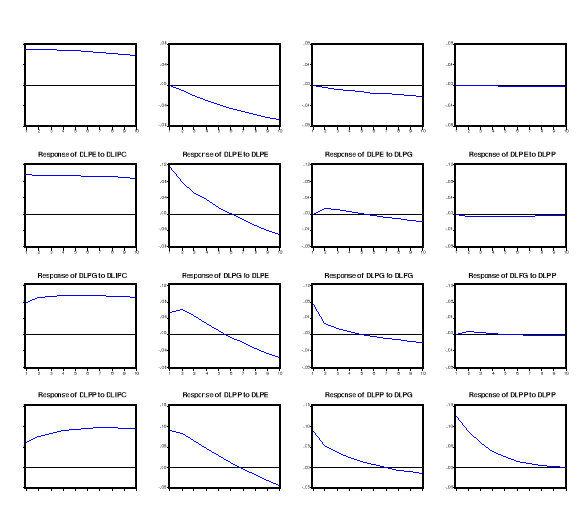
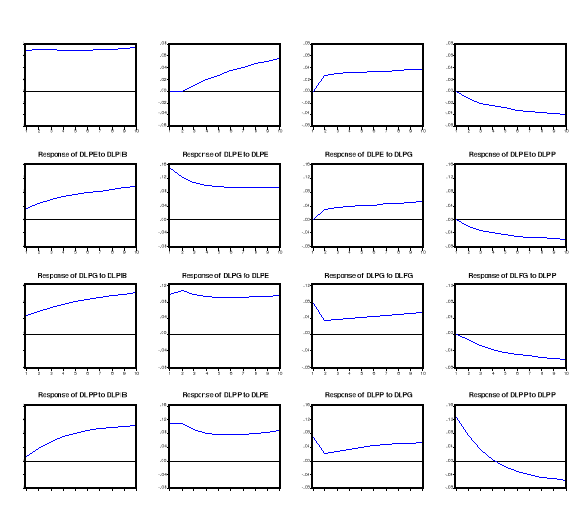
Annexe 12: Test de Réponses
impulsives
|
|

