4.2.3 ROA
4.2.3.1 ROA Tested by Time and Specialization
We applied the same tests for ROA than for ROE. The time effect
was first tested as well as
specialization to see if it was necessary to
isolate their effects on the ROA. The results were very
similar than for the
ROE, which is really logical as ROE and ROA have the same numerator. Again,
the
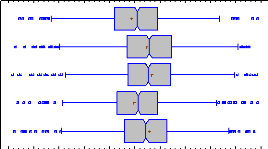
box and whisker plot in Figure 21 illustrates that year 2006
and 2009 were bad in terms of results for farming in Isère with ROA
median close to 1%, which is lower than the 1.5% inflation in 2006 (Le
Monde.fr, 2007).
Kruskal-Wallis Test for ROA by YEAR
|
YEAR
|
Sample Size
|
Average Rank
|
|
2006
|
568
|
1253,72
|
|
2007
|
568
|
1552,39
|
|
2008
|
568
|
1545,22
|
|
2009
|
568
|
1269,77
|
|
2010
|
568
|
1481,39
|
Test statistic = 73,6591 P-Value = 0 Mood's Median Test
for ROA by YEAR Total n = 2840
Grand median = 0,034619
|
YEAR
|
Sample Size
|
n<=
|
n>
|
Median
|
90,0% lower CL
|
90,0% upper CL
|
|
2006
|
568
|
339
|
229
|
0,00945275
|
-0,000555481
|
0,0218933
|
|
2007
|
568
|
242
|
326
|
0,0570648
|
0,0460463
|
0,0689174
|
|
2008
|
568
|
248
|
320
|
0,0528593
|
0,0436125
|
0,0621654
|
|
2009
|
568
|
327
|
241
|
0,0121847
|
0,000872383
|
0,0184358
|
|
2010
|
568
|
264
|
304
|
0,044225
|
0,0338877
|
0,0561194
|
Test statistic = 58,6901 P-Value = 5,46618E-12
B-andW hier P
Figure 21 : Box and whisker plots with median notch for
ROA by years (means are shown with a red cross)
Therefore, we had to isolate the time effect to isolate its
effect on the ROA.
Regarding the effect of specialization, once again the
P-Values were really low, illustrating that we cannot reject the hypothesis
that medians are significantly different at 99% confidence. The two tables of
the Kruskal-Wallis and Mood's median tests illustrate that cattle's ranching
presented significantly lower results than all other production in
Isère.
Kruskal-Wallis Test for ROA by SPECIALIZATION
|
SPECIALIZATION
|
Sample Size
|
Average Rank
|
|
Dairy production
|
705
|
1487,12
|
|
Cattle ranching
|
225
|
1124,15
|
|
-0i4 -0i3
-0i
Grains production
|
630
|
0i2
1494,56
|
|
Diversified production
|
RO
1280
|
1399,45
|
Test statistic = 40,0263 P-Value = 1,05194E-8
Mood's Median Test for ROA by SPECIALIZATION
Total n = 2840
Grand median = 0,034619
|
SPECIALIZATION
|
Sample Size
|
n<=
|
n>
|
Median
|
90,0% lower CL
|
90,0% upper CL
|
|
Dairy production
|
705
|
331
|
374
|
0,0427384
|
0,0344119
|
0,0510433
|
|
Cattle ranching
|
225
|
153
|
72
|
-0,00207533
|
-0,0192198
|
0,012193
|
|
Grains production
|
630
|
292
|
338
|
0,0464268
|
0,0350341
|
0,0583288
|
|
Diversified production
|
1280
|
644
|
636
|
0,0337455
|
0,0277409
|
0,0419674
|
Test statistic = 35,1914 P-Value = 1,10992E-7
Therefore, we had to isolate the effect of specialization also on
ROA. The tests were performed for each specialization and each year
separately.
4.2.3.2 ROA for Dairy Producers
The farms analyzed here are the same than the ones for the ROE
for dairy producers: 141 dairy farms of Isère. Figure 22 presents the
results of the different tests performed to compare the median ROA for dairy
farms between 2006 and 2010. The results are close to what can be observed for
the ROE: groups 2 and 3 seem to over-perform the other groups.
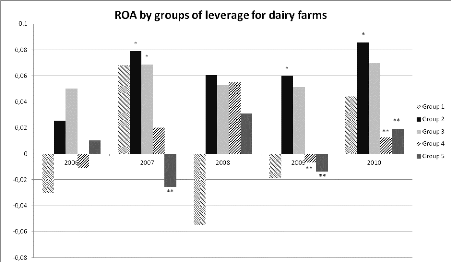
Figure 22 : ROA for each year and each group of leverage
for dairy producers * means significantly higher than **
For year 2007, the group 2 and 3 are significantly better than
the group 5. For 2009 and 2010, group
2 is significantly higher than group 4 and 5. Group 1 median on
the contrary is lower than group 2 or
3 for all years, and has the lowest median of all groups in
2006, 2008 and 2009. We cannot affirm that this difference is significant as
the standard deviations are really high for group 1 (Appendix 11 page 103).
However, these elements are clear signs of financial distress.
| 

