2 Literature Review
2.1 Risk
2.1.1 Risk in Agriculture
The risks associated with the agricultural activities can be
divided into 4 types of risks according to the OECD (Harwood, Heifner, Coble,
Perry, & Somwaru, 1999; Holzman & Jorgensen, 2001):
- Market/price risks: these risks can affect directly a farm or a
region through the variation of
the prices of land, inputs, production...
- Production risks: hail or frost can affect directly a plot, but
other climatic hazards can have a
strong impact on production. Technology evolution also can
affect the production risks, by
controlling it (dams to prevent flood, anti-hail net, drainage,
phytosanitary products...)
- Financial risks: some farmers have non agricultural
revenues. A change in these revenues may affect the profitability. Farms are
also exposed to financial risks through the interest rate on their loans.
- Institutional or legal risks: these risks are really hard to
measure, as it goes from the
responsibility risk to the legislation risk and the CAP reform
risk.
Overall, the risks in agriculture are really wide, and farmers
cannot handle them all by themselves. Production risks for example cannot be
covered only by insurance, because reinsurance companies refuse to cover the
risk of insurance companies for this type of multi-risks insurance. The
portfolio risks of these insurance is ten times higher than more conventional
sectors (Chambers, 1989; Miranda & Glauber, 1997). Therefore, policy makers
should integrate these elements into the CAP reform of 2014-2015.
On the other side, the market risks can be managed by the
farmers themselves, the futures markets can be used by farmers to reduce their
risk exposition (OECD, 2009). Actually, only 1% of all transactions made on the
futures markets are effectively physically traded, but not many farmers use
this tool (Rose, 2008). Even if the futures markets are not an efficient tool
to predict the future physical prices, they remain efficient to reduce the risk
exposure (OECD, 2009).
Regarding financial risks, it is harder to handle with
agricultural policies or tools such as the future markets. However, farmers can
with the help of their consultants estimate their financial exposition and
reduce it by choosing fixed interest rates when they subscribe new loans. It is
also possible to act on the optimal leverage level by choosing the appropriated
financing decision for new projects or equipments.
Finally, institutional or legal risks are really hard to
predict or reduce. For responsibility risk of course, it can be reduced through
insurances and the choice of equipments in accordance with the legislation.
However, institutional risks such as CAP reforms cannot be easily managed by
farmers themselves.
2.1.2 Risk Premium
The equity risk premium, also called the risk premium, represents
four different concepts according to the literature as stated by Fernandez
(2010):
- Historical equity premium (HEP): it represents the difference
between the historical results
of the stocks over government bonds or treasuries. This value
really depends on the time-frame chosen. Damodoran (2011) recommends using a
long time frame, as well as the French tax authority (2006).
- Expected equity premium (EEP): it is the expected difference
between the same elements
than the HEP. However, in this case the historical results are
not the base of the calculations. - Required equity premium (REP): this method
is used by investors to estimate the
«incremental return of a diversified portfolio (the market)
over the risk-free rate».
- Implied equity premium (IEP): it is in fact the REP assuming
the market price of the stock
represents the fair and true value of the stock.
Out of the 150 textbooks studied by Fernandez (2010), 129
authors consider that REP has to be equal to EEP. This is the most common
assumption as the CAPM states this assumption too, and 119 authors recommend
using the CAPM (Fernandez, 2010). Out of those 129, 82 consider that EEP is
also equal to HEP. We can consider that this position is the most commonly
used, as 27 authors do not explain in their textbooks how they obtained their
EEP (see Table 2). The overall recommended risk premium average is 6.7%.
However, we can see than the difference between the min and max is really wide,
ranging from 3.0% to 10.0%.
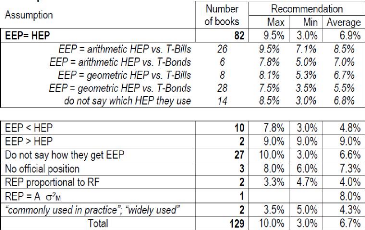
Table 2: Assumptions and recommendations of the 129 books
that assume that REP = EEP. Source: Fernandez 2010
For our calculation, we will retain from this meta-analysis
the minimum and maximum average for the most common assumption which is EEP =
HEP. Therefore, the most probable range for the risk premium would be
[5.5% : 6.7%] for the geometric mean and [7.0% : 8.5%] for the arithmetic mean.
The geometric mean is presented by many authors as less dependent of the
fluctuations and somehow more reliable. Fernandez itself recommends
3.8% to 4.3% for Europe and US.
According to the famous authors Brealey & Myers with Allen
in their editions of Principles of Corporate Finance, they recommend
to use REP between 5.0% and 8.5% (see Table 3). However, the major tendency is
to use a REP between 6.0% and 8.0%.
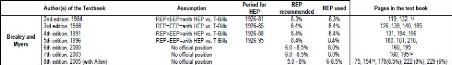
Table 3: Equity premiums recommended and used in
textbooks. Source: Fernandez 2010
What is more interesting is the reduction in the recommended
risk premium in the textbooks over the last years. Figure 10 shows that this
reduction was drastic between 1988 and 1993, and after 2002. Nowadays, the
recommendation seems to be just below 6%. It is common to see in the literature
some claims that these EEP are overvalued at 5.0 or 6.0%. Claus & Thomas
(2001) states that after 1985 it is not realistic to take long period of
centuries, and that the EEP is closer to 3.0% in reality. For France, for the
period 1985-1998, they consider that EEP should be 2.6%, basing their
calculation on the abnormal earnings approach. Quiry & Le Fur (2012) come
to a similar conclusion even with a long time frame (111 years) with a 3.2%
HEP.
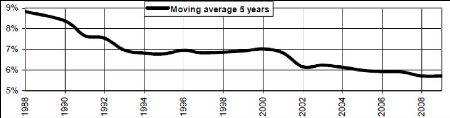
Figure 10: Moving average (last 5 years) of the REP used
or recommended in 150 finance and valuation textbooks. Source: Fernandez
2010
The French tax authority does not have a clear position on the
subject (Direction Générale des Impots, 2006), however it gives
the precision that someone could use the HEP of a long-run period: 5% over the
last 100 year in France. For the French market, Damodoran (2011) and Salomons
& Grootveld (2003) recommend to use 4.91%, using a 1976-2001 timeframe. The
Credit Suisse in its Global Investment Returns Sourcebook of 2011 (Damodoran,
2011) recommends to use 6.0% for France (for a timeframe of 1900-2010,
including the 2008 crisis for short-term Governments). Table 8 summarizes the
different HEP obtained for the French market. Most of the observations are in
the range between 3.8% and 5%.
Claus & Thomas (2001)
Direction Générale des Impôts (2006)
Damodoran (2011)
Salomons & Grootveld (2003) Quiry & Le Fur (2012)
Fernandez (2010) for European markets
1985-1998 2.6%
100 years 5.0%
1900-2010 6.0%
1976-2001 4.91%
1900-2010 3.2%
Long term 3.8% to 4.3%
Average
4.26%
Table 4: Historical Equity Premium for the French
market
The small-capitalization premium is subject to controversies
in the early literature (Damodoran, 2011), however it seems that overall we can
observe some significant premia for small or micro-capitalization. Figure 11
represents the premium observed for micro-capitalization compare to all-US
stocks. We can easily see that during the 1980's and the major part of the
1990's the small firms did not perform more than the overall US stocks.
However, since 1999 it seems that this small firm premium is starting again to
be observed.
The other element we can learn from Figure 11 is that the
variability is really strong. Therefore, it explains easily that we find really
different positions in the literature, ranging from no premium to extreme
values. For example Bergstrom, Frashure & Chisholm (1991) consider that for
the French market this premium is 8.8% for a timeframe of 1955 to 1984. For the
same time frame, they found only 3.0% for the German market.
Dimson & Marsh (2001) considers that the micro-cap
geometric premium is 5.4% over all equities for a time-frame of 1955-1999 in UK
(the EEP obtained is 6.2% for all equities for the same time frame). This
premium for the US market seems to be lower according to Leonard (2009), with a
premium ranging from 2.38% to 2.47% for US micro-cap stocks over the overall
market (time frame: 1938- 2007). This micro-cap US premium has increased after
the Dotcom crisis, reaching 5.63 to 5.83% for the period Oct-2002 to Sept-2007
(Leonard, 2009). Israelsen (2009) found 1.81% premium for small-cap compare to
mid-cap and 2.8% for small-cap compare to large-cap for a 1980-2008 time frame.
Switzer (2010) considers that this premium has even increased more when we
consider a 2001-2010 time frame reaching 7.74% in the US. For the 1926-2010
time frame, this premium is 2.03% for the US. For Canada, this small-cap
premium seems to be lower, ranging from 0.10% (1987-2010) to 4.12% (2001-2010).
The most important finding of this work is that small-stocks have better premia
during the periods of recoveries (after the dotcom crisis, the 2008 crisis, or
the 1975 crisis). This is particularly essential today, as the overall economy
is still recovering from the 2008 financial crisis.
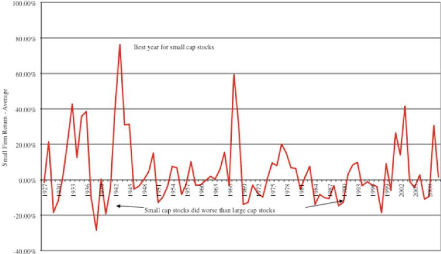
Figure 11: Small firm premium (bottom 10% of market cap
in US) between 1927-2010. Source: Damodoran 2010
Overall, the small and micro-cap premium observed ranges from
0.1% to 8.8%, depending on the market and the time frame studied. However, it
seems that this premium is increasing since 2000, because the economy has
experienced two important crisis since 2001. Moreover, it seems that the
premium seems to be higher in France from what have been observed by Bergstrom,
Franshure and Chisholm (1991). Table 5 presents a summary of our findings in
the literature.
|
Authors
|
|
Time frame
|
Small and micro-cap premium
|
|
Bergstrom, Frashure
|
&
|
1955-1984, France
|
8.8 %
|
|
Chisholm (1991)
|
|
|
|
|
Israelsen (2009)
|
|
1980-2008 US
|
1.8% to 2.8%
|
|
Leonard (2009)
|
|
2001-2007 US
|
5.63% to 5.83%
|
|
Leonard (2009)
|
|
1938-2007 US
|
2.38% to 2.47%
|
|
Switzer
|
|
2001-2010 Canada
|
4.12%
|
|
Switzer
|
|
1926-2010 Canada
|
0.10%
|
|
Switzer
|
|
2001-2010 US
|
7.74%
|
|
Switzer
|
|
1926-2010 US
|
2.03%
|
|
Mean
|
|
|
3.97%
|
Table 5: Historical Equity Premium for small and
micro-cap
For the recent time frame, which is the most appropriate time
frame considering the fact that the economy is in recovery since the major
crisis of 2008, authors considers that the HEP is ranging from 4.12% to 7.74%
(Table 5, Switzer, 2010). Moreover, this choice is supported by the fact that
many analysts agree on the fact that the soft commodities prices should
remain at a higher price in the coming years (OECD-FAO, 2010).
The expected market return should increase in the following years.
| 

