II PARTIE: Travail Pratique N2
EXERCICE
n=[5 1];
impulse=[1,zeros(1,5)];pulsetrain=[1,zeros(1,n)];
pulsetrain=[1,zeros(1,5)];
pulsetrain=[pulsetrain pulsetrain pulsetrain pulsetrain
pulsetrain]; step=[ones(1,50)]; phi=pi/20;
imagexp=[exp(j*(0:49)*phi)];
subplot(2,2,1);stem(impulse);
subplot(2,2,2);stem(pulsetrain);
subplot(2,2,3);stem(step);
subplot(2,2,4);stem(real(imagexp)); hold on;
stem(imag(imagexp));
a) Expliquer la fonction de chaque Commande :
impulse=[1,zeros(1,5)];
Stimule la réponse impulsionnelle d'un système de
t=1 à t=5
Résultat : impulse =
1 0 0 0 0 0
pulsetrain=[1,zeros(1,n)];
Permet d'obtenir une impulsion. La dite impulsion est
constitué d'un pic de tension (1) et d'un repos de n unités de
temps. nous avons pris dans ce cas n=5.
Résultat :
pulsetrain =
1 0 0 0 0 0
pulsetrain=[pulsetrain pulsetrain pulsetrain pulsetrain
pulsetrain]; Permet d'obtenir une série de 5 impulsions.
Résultat :
pulsetrain =
Columns 1 through 10
|
1 0 0 0 0 0
|
1
|
0
|
0
|
0
|
|
Columns 11 through 20
0 0 1 0 0 0
|
0
|
0
|
1
|
0
|
Columns 21 through 30
0 0 0 0 1 0 0 0 0 0
step=[ones(1,50)];
Stimule la réponse d'un système LTI de t=1 à
t=50 Résultat :
step =
Columns 1 through 10
|
1 1 1 1 1 1
|
1
|
1
|
1
|
1
|
|
Columns 11 through 20
1 1 1 1 1 1
|
1
|
1
|
1
|
1
|
|
Columns 21 through 30
1 1 1 1 1 1
|
1
|
1
|
1
|
1
|
|
Columns 31 through 40
1 1 1 1 1 1
|
1
|
1
|
1
|
1
|
|
Columns 41 through 50
1 1 1 1 1 1
|
1
|
1
|
1
|
1
|
imagexp=[exp(j*(0:49)*phi)];
Renvoie le module la fonction exp(j*k*phi) quelque soit k
appartenant à [0 ; 49] avec phi = ð/20.
Résultat :
imagexp =
Columns 1 through 3
1.0000 0.9877 + 0.1564i 0.9511 + 0.3090i
Columns 4 through 6
0.8910 + 0.4540i 0.8090 + 0.5878i 0.7071 + 0.7071i
Columns 7 through 9
|
0.5878 + 0.8090i 0.4540
|
+ 0.8910i
|
0.3090
|
+ 0.9511i
|
|
Columns 10 through 12
|
|
|
|
|
0.1564 + 0.9877i 0.0000
|
+ 1.0000i
|
-0.1564
|
+ 0.9877i
|
|
Columns 13 through 15
|
|
|
|
|
-0.3090 + 0.9511i -0.4540
|
+ 0.8910i
|
-0.5878
|
+ 0.8090i
|
|
Columns 16 through 18
|
|
|
|
|
-0.7071 + 0.7071i -0.8090
|
+ 0.5878i
|
-0.8910
|
+ 0.4540i
|
|
Columns 19 through 21
|
|
|
|
|
-0.9511 + 0.3090i -0.9877
|
+ 0.1564i
|
-1.0000
|
+ 0.0000i
|
|
Columns 22 through 24
|
|
|
|
|
-0.9877 - 0.1564i -0.9511
|
- 0.3090i
|
-0.8910
|
- 0.4540i
|
|
Columns 25 through 27
|
|
|
|
|
-0.8090 - 0.5878i -0.7071
|
- 0.7071i -0.5878
|
- 0.8090i
|
|
Columns 28 through 30
|
|
|
|
|
-0.4540 - 0.8910i -0.3090
|
- 0.9511i
|
-0.1564
|
- 0.9877i
|
|
Columns 31 through 33
|
|
|
|
|
-0.0000 - 1.0000i 0.1564
|
- 0.9877i
|
0.3090
|
- 0.9511i
|
|
Columns 34 through 36
|
|
|
|
|
0.4540 - 0.8910i 0.5878
|
- 0.8090i
|
0.7071
|
- 0.7071i
|
|
Columns 37 through 39
|
|
|
|
|
0.8090 - 0.5878i 0.8910
|
- 0.4540i
|
0.9511
|
- 0.3090i
|
|
Columns 40 through 42
|
|
|
|
|
0.9877 - 0.1564i 1.0000
|
- 0.0000i
|
0.9877
|
+ 0.1564i
|
Columns 43 through 45
Résultat :
0.9511 + 0.3090i 0.8910
|
+ 0.4540i
|
0.8090
|
+ 0.5878i
|
|
Columns 46 through 48
|
|
|
|
|
0.7071 + 0.7071i 0.5878
|
+ 0.8090i
|
0.4540
|
+ 0.8910i
|
|
Columns 49 through 50
|
|
|
|
|
0.3090 + 0.9511i 0.1564
|
+ 0.9877i
|
|
|
H = SUBPLOT(m,n,p)
Permet de représenter des graphiques dans une matrice m
sur n, et représente la figure courante à la P ième
position.
:
>> m=5; >> n=8; >> p=2; >> H = subplot
(m,n,p)
Résultat :

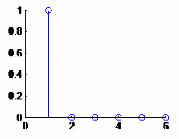
subplot (2 ,2 ,1) ; stem(impulse) ;
Affiche les séquences de données de Y comme des
segments partant de l'axe des abscisses et terminés par des cercles pour
des valeurs de données. Si Y est un tableau, alors chaque colonne est
représentée par une série séparée
subplot (2 ,2 ,2) ; stem(pulsetrain) ;
subplot (2 ,2 ,3) ; stem(step) ;
subplot (2 ,2 ,4) ; stem(real (imagexp)); hold on; stem
(imag(imagexp));
|