Annexe 4 : Résultats des tests
X
? Test de normalité des erreurs
xi
Skewness/Kurtosis tests for Normality
joint
Variable Obs Pr(Skewness) Pr(Kurtosis)
Adjchi2(2) Prob>chi2
résidus 55 0.1043 0.3574 3.68 0.1592
? Stationnarité sur les variables en niveau sur
données de panels
|
Tests
|
Statiques
|
P-values
|
N
|
NT
|
|
EMPL
|
LLC
|
-2,5058
|
0,0061**
|
5
|
55
|
|
IPS
|
-1,9776
|
0,0240**
|
5
|
55
|
|
ADF
|
-2,3814
|
0,0086**
|
5
|
55
|
|
PROD
|
LLC
|
-1,1517
|
0,1247
|
5
|
55
|
|
IPS
|
1,5080
|
0,9342
|
5
|
55
|
|
ADF
|
-0,0831
|
0,4669
|
5
|
55
|
|
SAL
|
LLC
|
-3,3106
|
0,0005**
|
5
|
55
|
|
IPS
|
-0,0359
|
0,4857
|
5
|
55
|
|
ADF
|
0,0083
|
0,5033
|
5
|
55
|
|
CAP
|
LLC
|
-1,1266
|
0,1300
|
5
|
55
|
|
IPS
|
1,2067
|
0,8862
|
5
|
55
|
|
ADF
|
1,7074
|
0,9561
|
5
|
55
|
|
LEMPL
|
LLC
|
-1600
|
0,0000**
|
5
|
55
|
|
IPS
|
-1600
|
0,0000**
|
5
|
55
|
|
ADF
|
-14,2130
|
0,0000**
|
5
|
55
|
**Signifie que la série est stationnaire en niveau.
? Stationnarité en différence
première sur les variables en niveau sur données de
panels
|
Tests
|
Statiques
|
P-values
|
N
|
NT
|
|
PROD
|
LLC
|
-5,5088
|
0,0000*
|
5
|
55
|
|
IPS
|
-1,2931
|
0,0980
|
5
|
55
|
|
ADF
|
-1,9187
|
0,0275*
|
5
|
55
|
|
SAL
|
LLC
|
-7,8480
|
0,0000*
|
5
|
55
|
|
IPS
|
-3,7690
|
0,0001*
|
5
|
55
|
|
ADF
|
-5,0491
|
0,0000*
|
5
|
55
|
|
CAP
|
LLC
|
-5,6109
|
0,0000*
|
5
|
55
|
|
IPS
|
-2,1572
|
0,0155*
|
5
|
55
|
|
ADF
|
-2,6440
|
0,0041*
|
5
|
55
|
*Signifie que la série est stationnaire en première
différence.
XII
Annexe5:Résultat de l'estimation du
modèle :
XIII
Dynamic panel-data estimation, one-step system
GMM
|
Group variable: secteurs
Time variable :
année
|
|
|
|
|
|
z
|
P>|z|
|
Number of obs =
Number of groups
=
|
|
Number of instruments =
7
|
.061948
|
.0192627
|
3.22
|
0.001
|
Obs per group: min
=
.0241939
|
|
|
Wald chi2(5) =
113.95
|
.6213777
|
.1739292
|
3.57
|
0.000
|
avg =
.2804827
|
|
|
Prob > chi2 =
0.000
|
-2.480102
|
.9598164
|
-2.58
|
0.010
|
max =
-4.361308
|
|
|
.365497
|
.0599063
|
6.10
|
0.000
|
.2480829
|
|
|
-.0335168
|
.0295965
|
-1.13
|
0.257
|
-.0915249
|
|
|
empl
|
Coef.
11.90234
|
Std. Err.
.7312918
|
16.28
|
0.000
|
10.46903
|
|
Robust
lempl
Instruments for first differences
equation
dsal
Standard
dcap
D.(dsal dcap t dprod)
55
11
11.00
11
[95% Conf. Interval]
.0997022
.9622726
-.5988968
dprod
.4829112
.0244912
13.33564
GMM-type (missing=0, separate instruments for each
period unless collapsed)
t
L.lempl collapsed
_cons
Instruments for levels equation
Standard
dsal dcap t dprod
_cons
GMM-type (missing=0, separate instruments for each
period unless collapsed)
D.lempl collapsed
5
Arellano-Bond test for AR(1) in first differences:
z = -1.20 Pr > z =
0.231 Arellano-Bond test for AR(2) in first differences:
z = -0.01 Pr > z = 0.988
Sargan test of overid. restrictions:
chi2(1) = 3.44 Prob > chi2 =
0.064
(Not robust, but not weakened by many
instruments.)
Hansen test of overid. restrictions:
chi2(1) = 0.00 Prob > chi2 =
1.000
(Robust, but weakened by many
instruments.)
Difference-in-Hansen tests of exogeneity of
instrument subsets:
GMM instruments for levels
Hansen test excluding group:
chi2(0) = 0.00 Prob > chi2 =
.
Difference (null H =
exogenous): chi2(1) = -0.00 Prob > chi2 =
1.000
xiv
Annexe 6 : Chaine besoin-emploi
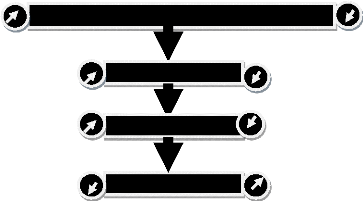
Demande de biens de consommation et de production
Niveau de la production
Niveau de l'emploi
Niveau de chômage

Augmentation.
Baisse.
Annexe7:Consommation globale et PIB de 2008
à 2010.
|
2007
|
2008
|
2009
|
2010
|
|
consommation
|
2 933 474
|
3 170 975
|
3 490 121
|
3 718 536
|
|
PIB
|
3 166 330
|
3 445 064
|
3 846 692
|
4 274 828
|
|
variation de la consommation
|
néant
|
237 501
|
319 146
|
228 415
|
|
variation du PIB
|
néant
|
278 734
|
401 628
|
428 136
|
|
pmc
|
néant
|
0,85207043
|
0,79463085
|
0,53351038
|
|
Moyenne pmc
|
0,72673722
|
Source INSD, TRE 2007, 2008, 2009, 2010.
xv
Annexe 8 : Diagramme circulaire de la
Production
Production
7% agriculture et elevage
administration
publique commerce
industrie
transport et
telecomminication

13%
32%
29%
19%
Annexe 9 : Diagramme circulaire du
salaire
salaire agriculture et elevage
9% 4% 8%
administration publique commerce
75%
industrie
transport et
telecomminication
4%

Capital
agriculture et élevage
administration publique
commerce industrie
transport et
telecomminication


0,2%%
30,2%
31%
35,26%
3,46%
Annexe 10 : Diagramme circulaire du
capital
| 

