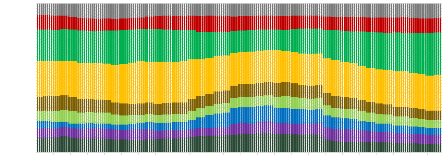
5.4. Portfolio weights analysis
As can be seen from the asset allocation weights graphs,
portfolios of traditional assets under inverse volatility and maximum
diversification strategies are more diversified. On the other hand, Conditional
Value at Risk strategy sets extreme weight allocations to bonds indices
followed by S&P 500 since they exhibit the least volatility. Therefore, the
C-var optimizer omits weighting other indices, which performed really bad and
were highly volatile during estimation periods. This results in the basis
portfolio exhibiting the best performance under this strategy with a Sharpe of
1.07.
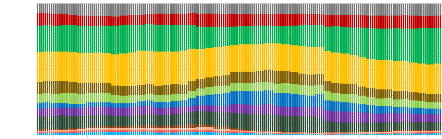
When cryptocurrencies are included, I notice that the
weighting scheme of other asset classes fluctuates to compensate for the
additional volatility. Equity indices weights change the most during the sample
period. I observe a significant increase in S&P 500 proportion but also a
small position taken in gold. In addition, through the whole investment period,
optimal portfolios contain between 0 and 3% of cryptocurrencies with the higher
allocation share during the years 2016-2017, the period of tremendous growth
for cryptocurrencies. Indeed, cryptocurrencies are considered too risky for the
parameters of the optimization problem.
It is also noticeable that Bitcoin dominates over alternative
cryptocurrencies. In fact, none of the Altcoins is given more than 1% weight
during the whole optimization process.
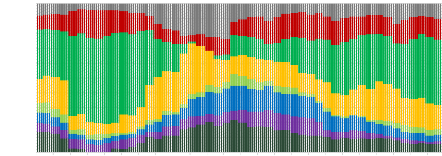
Regarding risk budgeting approaches, I observe that portfolio
assets do not fluctuate that much when adding cryptocurrencies. Moreover, the
weight allocated to cryptocurrencies is larger under those two strategies.
Until 2017, there is an increasing allocation in cryptocurrencies. However, it
decreases drastically after the Bitcoin boom.
20
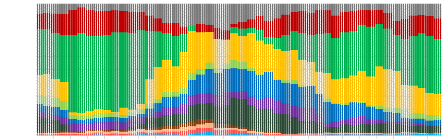
Furthermore, the Maximum Diversification strategy, which
boosted the performance of investments significantly, invests between 0 and 10%
in cryptocurrencies. Thus, the higher cryptocurrency exposure had a huge impact
on maximizing the portfolio performance.
5.5. Robustness check
To assess the robustness of the trading strategies results,
tables 12, 13, 14 and 15 present performance results using weekly data and
monthly rebalancing.
The results of the study are robust with regard to the asset
allocations employed. I find that cryptocurrencies always add substantial value
when included in the stocks-bonds-alternative investments portfolio. Sharpe
ratio increases significantly under the different optimization frameworks.
However, similar results regarding the downside risk of the basis portfolio are
found when using weekly data. Alternative cryptocurrencies worsen of the
maximum drawdown of the portfolio whereas Bitcoin increases slightly the
maximum drawdown under Inverse volatility and minimum variance strategies.
Interestingly, Minimum conditional value at risk performs
better than maximum diversification and yields the highest Sharpe Ratio when
cryptocurrencies are added.
6. Conclusion
This study seeks to address the possible hedging and
diversification benefits of cryptocurrencies as an alternative investment. From
the perspective of a global investor, I investigate the market linkages between
Cryptocurrencies and global asset indices as well as the benefits of their
inclusion within these assets.
21
Using the dynamic conditional correlation model, I find that
block-chain assets can act as effective diversifiers for the investment period
analyzed. I also detect that the correlation of traditional assets against
Bitcoin are closer to zero and more stable than against over crypto-tokens.
Moreover, I find that Bitcoin, Dash and Litecoin do possess hedging properties
against some assets' indices. However, none of the cryptocurrencies acts as
hedge against European, American and emerging market equities.
The resulting diversification properties further endorse the
cryptocurrencies use case in a diversified portfolio. These findings are useful
for global investors seeking protection from markets downward movements. I
examine the out of sample performance of portfolios with and without
cryptocurrencies via risk-based investment strategies: minimum variance,
minimum conditional value at risk, inverse volatility and maximum
diversification.
The results are in line with previous research regarding the
inclusion of Bitcoin in a global portfolio of equities, bonds and alternative
assets. I find that the risk return efficiency is enhanced under all
strategies. The small increase in volatility was compensated with
proportionally greater returns.
Despite their extreme volatility, the addition of alternative
cryptocurrencies to a global diversified portfolio, which already contains
Bitcoin, enhances the risk return reward. However, these crypto-assets yield
higher volatility and higher maximum drawdown under all strategies. Further,
the performance of the portfolio is boosted significantly under inverse
volatility and maximum diversification. In fact, these modern risk based
strategies prompt higher risk return reward via greater cryptocurrency exposure
and especially greater alternative cryptos exposure. On the other side, due to
their volatility structure, Minimum variance and Minimum C-var strategies
invested in cryptocurrencies and particularly in Bitcoin only in certain points
of time.
22
Moreover, the hedging properties of Cryptocurrencies are
analyzed via the portfolios maximum drawdown. When adding Bitcoin, I find that
it slightly drops under minimum variance and inverse volatility strategy.
However, when Dash, Ripple and Litecoin are further added, the maximum drawdown
increases under the four optimization models.
As robustness checking, I apply the aforementioned allocation
strategies using weekly data. Results persist robustly. Cryptocurrencies
enhance the portfolio performance on risk-adjusted basis but do not really
decrease the portfolio downside risk.
In a nutshell, the study evidence suggests that
cryptocurrencies can act as outstanding diversifier tools on a global
perspective but do not offer appealing hedging properties.
However, the results of this study should be interpreted with
caution. This analysis employs only limited asset allocation strategies. The
sample period is small due to the short history of cryptocurrencies and better
alternative to the selected cryptocurrencies might exist.
23
Appendix:
Table 1: Descriptive statistics of traditional
assets.
Summary statistics of daily log returns for traditional assets
from 31 July 2014 to 30 April 2019. (N=1238 observations). Results are reported
on a percentage basis apart from skewness, kurtosis, Sharpe ratio, the JB and
LJBox tests. In addition, Sharpe ratio is annualized.
|
S&P 500 Eurostoxx 50
|
SSE A
shares
|
Nikkei 225
|
MSCI Markets EM
|
IBOXX LIG
|
S&P GSD
|
FTSE EPRA NAREIT
|
S&P GSCI GOLD
|
|
Mean
|
0.042
|
0.008
|
0.027
|
0.030
|
0.011
|
0.014
|
0.002
|
0.022
|
-0.002
|
|
Standard Deviation
|
0.833
|
1.117
|
1.507
|
1.136
|
0.897
|
0.295
|
0.354
|
0.792
|
0.815
|
|
Skewness
|
-0.448
|
-0.786
|
-1.190
|
-0.261
|
-0.311
|
-0.332
|
-0.002
|
-0.748
|
0.271
|
|
Kurtosis
|
7.068
|
12.335
|
10.063
|
7.079
|
4.721
|
3.926
|
5.312
|
9.167
|
6.036
|
|
Minimum
|
-4.184
|
-11.102
|
-8.869
|
-5.742
|
-5.101
|
-1.451
|
-1.922
|
-6.912
|
-3.418
|
|
1% percentile
|
-2.520
|
-3.037
|
-6.109
|
-3.460
|
-2.330
|
-0.741
|
-0.950
|
-2.271
|
-2.252
|
|
5% quantile
|
-1.427
|
-1.709
|
-2.221
|
-1.791
|
-1.501
|
-0.492
|
-0.580
|
-1.235
|
-1.353
|
|
25% quantile
|
-0.255
|
-0.574
|
-0.473
|
-0.486
|
-0.511
|
-0.157
|
-0.187
|
-0.373
|
-0.404
|
|
Median
|
0.029
|
0.039
|
0.032
|
0.063
|
0.060
|
0.015
|
0.000
|
0.052
|
0.000
|
|
75% percentile
|
0.445
|
0.577
|
0.606
|
0.614
|
0.540
|
0.198
|
0.197
|
0.464
|
0.411
|
|
99% percentile
|
2.103
|
2.925
|
4.183
|
3.003
|
2.172
|
0.685
|
0.939
|
1.977
|
2.176
|
|
Maximim
|
4.842
|
5.567
|
5.599
|
6.414
|
3.228
|
0.938
|
1.802
|
3.622
|
4.590
|
|
Sharpe Ratio
|
0.800
|
0.117
|
0.285
|
0.414
|
0.193
|
0.767
|
0.013
|
0.442
|
-0.044
|
|
Jarque Bera Test
|
894.984
|
4622.047
|
2865.479
|
872.227
|
172.802
|
66.976
|
275.770
|
2077.435
|
490.681
|
|
Ljung Box Test
|
18.779
|
40.143
|
69.939
|
105.296
|
69.638
|
39.657
|
24.314
|
43.257
|
20.791
|
|
Critical Value Jarque Bera Test
|
5.943
|
|
|
|
|
|
|
|
|
Critical Value Ljung Box Test
|
31.400
|
|
|
|
|
|
|
|
24
Table 2: Descriptive statistics of
cryptocurrencies.
Summary statistics of daily log returns for cryptocurrencies from
31 July 2014 to 30 April 2019. (N=1238 observations).
|
Bitcoin
|
Ripple
|
Dash
|
Litecoin
|
|
Mean
|
0.179
|
0.330
|
0.242
|
0.185
|
|
Standard Deviation
|
4.394
|
7.513
|
7.522
|
6.945
|
|
Skewness
|
-0.210
|
2.381
|
0.015
|
1.000
|
|
Kurtosis
|
8.206
|
20.257
|
27.050
|
15.789
|
|
Minimum
|
-23.874
|
-35.328
|
-86.020
|
-51.393
|
|
1% percentile
|
-13.533
|
-18.051
|
-19.343
|
-15.550
|
|
5% quantile
|
-7.056
|
-9.364
|
-9.759
|
-8.994
|
|
25% quantile
|
-1.423
|
-2.430
|
-2.845
|
-2.138
|
|
Median
|
0.222
|
-0.345
|
-0.276
|
0.000
|
|
75% percentile
|
1.890
|
2.089
|
2.990
|
1.822
|
|
99% percentile
|
13.828
|
27.293
|
23.589
|
26.831
|
|
Maximim
|
22.512
|
75.083
|
76.818
|
53.980
|
|
Sharpe Ratio
|
0.645
|
0.698
|
0.511
|
0.422
|
|
Jarque Bera Test
|
1406.84
|
16530.00
|
29834.76
|
8643.49
|
|
Ljung Box Test
|
31.76
|
91.30
|
26.56
|
36.60
|
|
Critical Value Jarque Bera Test
|
|
5.94
|
|
|
|
Critical Value Ljung Box Test
|
|
31.40
|
|
|
25
Table 3: Correlation matrix
This table shows unconditional pairwise correlation coefficients
between cryptocurrencies and traditional assets from 31 July 2014 to 30 April
2019.
|
Bitcoin
|
Ripple
|
Dash
|
Litecoin
|
S&P500
|
Eurostoxx
50
|
SSE A
Shares
|
Nikkei
225
|
MSCI
EM
|
IBOXX
LIG
|
S&P
GSD
|
FTSE
EPRA
|
S&P
GSCI
GOLD
|
|
Bitcoin
|
1.000
|
0.330
|
0.485
|
0.592
|
0.039
|
0.036
|
0.012
|
-0.037
|
0.016
|
-0.023
|
0.010
|
-0.019
|
0.023
|
|
Ripple
|
|
1.000
|
0.254
|
0.332
|
0.053
|
0.030
|
-0.007
|
0.020
|
0.063
|
0.035
|
0.033
|
0.010
|
0.026
|
|
Dash
|
|
|
1.000
|
0.431
|
0.080
|
0.068
|
0.030
|
-0.013
|
0.049
|
-0.073
|
-0.037
|
-0.017
|
-0.006
|
|
Litecoin
|
|
|
|
1.000
|
0.026
|
0.004
|
-0.015
|
-0.026
|
0.007
|
-0.006
|
0.009
|
-0.015
|
-0.016
|
|
S&P500
|
|
|
|
|
1.000
|
0.493
|
0.162
|
0.065
|
0.441
|
-0.193
|
-0.214
|
0.515
|
-0.138
|
|
Eurostoxx 50
|
|
|
|
|
|
1.000
|
0.127
|
0.160
|
0.578
|
-0.125
|
-0.026
|
0.256
|
-0.099
|
|
SSE A Shares
|
|
|
|
|
|
|
1.000
|
0.211
|
0.413
|
0.013
|
-0.101
|
0.230
|
-0.058
|
|
Nikkei 225
|
|
|
|
|
|
|
|
1.000
|
0.416
|
0.203
|
0.124
|
0.181
|
0.102
|
|
MSCI EM
|
|
|
|
|
|
|
|
|
1.000
|
0.022
|
-0.032
|
0.435
|
0.018
|
|
IBOXX LIG
|
|
|
|
|
|
|
|
|
|
1.000
|
0.446
|
0.108
|
0.280
|
|
S&P GSD
|
|
|
|
|
|
|
|
|
|
|
1.000
|
-0.373
|
0.558
|
|
FTSE EPRA
|
|
|
|
|
|
|
|
|
|
|
|
|
|
|
NAREIT
|
|
|
|
|
|
|
|
|
|
|
|
1.000
|
-0.177
|
|
S&P GSCI
|
|
|
|
|
|
|
|
|
|
|
|
|
|
|
GOLD
|
|
|
|
|
|
|
|
|
|
|
|
|
1.000
|
26
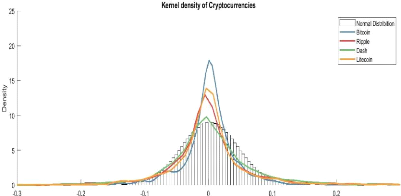
Figure 1 : Density of
Cryptocurrencies.
The following figure illustrates Gaussian kernel density
estimators of cryptocurrencies against fitted normal distribution.
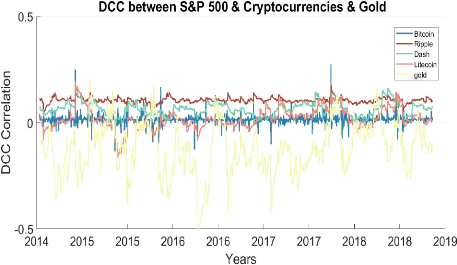
The subsequent tables summarize the dynamic conditional
correlations between daily returns of the four cryptocurrencies and traditional
asset class. Standard deviations are expressed in percentage.
Table 4: DCC statistics for traditional assets against
Bitcoin
|
Mean
|
Std.deviation
|
Minimum
|
Median
|
Maximum
|
25%
quantile
|
75% quantile
|
|
S&P 500
|
0.0146
|
2.2501%
|
-0.1343
|
0.0147
|
0.2738
|
0.0099
|
0.0194
|
|
Eurostoxx 50
|
0.0648
|
0.0022%
|
0.0648
|
0.0648
|
0.0649
|
0.0648
|
0.0648
|
|
SSE_A shares
|
-0.0056
|
0.0038%
|
-0.0061
|
-0.0056
|
-0.0052
|
-0.0056
|
-0.0056
|
|
Nikkei 225
|
-0.0374
|
3.2494%
|
-0.0977
|
-0.0317
|
0.0194
|
-0.0693
|
-0.0102
|
|
MSCI EM
|
0.0196
|
0.0002%
|
0.0196
|
0.0196
|
0.0196
|
0.0196
|
0.0196
|
|
IBOXX LIG
|
-0.0149
|
0.0002%
|
-0.0150
|
-0.0149
|
-0.0149
|
-0.0149
|
-0.0149
|
|
S&P GSD
|
0.0112
|
0.2561%
|
-0.0252
|
0.0112
|
0.0243
|
0.0106
|
0.0118
|
|
FTSE EPRA
|
|
|
|
|
|
|
|
|
NAREIT
|
-0.0320
|
0.2980%
|
-0.0541
|
-0.0321
|
-0.0029
|
-0.0331
|
-0.0310
|
|
S&P GSCI gold
|
0.0166
|
0.0002%
|
0.0165
|
0.0166
|
0.0166
|
0.0166
|
0.0166
|
27
Table 5: DCC statistics for traditional assets against
Ripple
|
Mean
|
Std.deviation
|
Minimum
|
Median
|
Maximum
|
25% quantile
|
75% quantile
|
|
S&P 500
|
0.064
|
3.12%
|
-0.009
|
0.064
|
0.173
|
0.040
|
0.082
|
|
Eurostoxx 50
|
0.044
|
0.00%
|
0.044
|
0.044
|
0.044
|
0.044
|
0.044
|
|
SSE_A shares
|
0.004
|
7.65%
|
-0.255
|
-0.002
|
0.337
|
-0.040
|
0.048
|
|
Nikkei 225
|
0.013
|
2.13%
|
-0.049
|
0.011
|
0.094
|
0.000
|
0.025
|
|
MSCI EM
|
0.073
|
2.56%
|
-0.010
|
0.071
|
0.200
|
0.059
|
0.084
|
|
IBOXX LIG
|
0.018
|
0.13%
|
0.007
|
0.018
|
0.026
|
0.018
|
0.018
|
|
S&P GSD
|
0.034
|
0.00%
|
0.034
|
0.034
|
0.034
|
0.034
|
0.034
|
|
FTSE EPRA
|
|
|
|
|
|
|
|
|
NAREIT
|
0.020
|
4.48%
|
-0.312
|
0.019
|
0.338
|
0.002
|
0.037
|
|
S&P GSCI gold
|
0.026
|
0.00%
|
0.026
|
0.026
|
0.026
|
0.026
|
0.026
|
Table 6: DCC statistics for traditional assets against
DASH.
|
Mean
|
Std.deviation
|
Minimum
|
Median
|
Maximum 25% quantile 75% quantile
|
|
S&P 500
|
0.11
|
1.4%
|
0.03
|
0.10
|
0.18
|
0.10
|
0.11
|
|
Eurostoxx 50
|
0.10
|
3.1%
|
-0.08
|
0.10
|
0.27
|
0.09
|
0.11
|
|
SSE_A shares
|
0.04
|
0.0%
|
0.04
|
0.04
|
0.04
|
0.04
|
0.04
|
|
Nikkei 225
|
0.02
|
0.7%
|
-0.03
|
0.02
|
0.11
|
0.02
|
0.03
|
|
MSCI EM
|
0.08
|
2.5%
|
0.00
|
0.08
|
0.18
|
0.07
|
0.10
|
|
IBOXX LIG
|
-0.07
|
0.0%
|
-0.07
|
-0.07
|
-0.07
|
-0.07
|
-0.07
|
|
S&P GSD
|
-0.04
|
0.0%
|
-0.04
|
-0.04
|
-0.04
|
-0.04
|
-0.04
|
|
FTSE EPRA
|
|
|
|
|
|
|
|
|
NAREIT
|
-0.01
|
8.2%
|
-0.45
|
-0.01
|
0.49
|
-0.05
|
0.03
|
|
S&P GSCI gold
|
-0.02
|
2.1%
|
-0.26
|
-0.02
|
0.10
|
-0.02
|
-0.01
|
28
Table 7: DCC statistics for traditional assets against
Litecoin
|
Mean
|
Std.deviation Minimum
|
Median
|
Maximum
|
25% quantile 75% quantile
|
|
S&P 500
|
0.018
|
4.89%
|
-0.164
|
0.011
|
0.192
|
-0.010
|
0.040
|
|
Eurostoxx 50
|
0.035
|
1.88%
|
-0.036
|
0.035
|
0.120
|
0.027
|
0.043
|
|
SSE_A shares
|
-0.027
|
2.90%
|
-0.099
|
-0.029
|
0.042
|
-0.044
|
-0.014
|
|
Nikkei 225
|
-0.021
|
0.00%
|
-0.021
|
-0.021
|
-0.021
|
-0.021
|
-0.021
|
|
MSCI EM
|
0.020
|
2.47%
|
-0.086
|
0.020
|
0.110
|
0.006
|
0.033
|
|
IBOXX LIG
|
-0.010
|
4.31%
|
-0.129
|
-0.009
|
0.181
|
-0.031
|
0.012
|
|
S&P GSD
|
0.001
|
0.00%
|
0.001
|
0.001
|
0.001
|
0.001
|
0.001
|
|
FTSE EPRA
|
|
|
|
|
|
|
|
|
NAREIT
|
-0.016
|
0.00%
|
-0.017
|
-0.016
|
-0.016
|
-0.016
|
-0.016
|
|
S&P GSCI gold
|
-0.016
|
5.46%
|
-0.207
|
-0.009
|
0.154
|
-0.046
|
0.018
|
Figure 2 : Dynamic conditional correlation plot of
S&P 500 against cryptocurrencies and gold.
29
The following tables present the performance of the three
optimal portfolios: Portfolio I: a portfolio of traditional assets, which
encompasses equities, bonds and alternative investments. Portfolio II: a
portfolio of traditional assets and Bitcoin. Portfolio III: a portfolio of
traditional assets, Bitcoin and alternative cryptocurrencies. Four different
optimization frameworks are performed subsequently: Minimum variance, Minimum
Conditional Value at Risk, Inverse Volatility and Maximum Diversification
frameworks. I use a 200 days moving window and the out of sample period ranges
from May-08-2015 to April-30-2019. Sharpe ratio, mean daily return and standard
deviation are annualized.
|
Table 8: Minimum Variance strategy
|
|
|
Portfolio I
|
Portfolio II
|
Portfolio III
|
|
Mean (%)
|
3.81%
|
4.14%
|
4.60%
|
|
Standard deviation (%)
|
3.62%
|
3.62%
|
3.64%
|
|
Skewness
|
-0.45
|
-0.44
|
-0.43
|
|
Kurtosis
|
5.30
|
5.24
|
5.06
|
|
Maximum drawdown (%)
|
5.43%
|
5.37%
|
5.45%
|
|
Cumulative wealth
|
1.16
|
1.17
|
1.19
|
|
Sharpe ratio
|
1.05
|
1.14
|
1.26
|
Table 9: Minimum conditional value at risk
strategy
|
Portfolio I
|
Portfolio II
|
Portfolio III
|
|
Mean (%)
|
3.80%
|
4.51%
|
5.08%
|
|
Standard deviation (%)
|
3.64%
|
3.85%
|
3.94%
|
|
Skewness
|
-0.41
|
-0.36
|
-0.37
|
|
Kurtosis
|
5.25
|
5.13
|
5.09
|
|
Maximum drawdown (%)
|
5.50%
|
5.70%
|
6.93%
|
|
Cumulative wealth
|
1.16
|
1.19
|
1.21
|
|
Sharpe ratio
|
1.04
|
1.17
|
1.29
|
30
|
Table 10 : Inverse volatility strategy.
|
|
|
Portfolio I
|
Portfolio II
|
Portfolio III
|
|
Mean (%)
|
2.91%
|
4.42%
|
7.67%
|
|
Standard deviation (%)
|
5.17%
|
5.20%
|
5.88%
|
|
Skewness
|
-0.39
|
-0.46
|
-0.45
|
|
Kurtosis
|
5.35
|
5.53
|
5.57
|
|
Maximum drawdown (%)
|
11.85%
|
10.39%
|
11.70%
|
|
Cumulative wealth
|
1.12
|
1.18
|
1.32
|
|
Sharpe ratio
|
0.56
|
0.85
|
1.30
|
Table 11 : Maximum diversification
strategy.
|
Portfolio I
|
Portfolio II
|
Portfolio III
|
|
Mean (%)
|
3.31%
|
5.94%
|
8.75%
|
|
Standard deviation (%)
|
4.50%
|
4.86%
|
5.65%
|
|
Skewness
|
-0.37
|
-0.31
|
0.07
|
|
Kurtosis
|
5.08
|
4.91
|
7.09
|
|
Maximum drawdown (%)
|
8.15%
|
9.40%
|
9.46%
|
|
Cumulative wealth
|
1.13
|
1.24
|
1.36
|
|
Sharpe ratio
|
0.73
|
1.22
|
1.54
|
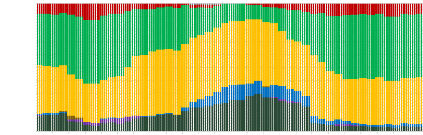
FIGURES: Weight Allocation
The following graphs display the weight allocation for
traditional assets and cryptocurrencies from 8 May 2015 until 30 April 2019
under the following strategies: minimum conditional value at risk, inverse
volatility, and maximum diversification.
Minimum Conditional Value at Risk
Portfolio of traditional
assets
08.05.2015 08.07.2015 08.09.2015 08.11.2015 08.01.2016 08.03.2016
08.05.2016 08.07.2016 08.09.2016 08.11.2016 08.01.2017 08.03.2017 08.05.2017
08.07.2017 08.09.2017 08.11.2017 08.01.2018 08.03.2018 08.05.2018 08.07.2018
08.09.2018 08.11.2018 08.01.2019 08.03.2019
1,00
0,90
0,80
0,70
Weights
0,60
0,50
0,40
0,30
0,20
0,10
0,00
Year
S&P 500 Eurostoxx 50 SSE A Shares Nikkei 225 MSCI EM
IBOXX LIG S&P GSD FTSE EPRA NAREIT S&P GSCI GOLD
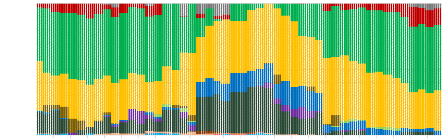
Minimum Conditional Value at Risk Portfolio of tradtional assets
and cryptocurrencies
08.05.2015 08.07.2015 08.09.2015 08.11.2015 08.01.2016 08.03.2016
08.05.2016 08.07.2016 08.09.2016 08.11.2016 08.01.2017 08.03.2017 08.05.2017
08.07.2017 08.09.2017 08.11.2017 08.01.2018 08.03.2018 08.05.2018 08.07.2018
08.09.2018 08.11.2018 08.01.2019 08.03.2019
1,00
0,90
0,80
0,70
Weights
0,60
0,50
0,40
0,30
0,20
0,10
0,00
31
Year
Bitcoin Ripple Dash Litecoin S&P500
Eurostoxx 50 SSE A Shares Nikkei 225 MSCI EM IBOXX LIG
S&P GSD FTSE EPRA NAREIT S&P GSCI GOLD
Inverse Volatility
Portfolio of traditional assets
08.05.2015 08.07.2015 08.09.2015 08.11.2015 08.01.2016 08.03.2016
08.05.2016 08.07.2016 08.09.2016 08.11.2016 08.01.2017 08.03.2017 08.05.2017
08.07.2017 08.09.2017 08.11.2017 08.01.2018 08.03.2018 08.05.2018 08.07.2018
08.09.2018 08.11.2018 08.01.2019 08.03.2019
1,00
0,90
0,80
0,70
Weights
0,60
0,50
0,40
0,30
0,20
0,10
0,00
Year
S&P 500 Eurostoxx 50 SSE A Shares Nikkei 225 MSCI EM
IBOXX LIG S&P GSD FTSE EPRA NAREIT S&P GSCI GOLD
Inverse Volatility
Portfolio of traditional assets and
cryptocurrencies
08.05.2015 08.07.2015 08.09.2015 08.11.2015 08.01.2016 08.03.2016
08.05.2016 08.07.2016 08.09.2016 08.11.2016 08.01.2017 08.03.2017 08.05.2017
08.07.2017 08.09.2017 08.11.2017 08.01.2018 08.03.2018 08.05.2018 08.07.2018
08.09.2018 08.11.2018 08.01.2019 08.03.2019
1,00
0,90
0,80
0,70
Weights
0,60
0,50
0,40
0,30
0,20
0,10
0,00
32
Year
Bitcoin Ripple Dash Litecoin S&P500
Eurostoxx 50 SSE A Shares Nikkei 225 MSCI EM IBOXX LIG
S&P GSD FTSE EPRA NAREIT S&P GSCI GOLD
Maximum Diversification
Portfolio of traditional
assets
08.05.2015 08.07.2015 08.09.2015 08.11.2015 08.01.2016 08.03.2016
08.05.2016 08.07.2016 08.09.2016 08.11.2016 08.01.2017 08.03.2017 08.05.2017
08.07.2017 08.09.2017 08.11.2017 08.01.2018 08.03.2018 08.05.2018 08.07.2018
08.09.2018 08.11.2018 08.01.2019 08.03.2019
1,00
0,90
0,80
0,70
Weights
0,60
0,50
0,40
0,30
0,20
0,10
0,00
Year
S&P 500 Eurostoxx 50 SSE A shares Nikkei 225 MSCI EM
IBOXX LIG S&P GSD FTSE EPRA NAREIT S&P GSCI GOLD
Maximum Diversification
Portfolio of traditional assets and
crytocurrencies
08.05.2015 08.07.2015 08.09.2015 08.11.2015 08.01.2016 08.03.2016
08.05.2016 08.07.2016 08.09.2016 08.11.2016 08.01.2017 08.03.2017 08.05.2017
08.07.2017 08.09.2017 08.11.2017 08.01.2018 08.03.2018 08.05.2018 08.07.2018
08.09.2018 08.11.2018 08.01.2019 08.03.2019
1,00
0,90
0,80
0,70
Weights
0,60
0,50
0,40
0,30
0,20
0,10
0,00
33
Year
Bitcoin Ripple Dash Litecoin S&P500
Eurostoxx 50 SSE A Shares Nikkei 225 MSCI EM IBOXX LIG
S&P GSD FTSE EPRA NAREIT S&P GSCI GOLD
34
The subsequent tables present the results obtained from the
robustness check. It reports the performance of the optimal portfolios when
using weekly data. I use 40 weeks (Equivalent of 200 trading days) moving
window and the out of sample period ranges from May-08-2015 to April-30-2019.
Sharpe ratio, mean daily return and standard deviation are annualized.
|
Table 12: Minimum variance strategy
|
|
|
Portfolio I
|
Portfolio II
|
Portfolio III
|
|
Mean (%)
|
3.38%
|
4.08%
|
5.64%
|
|
Standard deviation (%)
|
4.29%
|
4.31%
|
4.53%
|
|
Skewness
|
-1.17
|
-1.26
|
-1.01
|
|
Kurtosis
|
10.07
|
10.31
|
8.93
|
|
Maximum drawdown (%)
|
6.97%
|
6.50%
|
7%
|
|
Cumulative wealth
|
1.13
|
1.16
|
1.22
|
|
Sharpe ratio
|
0.79
|
0.95
|
1.24
|
Table 13: Minimum conditional value at risk
strategy
|
Portfolio I
|
Portfolio II
|
Portfolio III
|
|
Mean (%)
|
3.30%
|
4.36%
|
10.40%
|
|
Standard deviation (%)
|
4.45%
|
5.15%
|
6.07%
|
|
Skewness
|
-1.30
|
-2.54
|
-1.53
|
|
Kurtosis
|
14.30
|
21.90
|
14.09
|
|
Maximum drawdown (%)
|
7.00%
|
8.74%
|
9.00%
|
|
Cumulative wealth
|
1.14
|
1.17
|
1.39
|
|
Sharpe ratio
|
0.74
|
0.85
|
1.60
|
35
|
Table 14: Inverse volatility strategy
|
|
|
Portfolio I
|
Portfolio II
|
Portfolio III
|
|
Mean (%)
|
3.00%
|
4.59%
|
8.16%
|
|
Standard deviation (%)
|
6.15%
|
6.23%
|
6.85%
|
|
Skewness
|
-0.78
|
-0.83
|
-0.66
|
|
Kurtosis
|
5.75
|
5.81
|
4.73
|
|
Maximum drawdown (%)
|
10.83%
|
9.83%
|
11.0%
|
|
Cumulative wealth
|
1.11
|
1.18
|
1.32
|
|
Sharpe ratio
|
0.49
|
0.74
|
1.19
|
|
Table 15: Maximum diversification strategy
|
|
|
Portfolio I
|
Portfolio II
|
Portfolio III
|
|
Mean (%)
|
3.11%
|
6.55%
|
11.64%
|
|
Standard deviation (%)
|
5.76%
|
6.52%
|
8.83%
|
|
Skewness
|
-1.24
|
-1.20
|
0.36
|
|
Kurtosis
|
9.39
|
8.25
|
7.40
|
|
Maximum drawdown (%)
|
8.69%
|
10.02%
|
9.57%
|
|
Cumulative wealth
|
1.12
|
1.26
|
1.45
|
|
Sharpe ratio
|
0.54
|
1.00
|
1.31
|
36
Salma Ouali
References
Bouri, E., Molnár, P., Azzi, G., Roubaud, D., Hagfors,
L.I., 2017. On the hedge and safe haven properties of Bitcoin: Is it really
more than a diversifier? Finance Research Letters 20, 192-198.
Briere, M., Oosterlinck, K., Szafrz, A., 2015. Virtual
currency, tangible return: Portfolio diversification with bitcoin. Journal of
Asset Management, 16, 6, 365-373.
Brauneis, A., Mestel, R., 2019. Cryptocurrency-portfolios in a
mean-variance framework. Finance Research Letters 28, 259-264.
Dyhrberg, A. H., 2016. Bitcoin, gold and the dollar- A GARCH
volatility analysis. Finance Research Letters, 85-92.
Eisl, A., Gasser, S.M., Weinmayer, K., 2015. Caveat emptor:
Does bitcoin improve portfolio diversification?
Engle, E., 2000. Dynamic conditional correlation - A simple
class of multivariate GARCH models.
Guesmi, K. Samir Saadi, S., Abid, I., Ftiti, Z., 2018.
Portfolio diversification with virtual currency: Evidence from bitcoin.
International Review of Financial Analysis.
Henriques, I., Sadorsky, P., 2018. Can bitcoin replace gold in
an investment portfolio? Journal of Risk and Financial Management 11, 48.
Hong, K., 2016. Bitcoin as an alternative investment vehicle.
Springer Science+ Business Media
Kajtazi, A., Moro, A., 2017. Bitcoin, portfolio
diversification and Chinese financial markets
Klein, T., Thu, H.P., Walthe, T., 2018. Bitcoin is not the new
gold, a comparison of volatility, correlation, and portfolio performance.
Working paper.
Lee, D.K.K., Li Guo, L., Yu Wang, Y., 2017. Cryptocurrency: A
new investment opportunity? Liu, W., 2018. Portfolio diversification across
cryptocurrencies. Finance Research Letters.
Lorenz, J., Strika, M., 2017. Bitcoin and cryptocurrencies -
not for the faint-hearted. International Finance and Banking 4, 1.
Petukhina, A., Trimborn, S., Härdle, W.K., Elendner, H.,
2018. Investing with cryptocurrencies - evaluating the potential of portfolio
allocation.
Platanakis, E., Urquhart, A., 2018. Should investors include
bitcoin in their portfolios? A portfolio theory approach.
Rockafellar, R.T., Uryasev, S., 1999. Optimization of
conditional value at risk. Journal of Risk, 21-41.
37
Salma Ouali
Svärd, S., 2014. Dynamic portfolio strategy using
multivariate garch model. Working Paper
Symitsi, E., Chalvatzis, K.J., 2019. The economic value of
bitcoin: A portfolio analysis of currencies, gold, oil and stocks. Research in
International Business and Finance 48, 97-110.
Urquhart, A., Zhang, H., 2016. Bitcoin a hedge or safe-haven for
currencies? An intraday analysis.
| 

