4.3. CONSUMER ACCEPTABILITY CHECK
As discussed in chapter three, In order to know whether the
consumer needs and preferences were met or not, and to be sure that the new
flavoured dry vegetable soup could be sold on the market, the consumer
acceptability check was carried out. This was achieved by using questionnaire
(See appendix 3).
The following are the summaries of the results obtained on
each step.
4.3.3. BEFORE OPENING
Before opening, four attributes ( appearance, aroma, colour
and texture ) were assessed. The following is the table showing the mean scores
of the results obtained by each of those attributes.
|
Attributes
|
Mean Scores
|
|
Appearance
|
4.2666667
|
|
Aroma
|
4.2
|
|
Colour
|
4.2666667
|
|
Texture
|
4.2
|
Table 4.3.1.a : results of consumer acceptability check
(before opening).
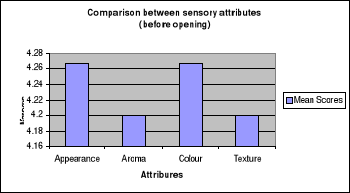
Figure 4.3.1 : graph of comparison between sensory attributes
( before opening )
As it can be observed from the above figure and table
comparing the mean scores of the attributes of the flavoured dry vegetable
soup, before opening, appearance and color were most appreciated by the
panelists over other attributes. Aroma and texture were appreciated at the same
level. However, there was in general very little and non-significant difference
in the appreciation of the attributes. This was confirmed by subjecting the
results to the analysis of the variance, and its results are summarized in the
tables below.
|
SUMMARY
|
|
|
|
|
|
|
Attributes
|
N. of panelists
|
Totals
|
Mean values
|
Variance
|
|
|
|
Appearance
|
15
|
64
|
4.26666667
|
0.35238095
|
|
|
|
Aroma
|
15
|
63
|
4.2
|
0.31428571
|
|
|
|
Colour
|
15
|
67
|
4.46666667
|
0.55238095
|
|
|
|
Texture
|
15
|
63
|
4.2
|
0.45714286
|
|
|
|
|
|
|
|
|
|
|
ANALYSIS OF VARIANCE
|
|
|
|
|
|
|
Source of variations
|
SS
|
df
|
MS
|
F
|
P-value
|
F crit
|
|
Between Groups
|
0.71666667
|
3
|
0.23888889
|
0.57007576
|
0.63703944
|
2.76943095
|
|
Within Groups
|
23.4666667
|
56
|
0.41904762
|
|
|
|
|
|
|
|
|
|
|
|
Total
|
24.1833333
|
59
|
|
|
|
|
Table 4.3.1.b : summary of results of ANOVA ( before opening
)
Since calculated F-Coefficient 0.57007576 was less than
Tabulated F-Coefficient 2.76943095, it led to the conclusion that there was
no significant difference (p = 0.05) between mean scores of the five point
hedonic scale results of the flavoured dry vegetable soup, before opening.
4.3.4. AFTER OPENING
After opening and preparing the soup, five attributes
(appearance, aroma, colour, taste and texture), as well as the overall
acceptability, were assessed. The following is the table showing the mean
scores of the results obtained by each of those attributes and that of overall
acceptability.
|
Attributes
|
Mean Scores
|
|
Appearance
|
4.5333333
|
|
Aroma
|
4.466667
|
|
Colour
|
4.6
|
|
Taste
|
4.2
|
|
Texture
|
4.33333
|
|
Ov. acceptability
|
4.2
|
Table 4.3.2.a : results of consumer acceptability check (after
opening)
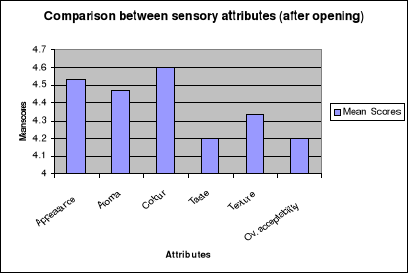
Figure 4.3.2 : graph of comparison between sensory attributes
( after opening )
From the above figure and table, it was evident that the
colour of the flavoured dry vegetable soup developed was the most appreciated
attributes, followed by appearance, aroma, texture and taste respectively. The
fact that taste was not appreciated as other sensory attributes may be due to
the fact that panelists used were not trained and specialists of sensory
evaluation or on the fact that people are not used to the special flavour
developed by mixing different flavour raising ingredients such as garlic,
celery, leek and onion together.
However, the score of overall acceptability shown that the
flavoured dry vegetable soup developed was acceptable to almost all the
panelists. This was also confirmed, by subjecting the results to the analysis
of the variance, and its results are summarized in the tables below.
|
SUMMARY
|
|
|
|
|
|
|
Attributes
|
N. of panelists
|
Totals
|
Mean values
|
Variance
|
|
|
|
Appearance
|
15
|
68
|
4.53333333
|
0.26666667
|
|
|
|
Aroma
|
15
|
67
|
4.46666667
|
0.40952381
|
|
|
|
Colour
|
15
|
69
|
4.6
|
0.25714286
|
|
|
|
Taste
|
15
|
63
|
4.2
|
0.6
|
|
|
|
Texture
|
15
|
65
|
4.33333333
|
0.66666667
|
|
|
|
Ov. acceptability
|
15
|
63
|
4.2
|
0.45714286
|
|
|
|
|
|
|
|
|
|
|
ANALYSIS OF VARIANCE
|
|
|
|
|
|
|
Source of variations
|
SS
|
df
|
MS
|
F
|
P-value
|
F crit
|
|
Between Groups
|
2.18888889
|
5
|
0.43777778
|
0.98853047
|
0.42976752
|
2.3231265
|
|
Within Groups
|
37.2
|
84
|
0.44285714
|
|
|
|
|
|
|
|
|
|
|
|
Total
|
39.3888889
|
89
|
|
|
|
|
Table 4.3.2.b : summary of results of ANOVA ( after opening
)
Since calculated F-Coefficient 0.98853047 was less than
Tabulated F-Coefficient 2.3231265, it led to the conclusion that there was no
significant difference (p = 0.05) between mean scores of the five point hedonic
scale results of the flavoured dry vegetable soup after opening. Therefore, the
hypothesis stating that « Food processing under guidance of consumer
needs, allows to achieve his satisfaction.» was verified. Hence, the
product was accepted.
4.3.5. COMPARISON OF ACCEPTABILITY BEFORE AND AFTER
OPENING
The results of consumer acceptability check obtained before
and after opening were compared so as to see whether the impression given by
the product to the consumers before opening was conserved or not. The
following table shows the summary of the comparison.
|
Attributes
|
Mean scores obtained
|
|
Before opening
|
After opening
|
|
Appearance
|
4.2666667
|
4.5333333
|
|
Aroma
|
4.2
|
4.466667
|
|
Colour
|
4.2666667
|
4.6
|
|
Taste
|
_____
|
4.2
|
|
Texture
|
4.2
|
4.33333
|
|
Ov. acceptability
|
_____
|
4.2
|
Table 4.3.3. : comparison of acceptability before and after
opening
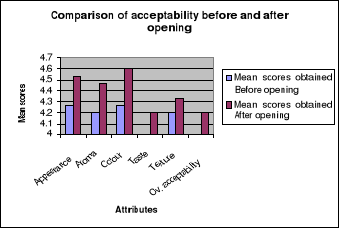
Figure 4.3.3. : graph of comparison of acceptability before
and after opening
The results showed that the impression given by the product
to the consumers before opening was reinforced after opening and consumers were
not disappointed by the product. This is certified by the fact that for all
attributes assessed both before and after opening, the mean scores obtained
after opening were high than those obtained before.
| 

