DEDICATION
To the almighty God
To our dear families
AKNOWELEDGEMENTS
This dissertation could not have finished without the support
we received from different persons and the National University of Rwanda; we
would like to express our sincere thanks to all those people.
We highly appreciate the invaluable guidance offered to us by
supervisor Ir Charles BUCAGU Msc, his constrictive instructions and suggestions
provided a basis of the completion of this work.
Warm thanks go to the authorities of the faculty of
agriculture and all lectures for their intelligent and useful advice they
rendered to me.
Our thanks go to our colleagues who have always been there
during our studies and in research processes.
We would like to thank our parents who have sacrificed their
meager income to educate us.
Thank you very much.
Alain
KALISA and Naphtal NSHIMYUMUKIZA
ABSTRACT
Farmers' resource management strategies affect strongly on
farm activities and are also basic determinant of farmers' soil fertility
status; however those strategies are also in relation with farmers' wealth
status. Causes of variability in soil fertility management at different scale
of analysis are both biophysical and socio-economic. Such heterogeneity is
categorized in this study which interest was to analyze the functioning of
different farming systems by establishing their major characteristics and
estimating the level of nutrient at farm and plots scales in Shanga cell
located in plateau central agroecological zone. For the assessment of
socio-economic factors, we used questionnaires during the survey and in order
to determine the variation from one plot to another, a soil analysis was done.
Three wealth groups were identified using socio-economic information and
considering production activities, household objectives and the main
constraints faced by farmers. Soil fertility management and nutrient resource
flows were studied for each wealth category and related to differences in soil
fertility status at farm scale. The first category is the well-off farmer who
owned more than 2 cows, 1000 or more coffee trees plus 1ha or more of land and
other resource allocation. Second category of intermediate farmer has less than
2 cows, coffee trees between 200 and 500 and less than one hectare of land.
They have normally enough food for their family and sometimes surplus for
markets. Poor farmer is the last category that has or not animal, 100 trees of
coffee and own a small farm less than 0.5 ha. Soil analysis result confirms
that there is strong soil fertility gradient across farms and between farms
selected from different wealth farmer categories in the order: (well off farmer
> intermediate> poor farmer) and within farm; closest field more fertile
than mid field and the later field more fertile than the remote fields. The
variability of nutrients in farm or in wealth categories is caused by
differences in resource allocation strategies.
TABLE OF CONTENT
DEDICATION
i
AKNOWELEDGEMENTS
ii
ABSTRACT
iii
TABLE OF CONTENT
iv
LIST OF TABLES
vi
LISTE OF FIGURES
vii
LIST OF APPENDICES
viii
ACRONYMS AND ABREVIATIONS
ix
PART I. GENERAL INTRODUCTION
1
I.1. PROBLEM STATEMENT
1
I.2. Global objective
2
I.3. Specific objectives
2
I.4. Hypothesis
2
I.5. Structure of the report
3
PART II. OVERVIEW OF MAJOR FARMING SYSTEMS IN
SUB-SAHARIAN AFRICA (SSA)
4
II.1. Definition
4
II.2. Types of farming systems found in Rwanda
4
II.2.1. cropping systems
4
II.2.1.1. Intercropping
4
II.2.1.2. Rotation
5
II.2.1.3. Monoculture
6
II.2.1.4. Fallows
6
II.2.1.5. Agroforestry (Tree Integration)
7
II.2.2. Livestock systems.
8
II.2.2.1. Traditional system
8
II.2.2.2. Improved system
8
II.2.2.3 Modern system
8
II.2.3. Mixed systems
9
II.3 ECONOMIC AND SOCIAL ASPECTS
10
II.4 AGRICULTURE EXPLOITATION IN RWANDA
12
II.4.1 Structure of the agricultural
exploitation
12
II.4.2 Typology and characteristics of
agricultural farms in Rwanda
13
II.5. NUTRIENT BALANCE PERCEPTION AND
IMPORTANCE.
14
II.5.1. Nutrient element balance as perceived
generally.
14
II.5.2. Plant nutrient balance in Sub Sahara
Africa
14
II.5.3. Availability of major elements in soil and
their importance
15
PART III. DESCRIPTION OF THE SITE AND
METHODOLOGY
16
III.1 DESCRIPTION OF THE SITE
16
III.1.1 Site location
16
III.1.2 Climatic data
17
III.2 METHODOLOGY
19
III.2.1.STUDY FRAMEWORK
19
III.2.2. Site selection and characteristics
20
III.2.3. Wealth categorization and farmer
selection
20
III.2.4. data collection
22
III.2.5. Methods and techniques
22
PART IV: ANALYSIS AND PRESENTATION OF RESULTS
24
IV.1 SURVEY RESULTS
24
IV.1.1.BACK GROUND INFORMATION
24
IV.1.1.1.Farmer wealth categories
24
IV.1.1.2.Farm types according to household head
sex
24
IV.1.1.3.Education and skills level
25
IV.1.1.4.Household size
26
IV.1.1.5.Type of group affiliation
26
IV.1.2.SOCIO-ECONOMIC ASPECT
27
IV.1.2.1.Land tenure status
27
IV.1.2.2.Total farm size
28
IV.1.2.3.Area fallowed
28
IV.1.2.4.Area under pasture
29
IV.1.2.5.Trees on farm
29
IV.1.2.6.Labour force availability
30
IV.1.2.7.Workers availability
31
IV.1.2.8.Labour sale
32
IV.1.2.9.Important food crops
33
IV.1.2.11.Livestock
35
IV.1.3. FARM MANAGEMENT ASPECTS.
37
IV.1.3.1.Use of inorganic fertilizers
37
IV.1.3.2. Use of Organic fertilizers
38
IV.2. SOIL NUTRIENT STATUS
39
IV.2.1 General Trend of Nutrient Distribution In
Different Plots
39
IV.2.2 Differences of Soil Fertility Within
Farm
40
PART V DISCUSSION
43
PART VI: CONCLUSION AND RECOMMENDATIONS
46
REFERENCES
47
Appendixes
51
LIST OF
TABLES
Table 1: Climatic data of Ngoma station
17
Table 2. Criteria used by farmers to categorize
themselves in wealth categories
21
Table 3: Households head according to sex in wealth
categories
25
Table 4: Education and skills level of farmers in
relation to wealth status
26
Table 5: Household size in different wealth
category
26
Table 6: Type of group affiliation and wealth
category
27
Table 7: Land tenure in relation to farmer wealth
status
28
Table 8: Total farm area in different wealth
categories groups.
28
Table 9: Area fallowed based on wealth groups
categories condition
29
Table 10: Grazing area in relation to wealth
status
30
Table 11: Trees on farm according wealth categories
groups.
30
Table 12: Labour force in different wealth groups
categories
31
Table 13: Permanent and temporarily Labour hired in
relation to farmer wealth status
32
Table 14: Labour sale distribution in wealth groups
categories
32
Table 15: Livestock ownerships in wealth group
categories
36
Table 16: use of Inorganic fertilizers in different
wealth groups
37
Table 17: use of Organic fertilizers in different
wealth group
38
LISTE OF FIGURES
Figure 1: Framework
19
Figure 2. Farmers in wealth categories
24
Figure 3: Most important food crops
33
Figure 4: Most important income-earning
crop/Act
34
Figure 5: Variability of soil carbon (1), available
P (2), exchangeable K (3) and total N (4) within plots of farm. Plots
no increases as plot position moves from homestead to further away
from home
39
Figure 6: Variability of total N (1), exchangeable
K (2), soil carbon (3), and Available P (4) in plots on farms in different
wealth categories in Shanga
40
LIST OF APPENDICES
Appendix 1: Rapid Survey Questionnaire:
50
Appendix 2: Soil analysis results
52
Appendix 3: Chemical analysis interpretation
53
Appendix 4: List of farmers interviewed in Shanga
cell
55
ACRONYMS AND ABREVIATIONS
C: Carbon
Ca: Calcium
Cm: Centimeter
FAO: Food and Agricultural Organization
GNP: Gross National Product
ha: Hectare
ISAR: Institut des Sciences Agronomiques du Rwanda
K: Potassium
Kg: Kilogram
m: meter
mm: millimeter
MINAGRI: Ministère de l'Agriculture et des Ressources
Animales
MINECOFIN: Ministère des Finances et de la
planification Economique
MINIPLAN: Ministère de la Planification
MININFRA: Ministère de l'Infrastructure
nm: nanometer
N: Nitrogen
P: Phosphorous
pH: Potentiel à l'Hydrogène
PPM: Partie Pour Million
SPSS: Statistical Package for Social Sciences
SSA: Sub-Saharan Africa
UK : United Kingdom
á: Alpha
%: Percentage
oC: Celsius Degree
PART I. GENERAL INTRODUCTION
I.1. PROBLEM STATEMENT
Agricultural sector is the backbone of national economy in
most of Sub-Saharian African (SSA) countries. In countries such as Rwanda,
agriculture sector contributes up to 46% of GNP (MINICOFIN, 2004). African
farmers operate in different environments, some having enough resources, others
operating in resource constrained environment. In many farming systems in the
tropics, strong gradients of decreasing soil fertility are found with
increasing distance from the homestead (Ruthernberg, 1980: Prudentcio, 1993).
Farmer manage crop and livestock production using organic and mineral nutrient
resources and the net flow of resources is not equal for the various fields
belonging to a single farm household (Smaling, 1996). Causes of variability in
soil fertility management at different scales of analysis (i.e. region,
village, farm and field) are both biophysical and socio-economic.
Variability at regional scale is determined by climate and
dominant soil types, presence of and access to factor and product markets and
historical, socio-cultural and ethnic aspect defining land use. The variability
of soil fertility between different farm types within a village is associated
within the «soilscape», such as the location along catenary (Duckers,
2002) and with differences in soil fertility management between poor and
wealthy households (Crowley and Carter, 2000). Resource availability and the
pattern of resource allocation to different activities are determined by
household «wealth», and depend on household priorities and production
strategies.
Rwanda like other SSA countries presents quite similar
features of farming system; it is one of the most populated developing
countries with a density of 500 inhabitants per km2 of the arable
areas (MINICOFIN, 2004). The majority of the Rwandan households are small
agricultural producers dealing with subsistence oriented agriculture. Poor
productivity of Rwandan agriculture is due to exhaustion of the ground, the
insufficiencies of agricultural use of inputs and of the weak development of
the markets and of infrastructures (www.rwandagateway.com, 2007). And then, the
level of organization farming systems is complex within each agro-ecological
and the analysis requires accurate information that is not always available in
the literature. A careful analysis of the functioning of farming systems and
the way different components interact between them is a key step in the design
of possible interventions for improving productivity at farm level. Beside
biophysical factors, farmer management strategies determine the kind of farming
system the farmer is interested in and the productivity he gets out of it. With
the proposed study, we intend to conduct a diagnostic study of different
farming systems existing in Shanga cell of Maraba sector as the first step
towards a detailed study of different farm types identified in the area. The
study will also try to characterize soil fertility level on representative
farms which we believe is linked with the socio-economic status of farmers.
I.2. Global objective
The global objective consists of analyzing the functioning of
different farming systems by establishing major characteristics and estimating
nutrient levels at farm and plot scales.
I.3. Specific objectives
Ø To study the effects of natural and socio-economic
factors driving the functioning of farming systems in Rwanda.
Ø To quantify the magnitude of farm soil fertility
gradients as affected by biophysical and socio-economic factors
Ø To develop a framework for categorizing heterogeneity
in soil fertility at different scales.
I.4. Hypothesis
Ø Diversity of farms and fields in smallholder farming
systems exists due to variable biophysical and socio-economical conditions.
Ø Wealth status of the farmer determines soil fertility
status of his farm and socio-economic conditions are factors affecting
nutrients level in soil of different farm's plots.
I.5. Structure of the report
This study is divided into six parts:
The first part is composed by a general introduction, followed
by a comprehensive literature review on farming systems in the second part,
then comes in the third part the description of the methodology used. The
fourth part covers the analysis and presentation of results, which is followed
by a discussion of the results in the fifth part. The project report is
concluded with a brief conclusion and some recommendations.
PART II. OVERVIEW OF MAJOR FARMING SYSTEMS IN SUB-SAHARIAN AFRICA (SSA)
II.1. Definition
Farming system is a unique and reasonably stable arrangement
of farming enterprises that the household manages according to well-defined
practices in response to the physical, biological, and socioeconomic
environments and in accordance with the household's goals, preferences, and
resources (Shaner et al., 1981). It is also defined as a complex
inter-related matrix of soils, plants, animals, implements, labor and capital,
inter-dependent farming enterprises (Dixon et al., 2001). Clearly,
farming system is a simple combination of all production activities on a farm,
the number and types of activities may be diversified. The type of farming
systems can vary from a simple system where only one or two activities are run
to the more complex systems where several enterprises are undertaken together
on the farm.
II.2. Types of farming systems found in Rwanda
Farming system is broadly divided into three subsystems:
Cropping systems, livestock systems and mixed systems referring to the
interaction between crops and livestock (Shaner et al., 1981).
II.2.1. cropping systems
Cropping systems simply means a combination of crops in the
time and space. Appropriate cropping systems that will improve plant nutrition,
increased water and nutrient use efficiency, and build-up of soil organic
matter form the bedrock of sustainable agriculture (Antoni, 2000).
II.2.1.1. Intercropping
Intercropping is the growing of two or more crops on the same
piece of land within the same years. Various forms of intercropping have been a
central feature of many tropical agricultural systems for countries. Beets
(1982) has proposed that intercropping can be divided into three general
categories: full relay and sequential intercropping depending on the extent of
physical association between the crops. Full intercropping involves complete
association between crops planted at the same time, while relay cropping
involves only partial association, in which a second crop is planted into an
already standing crop before harvested. Sequential intercropping where there is
no physical association is the extreme case where two crops are grown on the
same land in the same year but not at the same time. The main advantages of
intercropping reside in reduction of the risk of total crop failure and product
diversification. Food crops are often mixed with cash crop ensuring both
subsistence and income for farmers. Intercropping is most likely to be
practiced on small farms, in area where land is scarce, forcing the
simultaneous production of different crops on the same area of land. Relatively
better-off farmer with large farms are less reliant on intercropping, being
able to fallow and/or control production with other inputs such as water and
inorganic fertilizers (Graves et al., 2004)
II.2.1.2. Rotation
Crop rotation is the practice of growing a series of
dissimilar types of crops in the same space in sequential seasons to avoid the
buildup of pathogens and pests that often occurs when one species is
continuously cropped. Crop rotation also seeks to balance the fertility demands
of various crops to avoid excessive depletion of soil nutrients. A traditional
crop rotation system is the cropping system involving cereals rotating with
legume crops such as bean (
www.wikipedia.org/wiki
(April, 2007)).
According to Rayar (2000), the advantages of crop rotation are
manifested in the Addition of organic matter through incorporation of crop
residues and nitrogen through the inclusion of legume in the rotation but this
helps also in effective control of insects and diseases while breaking their
reproductive cycle. Rotation can also allow a better exploitation of moisture
and nutrients at different soil depth by differences in the rooting pattern of
crop, resulting in greater potential for obtaining nutrients. This system is
also an important tool in weed and soil erosion control.
In subsistence farming, it also makes sense to grow beans and
grains at the same time in different fields. In Rwanda, the commonly used
rotation is: tubers-legume-cereal, illustrating how Rwandan people know the
importance of legume in crop rotation. For example: Bean comes after sorghum
or vice versa. Through symbiotic N fixation, beans grow well on soils weakened
by sorghum export. Beans benefit of the N from mineralization of the stable
humus formed out of the incorporation of sorghum residues (Hitimana, 1989).
II.2.1.3. Monoculture
Monoculture describes the practice of planting crops with the
same patterns of growth resulting from genetic similarity. Examples include
Wheat fields or Cassava or Potatoes. These cultivars have uniform growing
requirements and habit resulting in greater yields on less land because
planting, maintenance (including pest control) and harvesting can be
standardized. This standardization results in less waste and loss from
inefficient harvesting and planting. It is also beneficial because a crop can
be tailor planted for a location that has special problems - like soil salt or
drought or a short growing season. Monoculture can lead
to large scale crop failure as this single genetic variant or cultivar becomes
susceptible to a disease. The Irish potato famine in the UK in 1846 was caused
by susceptibility to Phytophthora infestans. Each crop then had to be
replaced by a new cultivar imported from another country that had used a
different genetic variant that was not susceptible to the pathogen (Richard,
1979)
II.2.1.4. Fallows
Traditionally, fallowing was a common practice in most SSA
rural areas. Fields were cropped and then left to rest for one or two seasons
before returning to the same plot. In most cases natural fallow of natural
grasses are allowed to invade the growing fields and then burned and residues
incorporated in soil before sowing again. Benefits of short-duration fallows to
crop yields are sometimes related to the amount of biomass accumulated during
fallow. The practice has disappeared with time due to more demand of land for
producing more food. In order to cut down longer period of fallow on field,
short term fallow using shrubs and legume known to fix nitrogen in soil have
been sought after. The system is very common in agroforestry system and is
known as improved fallow practice. Thus, an accelerated fallow is where
specific fast growing leguminous trees, shrubs, legumes, and other plants are
used to improve soil fertility faster than would occur otherwise, while an
enriched fallow is where trees or shrubs of economic value are planted into the
fallow so that farmer can drive some income from them while the land is
regenerating (Garrity,1999). Improved fallows of perennials and herbaceous
cover crops can suppress weeds, particularly over a number of years and might
be an important component of integrated weed management strategies. Tree
fallows, have distinct advantages over herbaceous fallows, particularly in
seasonally dry climates; because they may take up nutrients from deep soil
layers, and accumulate a large quantity of biomass through which nutrients can
be recycled, and nitrogen fixing trees may add nitrogen to the system through
Biological Nitrogen Fixation (BNF) (Louise et al., 1998).
However, despite proved advantages of improved fallow practice
across most areas in SSA, the practice has not been widely adopted due to land
scarcity that does not allow the farmer to leave his land without producing
even for a short term. Smallholder farmer always seeks maximizing production
through strategic use of limited resources on farm. At higher population
densities, however, scarcity of land means that there is a higher opportunity
cost in putting land in fallow, and intensive continuous cultivation systems
may dominate (Drechsel et al., 1996).
Enriched fallows address this problem to some extent, in that
species that are able to provide some economic benefits, such as fruit or nuts
are planted in preference to species that only improve soil fertility (Cairns
and Garrity, 1999; Sanches, 1999). Other practical benefits to farmer may
include production of fodder, honey, firewood, or bean poles or light timber
for construction. Improved fallow practice seems to be irrelevant for Rwandan
farmers due to shortage of land and need for continuous food production for
household consumption (Nshimyumukiza and Benda, 2005).
II.2.1.5. Agroforestry (Tree Integration)
Trees are important component of Rwanda agricultural system.
In most farming systems in SSA, trees are associated with other crops. The
system operates as a dynamic, ecologically based that, through the integration
of trees in farms and in agricultural landscape, diversifies and sustains
productions for increased social, economic and environmental benefits for land
users at all levels (Louise et al., 1998). Agroforestry enhances
ecological stability; allows better management of below ground resources. Crops
grown beside trees on the same field benefit from nutrients uptaken by trees
from the sub-soil. In most cases leguminous perennials trees are used in the
systems and these are known to fix atmospheric nitrogen that can be used by
annuals. In some case, however, perennials may produce allelopathic compounds
that can suppress weeds. This is an additional advantage of the system
(National research council, 1993).
II.2.2. Livestock systems.
Traditional and modern livestock systems are found in Rwanda.
We may distinguish different types according to techniques and socio-economic.
These types are: traditional, improved and modern type.
II.2.2.1. Traditional system
Traditional livestock system is a system in which a farmer
does agriculture and keeps the cattle in the same time. Animal can be used to
produce milk and meat and also manure. Local cattle Ankole is the dominant
animal in these systems and are very well adapted to local conditions. The milk
production remains, however poor due to poor quality feed. Traditional
livestock were relying on natural pasture and in some cases cattle could make
long distance for grazing. The manure produced by cattle is the main source of
fertilizer. That system is the most predominant system and farmer does not use
concentrate feeds, resulting in poor performance of the cattle in terms of milk
and manure production (Mubashankwaya, 2005).
II.2.2.2. Improved system
In this system, the farmer has few dairy animals which produce
many quantity of milk. It is generally a system of urban and peri-urban. The
farmer cuts the grass around and transports them to the cattle and used a few
quantities of feed supplements. The production of milk is proportional to the
genetic potential of the cattle and environment conditions. It is generally
assisted or supported by a development project that supplies medical care and
provide concentrated feeds (ISAR, 1990). In most cases, animals are
artificially inseminated with the objective of improving the performance of the
following offspring (MINAGRI, 1997).
II.2.2.3 Modern system
Modern breeding is that uses improved animals which apply
appropriate techniques of feeding with strict sanitation safe. Performance
parameters of production are considered as important. Modern farmers are so few
in Rwanda because of high cost investments of materials, infrastructures, and
labor. To ensure sufficient production and cover the need of production, it is
necessary to develop that type of breeding when increasing productivity of
cattle is the objective (ISAR, 1990).
In Rwanda we have also small ruminants. Sheep and goats are
essential components of pastoralists' herds, poultry, pigs and rabbits. Their
main functions are: providing meat, manure, and in addition eggs in the case of
poultry and skins in the case of rabbits (Gichuru et al., 2004).
II.2.3. Mixed systems
Smallholder mixed farming systems in SSA (Sub-Sahara Africa)
are highly complex due to intricate interactions between the soil, crops and
livestock. Productivity of crops and livestock is among many factors limited by
poor availability of nutrient resources. Crop-livestock interactions are
mediated by the use of crop residues to feed livestock, and the reciprocal use
of manure to fertilize crops. Manure is integral source of nutrients for crops
in many smallholder farming systems where small amounts of external fertilizer
inputs are used, farmers concentrate fertilizer and labour resources on plots
closed to the homesteads. This differential management of plots creates
gradients of decreasing soil fertility with distance away from homesteads
(Zingore et al., 2006). Competition of agriculture and livestock
activities for land is very common in SSA including Rwanda. In the 1940's human
and animal populations increased dramatically, and land previously reserved for
grazing was converted into cropping lands. This led to continuous cultivation
and increased vulnerability to soil erosion; reduced pastures resulted in fewer
animals and less manure; and farmers were forced to try buying manure.
Livestock provided an important and stabilizing component of the farming system
by maintaining soil nutrients. Due to competition for land, the number of
animals per household was progressively diminishing and this led to a
degradation of soil fertility since there were no alternative sources of manure
for smallholder farmers across rural areas in the country.
www.fao.org/AG/aga/lspa/LXETML/tech/ch3b.htm
(April, 2007)
II.3 ECONOMIC AND SOCIAL ASPECTS
In tropics, almost all farms are small and subsistence is
usually more important to the farmer than cash cropping. The farm operation is
based primary on manual and animal labor. A considerable proportion of the farm
output is consumed by the family and the rest of the produce is sold or
bartered at nearby markets. This means that a tropical farmer not only measures
the «output» of his farm in monetary terms but also in such terms
«food value» and return per unit of labor (Beets, 1982)
According to Beets, (1982) to increase the productivity of the
traditional tropical farming systems, two main changes can be made:
· increasing the level of technology and use of external
input and
· Improving marketing and distribution.
The availability of external inputs varies greatly from
location to location and directly influences the character of the local farming
system. Following aspects must be meticulously taken into account:
a) Level of technology and resource
The inputs used in farming system can be divided into the
following four groups: natural resources (climate, soil, etc), human resources
(labor, entrepreneurship, etc), external inputs (fertilizers, insecticides,
etc), and financial resources (credit).
If human and financial resources are abundant and the level of
technology is high, these factors can sometimes compensate in reducing
environmental degradation resulting in yield increase. For example, the
environment can be improved by the introduction of irrigation systems, drainage
works and land leveling.
b) Managerial ability of the farmer and traditional
beliefs.
Farm management is the coordination and supervision of a farm
business for long-run maximum profit and/or other specified goals. It has four
elements: organizing, planning measuring and controlling, and activating
(Robert et al, 1991). The level of education and farmers'
understanding of the environment greatly influence the character of the local
cropping system. Traditional and certain beliefs play an important role in
farming practice in the tropics. A good example is the ownership of the cattle
in Africa regarded as a sign of wealth. Management capability is an often
overlooked resource that is closely related to labor availability. According to
Harwood (1979), the management of farm production includes all production
connected activities that cannot ordinarily be performed by common farm labor.
Management involves making decisions, performing certain technical operations
requiring exceptional skills, and supervising other farm operations when
necessary. Land use planning, planting, quality control and marketing require
close, active management. In smallholder farming systems, where wage rates for
outside labor is low, the intensive use of resources like land and water
depends on the farm family's commensurate ability to furnish management
services. In Shanga cell, we can take as example, the lack of knowledge in
using fertilizers results in low yield. Another example is some popular myths
in Rwanda where farmers believe that use of fertilizers damages soil fertility.
The reason for this belief is that, farmers may apply fertilizer one season,
resulting in more production and cultivate the following season without
fertilizer application, resulting in dramatic reduction of yield. This
observation gives them an impression that fertilizers have instead degraded
their fields.
c) Population and farm type
The effect of population pressure results in reduction of farm
size and a greater demand for food. Farmers, in turn, must increase crop
production in order to meet the increasing demand, meaning that maximum use is
made of the resources available at the farm level.
d) Farm size
Small farms are very common in the SSA; a study assessed in
Rwanda revealed that 0.75 ha is the minimum size of a farm. In order to
increase the level of mechanization, it is often desirable to increase the
field and farm size. In many cases, the redistribution of land and increasing
farm size are not possible for social and political reasons. It seems,
therefore, unavoidable that advances in crop production in the tropics will
have to be made on relatively small farms. This will only be possible if the
small areas of land are intensively utilized by multiple cropping (
www.minagri.gov.rw July 2007)
e) Demand, Prices and Farm Income
Supply and demand describe market relations between prospective
sellers and buyers of a
good.
They determine price and quantity sold in the market (
http://en.wikipedia.org/wiki/Supply_and_demand)
The availability of market has a direct influence on farm. To
be useful to the farmer, the cash market must be accessible, must give the
farmer sufficient warning of changes in demand and prices to enable him to plan
his yearly cropping pattern (Harwood, 1979). An example of the role of market
demand as an incentive to agricultural production development is illustrated by
promotion of rice cultivation by farmers of Bugarama valley following the
installation of rice processing industry. The emergence of markets for
agricultural products is accompanied by the replacement of basic food
commodities by cultures market-oriented. The economic factors or forces have
pronounced influence on the type of farming. Examples of these include the
price of land, distance to the market, transportation facilities, change in
price of farm products enterprises, labor requirement, and available supply and
cost labor. These economic forces influence the farmers' decision on whether
they will produce a certain product (Robert et al 1991).
II.4 AGRICULTURE EXPLOITATION IN RWANDA
The omnipresence of the hill considered as basic unit, the
atomization of the habitat and the dispersion of the pieces constitute some of
the fundamental features of the rural landscape. The dispersion of the pieces
constitutes a judicious response with the variety of the agro-ecological
conditions.
II.4.1 Structure of the agricultural exploitation
In order to remain coherent with the agricultural tools of the
national structure, we adopted the definition of the agricultural exploitation
proposed by the MINAGRI:
«The farm on which the household lives is a
techno-economic unit of agricultural production, including all the animals
which are there and all the ground used entirely or partly for the agricultural
production and which is subjected to a single direction of the head of
household. Basically, a traditional farm of Rwanda is composed of:
The house compound (urugo) limited by fences, where main house
and sometimes a small garden are located. It is also used as Cattle Park.
Around the enclosure, one finds the banana plantation, beans, various
vegetables and sometimes tobacco. These grounds are periodically fertilized
using the residues of kitchen or harvest and the animal manure, even human. On
the slope/hillside, the permanent crops alternate with the fallow: sometimes, a
piece is devoted to a small plantation of coffee-trees. Some exploitations have
grounds grazed permanently. In low land/ foot of the hill, a piece of that
land is cultivated in bulks where peasants produce sorghum if the ground water
is low, sweet potatoes and vegetables if it is high like in Mayaga (Jacques
Tassin, 1989).
II.4.2 Typology and
characteristics of agricultural farms in Rwanda
Typology of agricultural farms reflects how the farm is
organised and how it operates. The procedure in establishing farm typology
consists of identifying similar features for a group of farms and categorise
the group as one typology. According to a study carried out by MINAGRI on
production systems in 1991, three types of farmers with specific
characteristics and strategies were identified.
TYPE A: «the small dependent farmer» with a small
pieces of land- his homestead, which cannot produce enough food for the
family's subsistence - he has to engage in other activities (trader, hauling,
crafts etc...) or sell his labour to someone else to complement his farm
output.
TYPE B: «The self-sufficient farmer» This type has
just adequate farmland and labour to satisfy his family's food needs. Other
activities outside farming (trade, handicrafts) are an addition to his farm
output and important to the family as extra income.
TYPE C: «production system using capital» is more
heterogeneous. A first sub-group is close to type B but has more production
factors whereas the third sub-group is composed of absentee farmers
(businessmen, civil servants) who pursue land acquisition and accumulation
strategies.
However, the proportion and types of farms may differ from one
area to another depending to different reasons. For instance, major crops and
their spatial arrangement may differ from one location to another.
II.5. NUTRIENT BALANCE PERCEPTION AND IMPORTANCE.
II.5.1. Nutrient element balance as perceived generally.
The soils upon which plants depend for their food materials
developed from minerals. Plants with different nutrient requirements developed
on soil having different powers to supply nutrients. In SSA, many soils, in
their virgin state, do not furnish a balanced nutrient supply for agricultural
crops. Man, however, has not restricted his cultivation to the soils best
suited to the crops he wants to grow. Furthermore, he has continued to crop the
soil for years and has failed to return to the soil all of the nutrients
removed in the crops produced. The organic matter of the soil, one function of
which is to act as reservoir of slowly available nutrients, has also been
allowed to be depleted.
II.5.2. Plant nutrient balance in Sub Sahara Africa
Agricultural production in SSA is constrained by low soil
fertility, climatic conditions, lack
of infrastructure, and low availability and use of
agricultural inputs (particularly mineral fertilizers). In sub-humid and humid
regions, savanna and forest areas have a high variability of nutrients
losses/outputs and nutrients inputs.
For smallholder farmers cultivating small acreage in SSA,
utilization of straight fertilizers may be more economical but will also depend
on farmers' knowledge of nutrients required. Other practices such as crop
rotations including legume crops, recycling of residues and INM
(Intensification Nutrient Management) are needed to improve plant nutrition.
(Vanlauwe and Giller, 2006). Even in resource-limited smallholder agriculture
not all fields are continuously mined; some fields have very positive nutrient
balances, usually through concentration of nutrients from other parts of the
farm (Scones, 2001; Tittonell et al., 2005). This arises from the diversity of
plot management, as most organic resources and mineral fertilizers are used on
the home gardens and infields, and rarely on the outfields further away from
the homestead. The development of gradient of declining soil fertility with
distance from the homestead may not be a deliberate form of management, but
probably an inevitable consequence of the limited availability of cattle manure
and other nutrient resources. Preferential application of nutrients to the
infields and homestead gardens ensures good crop yields in these limited areas,
and save labour in terms of the distance the nutrients are transported
(Vanlauwe and Giller, 2006)
II.5.3. Availability of major elements in soil and their
importance
Small farmers use animal manure as a source of crop nutrients
which are good amendment and they contain N, P, K, Ca, Mg and micronutrients.
Nitrogen is the key nutrient for crops production. This element is the most
mobile and also most easily exhausted nutrient in the soil (Ghicuru et al.,
2004).
The effect of nitrogen to crop may be summarized as
follows:
1. it increases leaf size and therefore the potential for
greater photosynthesis, which will increase root growth, total dry matter and
yield of useful product;
2. it increases the protein content of storage organs, that is
grain, tubers, and roots:
3. it increases the proportion of water in the plant fresh
weight because of increased plant protoplasm:
4. it increases the site of plant cells and reduces the
thickness of their wall (Nyombaire,2001).
Phosphorus is the major element limiting crop production in
the tropics (Ghicuru et al., 2004). It plays a role in photosynthesis,
respiration, energy storage and several other processes in the living plant. It
promotes early root development and growth, it improves the quality of many
fruit, vegetable and grain crops. Phosphorus is also vital in seed formation
and its concentration is higher in the seed than any other part of the mature
plant (Nyombaire, 2001). Potassium is essential for plant growth unlike
nitrogen and phosphorus, potassium does not form organic compounds in the
plant. It is also essential in protein synthesis and helps the plant use water
more efficiently by promoting turgidity to maintain internal pressure in the
plant (Nyombaire, 2001).
PART III. DESCRIPTION OF THE SITE
AND METHODOLOGY
III.1 DESCRIPTION OF THE
SITE
III.1.1 Site location
The study was conducted in CENTRAL PLATEAU agroecological
zone. The altitude characterizing this zone is ranged between 1500 and 2100m,
annual rainfall between 1000 and 1600mm that increases as the altitude
increase. The optimum temperature is about 19oC with minimum of
10oC and maximum of 30oC.
This area is characterized by two major seasons: short rainy
season (September to December) and long rainy season (February to May). Mixed
cropping and rotation practices are well known practices in the area. The
important crops are cassava, sweet potato, banana, bean, sorghum. Coffee is the
main cash crop. Animals available are cattle, goats, pocks and chickens. Those
animals are source of manure but suffer lack of pasture. Predominant trees are
Eucalyptus, Grevillea, Mearnsii, Avocado, pinus, Euphorbia, Callitris, Ficus,
and Markhamia (Djimde, 1988; Niang & Styger, 1990).
III.1.2 Climatic data
Climate data for former Butare province and Simbi District are
lacking and not available at the Meteorological service. In order to have a
picture of climatic variation at the study area, we used averages of climate
data compiled over two decade (1969 to 1993). Averages calculated over more
than 20 years are acceptable and representative values for major weather
parameters such as temperature and precipitation. The following is the table
showing average climatic variables of the region at Ngoma station (Altitude of
1760m, Latitude of 020 36', Longitude of 0290 44').
Table 1: Climatic
data of Ngoma station
|
Temperature (0C)
|
Rainfall (mm)
|
Sunshine (hours)
|
|
January
|
19.51091
|
114.964
|
192.433
|
|
February
|
19.68526
|
108.48
|
154.72
|
|
March
|
19.74687
|
138.476
|
174.3
|
|
April
|
19.43913
|
215.06
|
162.925
|
|
May
|
19.40409
|
125.972
|
167.96
|
|
June
|
19.31527
|
29.625
|
210.033
|
|
July
|
19.49118
|
7.20
|
258.2
|
|
August
|
20.42514
|
33.8
|
234.95
|
|
September
|
20.23218
|
81.07917
|
189.4
|
|
October
|
19.77827
|
121.9583
|
170.425
|
|
November
|
19.09923
|
146.333
|
165.54
|
|
December
|
19.20459
|
113.9833
|
163.6
|
Source: MININFRA 2007
The temperature varies from 19oC to 20oC
that is in the range of temperature recorded within Central Plateau
agro-ecological zone while precipitations levels varies with the major four
seasons mentioned above, maximum values recorded around April and minimum
values recorded around July in the middle of dry season. Soil types are sandy
(known as Urusenyi in local language) in valley and red lateritic (known as
Inombe as local language) in upland (ISAR, 1991)
Administrative map of Huye District
STUDY AREA
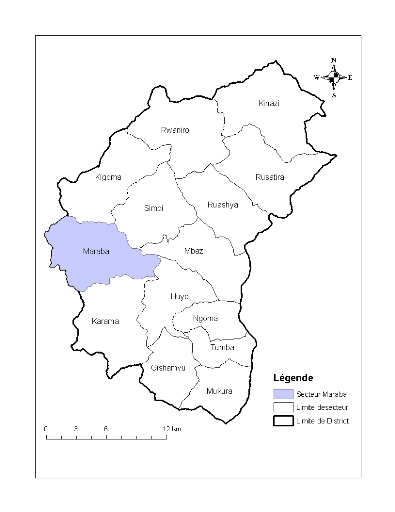
Figure 1. Huye district map and study
area, Maraba sector
III.2 METHODOLOGY
III.2.1.STUDY FRAMEWORK
AGROECOLOGICAL ZONE
Bio-physical
DISTRICT
Bio-physical
VILLAGE
Socio-economic
Poor farmer
Well-off farmer
Middle farmer
Soil fertility factors
Plot 2
Plot 1
Plot 3
Plot 2
Plot 1
Plot 3
Plot 1
Plot 2
Figure 1:
Framework
III.2.2. Site selection and characteristics
Shanga location known as a coffee production site with sandy
soil was selected as a representative site for our study. It is located at 1780
m of altitude, with latitude of 020 32'502'' South and
029o 37' 955'' East. In Shanga, the major food crops grown by the
smallholders are beans (Phaseolus Vulgaris), sweet potatoes
(Ipomea batata.), sorghum (sorghum ssp) and cassava (Manihot
escuenta). In marshland, sweet potatoes and tomatoes are grown especially
in dry season while beans, cassava, sweet potatoes and sorghum are planted on
the hills. The most earning crops are tomatoes, and cassava sold generally to
local market. Main cash crop is coffee. The dominant soil type is clay downhill
and sandy soil uphill. Most domestic animal reared in Shanga are generally
local cows, goats, pigs, and chickens. Cropping system found is mixed cropping
where crops , livestock and trees interact on the farm. Trees found are
grevillea providing timber, mulching and bean stakes, avocado papaya, orange
and citrus providing fruits. Number of trees on farm depends on the type of
farm. Pennisetum grass is also found in most of fields. Majority of
farmers use organic matter from animal mixed with crop residues and few use
inorganic fertilizers.
III.2.3. Wealth categorization and farmer selection
The process of categorizing farmers was done in different
steps. Firstly, a community meeting with local farmers was held to get an
overview of all socio-economic situation of the area. Then farmers were asked
to self-categorize into wealth groups according to their socio-economic status.
Wealth classes were established based on farmer criteria (number of animal and
type of animal ownership, type of house, type of farm size...). Farmers'
criteria of wealth are mainly the number of cattle. Hence three wealth groups
were found: Well-off, Middle, and Poor as synthesize in the following table
Table 2. Criteria used by
farmers to categorize themselves in wealth categories
|
category
criteria
|
RICH
(umukungu)
|
MIDDLE
(uwifashije)
|
POOR
(umukene)
|
|
LIVESTOCK
|
2 cattle or more
|
1 cattle or 3goats/sheep
|
1 livestock or none
|
|
LANDSIZE
|
1 ha or more
|
Between 0.5 ha and 1 ha
|
Small or none
|
|
TREES OF COFFEE
|
1000 or more
|
Between200 and 500
|
100 or none
|
|
STATE OF HOUSE
|
Modern cemented house & roof in iron
|
Modern house in Clay walls
|
Classic house in clay roofed with grasses
|
|
LABOUR
|
Hire labour
|
Can hire labour sometimes
|
Sell labour for cash income
|
|
PRODUCTION
|
Produces enough and sale surplus
|
Produces enough for his family
|
Produces not enough for his family
|
The total number of farmers interviewed was 84.All farmers
present in the meeting were self-categorized into three different wealth
groups. Rich farmers represented about 13.8% of the community, 33.8%
representing moderate farmers and 52.3% representing poor farmers. The total
number of households in Shanga cell was 1179. We proceed with determination of
representative sample using appropriate mathematical formula.
Number of households: 1179 with á: 10 %
n=no/(1+no/N)
no=(Zá/2)2*(1/2)2/d2
Z(á/2, N-1)=1.64
no=(1.64)2*0.25/(0.1)2=67.24
n = 67.24/ (1 + 67.24/1179) = 64
with
· n: size of sample
· N: size of households (1179)
· no: size of sample for the population
Based on these proportions, a sample of 65 farmers was
selected among the community on which a survey was conducted. Therefore, we
randomly selected 9 well off farmers, 22 middle farmers and 34 in the third
group.
III.2.4. data collection
In order to have fair or accurate information and to be able
to verify our hypotheses the following methods and techniques were used.
III.2.5. Methods and techniques
Descriptive method: This method helped us to
characterize the production systems. For this we made recourse
to the documentary technique. We consulted the documents available related with
our study and compile an extensive literature review. The technique of direct
observation was also used when farmers could not answer
correctly certain questions like those concerning the acreage (cultivated
area), farm size, the application of some cultural practices, etc. We went on
ground to observe in order to collect reliable information about our study.
Survey method: A
structured questionnaire was used to collect the
essential information from farmers on their farms.
Technique of soils sampling: Topsoil (20cm)
samples were taken directly with an auger at five points per plots according
field variability from all the production units (closest, middle, remote
field) identified in the farms visited after farmer interview, A composite
sample of approximately 0.75kg from each field was taken to the laboratory for
soils analyses. Soils samples were air dried, sieved through 2mm and 0.5mm and
then stored at room temperature.
The soils analyses method: The major chemical
elements, namely N P K as well as organic carbon and pH were analyzed:
v Organic carbon was determined using the
method of Schlichting, Blume (1966), consisting of humid oxidation of organic
matter. The combustion is done by K2Cr2O7 in
the presence of H2SO4 concentrated and the carbon rate is
measured by reading on spectrophotometer of 60 nm length (Baize, 2000).
v Total nitrogen was determined by the method
of Kjedhal which encompasses mineralization of organic nitrogen by
H2SO4 concentrated, distillation and titration of
ammoniac by H2SO4 N/70 (Baize, 2000).
v Exchangeable Potassium was extracted by
NH4AC at soil pH of 7. Its content in solution was determined on
spectrophotometer of atomic absorption (Juo, 1978).
v Available phosphorous was determined by
Bray 1 method consisting of extraction of phosphates by ammonium ions (Baize,
2000)
Results analysis and interpretation: results
were analyzed using excel to check eventual errors and SPSS for further
analysis that allowed us to get coherent answers. Tables and pie charts were
used to represent average values of different wealth groups; Data at plot level
were also presented to indicate variability of soil fertility within farm. The
statistical means between field types for nutrient status in the soils was
assessed using Excel to compare soil fertility of different farms and different
fields within farm.
PART IV: ANALYSIS AND PRESENTATION OF RESULTS
This chapter concerns the presentation of results on survey
conducted in Huye district, Sector Maraba, Cell Shanga and on soil analysis.
The results are shown in the tables and figures:
IV.1 SURVEY RESULTS
IV.1.1.BACK GROUND INFORMATION
IV.1.1.1.Farmer wealth categories
The 65 surveyed farmers in Shanga cell are categorized in
their different wealth groups as presented in the pie chart below. Well off
farmers represent 13.8%, middle farmers 33.8% and poor farmers 52.3%.
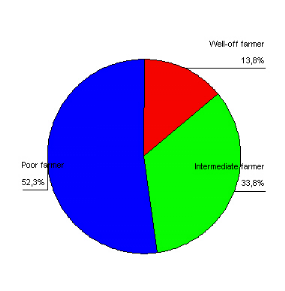
Figure 2. Farmers in wealth categories
The high number of poor farmers compared to other groups is
due to many constraints that they face, such as limited resource availability,
ignorance, etc.
IV.1.1.2.Farm types according to household head sex
Based on the results, the table below shows that male headed
household represents 69.2 % of all surveyed households. In all wealth groups,
male headed families are majority (88, 9 % in well off farmers, 68, 2 % in
middle farmers, 69, 7% in poor farmers category).
Table 3: Households head
according to sex in wealth categories
|
Household head: M/F
Wealth category
|
|
|
Total
|
|
Male
|
Female
|
|
Well-off farmer
Intermediate farmer
Poor farmer
|
8
88,9%
15
68,2%
22
64,7%
|
1
11,1%
7
31,8%
12
35,3%
|
9
100,0%
22
100,0%
34
100,0%
|
|
Total
|
45
69,2%
|
20
30,8%
|
65
100,0%
|
The reason for low number of female headed families is that a
well-off female household, once she lost her husband or divorce can easily find
another husband and the later becomes automatically responsible of the
family.
IV.1.1.3.Education and skills level
The table 4 shows globally that the majority of surveyed
farmers (61.6%) have no primary education level, 29.2% have no formal
education, 26.2% have not completed primary school while 6.2 % have acquired
other skills though they have not completed primary school. Only 38.4% appear
to have completed primary in general, and if we try to look in the respective
wealth groups, we have 55.5 % of the well-off farmer, 40.9 % of the
intermediate group, and 32.3 % of the poor farmers have completed their primary
school.
|
Education literacy
Wealth category
|
No formal education
|
Has not completed primary school
|
Has completed primary school
|
Has completed primary school and acquired other skills
|
has not completed primary school but acquired other skills
|
Total
|
|
Well-off farmer
|
1
|
2
|
3
|
2
|
1
|
9
|
|
|
11,1%
|
22,2%
|
33,3%
|
22,2%
|
11,1%
|
100,0%
|
|
Intermediate farmer
|
5
|
7
|
6
|
3
|
1
|
22
|
|
|
22,7%
|
31,8%
|
27,3%
|
13,6%
|
4,5%
|
100,0%
|
|
Poor farmer
|
13
|
8
|
10
|
1
|
2
|
34
|
|
|
38,2%
|
23,5%
|
29,4%
|
2,9%
|
5,9%
|
100,0%
|
|
Total
|
19
|
17
|
19
|
6
|
4
|
65
|
|
29,2%
|
26,2%
|
29,2%
|
9,2%
|
6,2%
|
100,0%
|
Table 4: Education and skills
level of farmers in relation to wealth status
From these results, one can conclude that there is a positive
correlation between education level and resource endowment, which means that a
farmers level of education and training influence greatly his resource
allocation.
IV.1.1.4.Household size
The table below shows that most families (44.65%) are composed
of 5 to 7 people, 33.8% having on average 2 to 4 people per family and only
21.5% of families having more than 7 family members.
Table 5: Household size in
different wealth category
|
Household size
Wealth category
|
2 to 4 people
|
5 to 7 people
|
> 7 people
|
Total
|
|
Well-off farmer
|
0
|
5
|
4
|
9
|
|
|
,0%
|
55,6%
|
44,4%
|
100,0%
|
|
|
Intermediate farmer
|
6
|
10
|
6
|
22
|
|
|
27,3%
|
45,5%
|
27,3%
|
100,0%
|
|
|
Poor farmer
|
16
|
14
|
4
|
34
|
|
|
47,1%
|
41,2%
|
11,8%
|
100,0%
|
|
Total
|
22
|
29
|
14
|
65
|
|
33,8%
|
44,6%
|
21,5%
|
100,0%
|
Large family size in well-off households can be explained by
cultural factors that characterize Rwandan society where families with
resources have social responsibility to take care of other family members in
need. There seems to be a direct correlation between resource availability and
family size.
IV.1.1.5.Type of group affiliation
As shown in table 6, majority of farmers (73.9%) are members
of organizations or groups while only 26.2 % of farmers are not affiliated to
any group and are composed mostly by poor farmers. Interestingly, 100% of
well-off farmers are at least member of a given organization/group.
Table 6: Type of group
affiliation and wealth category
|
Group affiliation
Wealth category
|
|
|
|
|
Total
|
|
Affiliated to religious group
|
Affiliated to farmers'organisation or others
|
Affiliated to both groups
|
Not affiliated
|
|
Well-off farmer
|
0
|
5
|
4
|
0
|
9
|
|
|
,0%
|
55,6%
|
44,4%
|
,0%
|
100,0%
|
|
Intermediate farmer
|
2
|
15
|
3
|
2
|
22
|
|
|
9,1%
|
68,2%
|
13,6%
|
9,1%
|
100,0%
|
|
Poor farmer
|
2
|
11
|
6
|
15
|
34
|
|
|
5,9%
|
32,4%
|
17,6%
|
44,1%
|
100,0%
|
|
Total
|
4
|
31
|
13
|
17
|
65
|
|
6,2%
|
47,7%
|
20,0%
|
26,2%
|
100,0%
|
Most of farmer organizations are forums where farmers can
access useful information and share experience. This means that well-off
farmers are very well positioned to benefit training and other facilities
offered by associations.
IV.1.2.SOCIO-ECONOMIC ASPECT
IV.1.2.1.Land tenure status
The results presented in table 7 reveal that moat farmers
(86.2%) have acquired land through in heritage while 3.1% have bought their
land. 10.8% of surveyed farmers bought part of their land and inherited the
other part of the land. The results also show that only 11% of well off farmers
and 13.6% of intermediate farmers declared to have bought some land. These are
farmers with relatively resources who can buy land and invest in coffee
production, lucrative activity in the area.
Table 7: Land tenure in
relation to farmer wealth status
|
Land tenure
Wealth category
|
Inherited
|
|
|
Total
|
|
Bought
|
Part inherited, rest bought
|
|
Well-off farmer
|
8
|
0
|
1
|
9
|
|
88,9%
|
,0%
|
11,1%
|
100,0%
|
|
Intermediate farmer
|
17
|
2
|
3
|
22
|
|
|
77,3%
|
9,1%
|
13,6%
|
100,0%
|
|
Poor farmer
|
31
|
0
|
3
|
34
|
|
|
91,2%
|
,0%
|
8,8%
|
100,0%
|
|
Total
|
56
|
2
|
7
|
65
|
|
86,2%
|
3,1%
|
10,8%
|
100,0%
|
It is however important to notice that some information
provided should be taken with caution since farmers may refrain to reveal all
the land resource he owns. In this coffee growing area, wealthy farmers tend to
buy more land for extending coffee production. So we should expect this
category to have bought more land compared to poor farmers.
IV.1.2.2.Total farm size
According to the table 8, results revealed that the majority
of farmers interviewed (56.9%) have land of size ranging from 0.10 to 0.30 ha.
Most of wealthy farmers (77%) own land of size varying from 0.30 to 3 ha
whereas land surface of most of poor farmers (70%) ranged between 0.10 to 0.3
ha.
Table 8: Total farm area in different wealth
categories groups.
|
Total area
Wealth category
|
0.03 to 0.10
|
0.101 to 0.30
|
0.301 to 0.60
|
0.601 to 1 ha
|
1.001 to 3 ha
|
Total
|
|
Well-off farmer
|
0
|
2
|
3
|
1
|
3
|
9
|
|
|
,0%
|
22,2%
|
33,3%
|
11,1%
|
33,3%
|
100,0%
|
|
Intermediate farmer
|
4
|
11
|
5
|
1
|
1
|
22
|
|
|
18,2%
|
50,0%
|
22,7%
|
4,5%
|
4,5%
|
100,0%
|
|
Poor farmer
|
8
|
24
|
2
|
0
|
0
|
34
|
|
|
23,5%
|
70,6%
|
5,9%
|
,0%
|
,0%
|
100,0%
|
|
Total
|
12
|
37
|
10
|
2
|
4
|
65
|
|
18,5%
|
56,9%
|
15,4%
|
3,1%
|
6,2%
|
100,0%
|
The table shows again that farm size is an indicator of wealth
in the area. However, the rule does not exclude cases of poor farmers who have
inherited large land from grand fathers and that may wrongly be classified as
wealth farmers.
IV.1.2.3.Area fallowed
Fields under fallow are almost inexistent in Shanga cell,
because 92.3% of all farmers have no area under fallow (Table 9). From our
findings, no single farmer was able to fallow more than 0.10 ha of land,
showing that land is being fully cultivated over time. The tendency is that as
the resources become scarce, the fallowed area becomes smaller, where 22.2% of
the well-off, 9.1% of middle farmers and 2.9% of poor farmers confirmed to have
area under fallow.
Table 9: Area
fallowed based on wealth groups categories condition
|
Area fallowed
Wealth category
|
No fallow
|
0.01 to 0.10 ha under fallow
|
Total
|
|
Well-off farmer
|
7
|
2
|
9
|
|
|
77,8%
|
22,2%
|
100,0%
|
|
Intermediate farmer
|
20
|
2
|
22
|
|
|
90,9%
|
9,1%
|
100,0%
|
|
Poor farmer
|
33
|
1
|
34
|
|
|
97,1%
|
2,9%
|
100,0%
|
|
Total
|
60
|
5
|
65
|
|
92,3%
|
7,7%
|
100,0%
|
IV.1.2.4.Area under pasture
As it is exhibited in the table below, 87.7% of farmers
studied appear to not have area under pasture. The situation is particularly
seen in all wealth groups where 91.2% of the poor farmers, 86.4% of
intermediate and 77.8% of the well-off farmers declared having no pasture land.
Table 10: Grazing area in relation to wealth
status
|
Area under pasture
Wealth category
|
No pasture land
|
Grazing area exists
|
Total
|
|
Well-off farmer
|
7
|
2
|
9
|
|
|
77,8%
|
22,2%
|
100,0%
|
|
Intermediate farmer
|
19
|
3
|
22
|
|
|
86,4%
|
13,6%
|
100,0%
|
|
Poor farmer
|
31
|
3
|
34
|
|
|
91,2%
|
8,8%
|
100,0%
|
|
Total
|
57
|
8
|
65
|
|
87,7%
|
12,3%
|
100,0%
|
Well-off farmers have big grazing area because they own
cattle. Grazing area that exists on poor farms is for small ruminants (goats,
sheep etc...). Also the small browsing area owned by poor farmers can serve to
feed a cow donated or borrowed from a neighbor. This is something common in
rural area of Rwanda.
IV.1.2.5.Trees on farm
The results of the table 11 reveal that the majority of
surveyed farmers (90.8%) have trees on farm and particularly fruit trees on
farm and 32,3% of surveyed farmers own trees on fences. Interest is to notice
that 100% of the well-off farmers have trees on their farms, meaning that they
may better understand the importance of trees on farm or may need them for
several purposes.
Table 11: Trees on farm
according wealth categories groups.
|
Trees on farm
Wealth category
|
Calliandra and/or grevillea, and grasses on contour
|
Fruit trees on farm
|
AF and fruit trees on farm
|
Fruit trees on farm and Trees on fences
|
No tree on farm
|
Total
|
|
Well-off farmer
|
2
|
2
|
3
|
2
|
0
|
9
|
|
|
22,2%
|
22,2%
|
33,3%
|
22,2%
|
,0%
|
100,0%
|
|
Intermediate farmer
|
7
|
6
|
4
|
4
|
1
|
22
|
|
|
31,8%
|
27,3%
|
18,2%
|
18,2%
|
4,5%
|
100,0%
|
|
Poor farmer
|
2
|
7
|
5
|
15
|
5
|
34
|
|
|
5,9%
|
20,6%
|
14,7%
|
44,1%
|
14,7%
|
100,0%
|
|
Total
|
11
|
15
|
12
|
21
|
6
|
65
|
|
16,9%
|
23,1%
|
18,5%
|
32,3%
|
9,2%
|
100,0%
|
In this coffee growing area, mulching is very important
practice requiring a lot of organic material across the year and most farmers
use biomass of Eucalyptus and grevillea; this may partly explain greater
percentage of farmers having these species on their farms.
IV.1.2.6.Labour force
availability
As shown in the table 12, 63.1% of surveyed households have
labour force composed of 1 to 3 people. The figure is not similar within wealth
groups since well-off farmers (88.9%) seem to have more family force labour
than other farmer groups.
Table 12: Labour force in
different wealth groups categories
|
Labour force
Wealth category
|
1 to 3 people
|
4 to 7 people
|
> 7 people
|
Total
|
|
Well-off farmer
|
1
|
6
|
2
|
9
|
|
|
11,1%
|
66,7%
|
22,2%
|
100,0%
|
|
Intermediate farmer
|
13
|
8
|
1
|
22
|
|
|
59,1%
|
36,4%
|
4,5%
|
100,0%
|
|
Poor farmer
|
27
|
5
|
2
|
34
|
|
|
79,4%
|
14,7%
|
5,9%
|
100,0%
|
|
|
|
|
|
|
|
Total
|
41
|
19
|
5
|
65
|
|
63,1%
|
29,2%
|
7,7%
|
100,0%
|
Large size of family members present in well off families may
explain the reason for more labour available in these families.
IV.1.2.7.Workers
availability
The results in table 13 indicate that 93.8 % do not hire any
permanent workers and 6.2 % of interviewed people hire 1 to 2 permanent
workers. However percentage of farmers hiring casual workers within wealth
groups varies from one group to another. While 22.2% of well-off farmers can
afford employing 1 to 2 permanent workers, only 9.1% of
intermediate farmers can do it and no single poor family can
recruit any permanent worker due to low income. In addition 70.8% of all
surveyed farmers do not hire temporally workers but 100% of well off farmer
hire between 1 to 2 workers or more.
Comparing the results of the table 13, it is clear that well
off farmers prefer recruiting more temporarily workers than permanent workers
due to the fact that the former are cheaper and are hired for only specific
tasks (sowing, first and, second tillage) that require extra physical energy.
Table 13: Permanent and
temporarily Labour hired in relation to farmer wealth status
|
Hired permanent and temporary
workers
Wealth categories
|
No labour hired
|
1 to 2 workers or more
|
Total
|
|
|
|
Well-off farmer
|
7
|
2
|
9
|
|
77,8%
|
22,2%
|
100%
|
|
Intermediate farmer
|
20
|
2
|
22
|
|
90,9%
|
9,10%
|
100%
|
|
Poor farmer
|
34
|
0
|
34
|
|
100%
|
0,0%
|
100%
|
|
Total
|
61
|
4
|
65
|
|
93,8%
|
6,2%
|
100,0%
|
|
temporary workers
|
|
|
|
|
Well-off farmer
|
0
|
9
|
9
|
|
0,0%
|
100,0%
|
100,0%
|
|
Intermediate farmer
|
15
|
7
|
22
|
|
68,20%
|
31,8%
|
100,0%
|
|
Poor farmer
|
31
|
3
|
34
|
|
91,20%
|
8,80%
|
100,0%
|
|
Total
|
46
|
19
|
65
|
|
70,8%
|
29,20%
|
100,0%
|
IV.1.2.8.Labour sale
Table 14: Labour sale
distribution in wealth groups categories
|
Labour sale
Wealth category
|
|
|
|
Total
|
|
Yes
|
No
|
Occasionally
|
|
Well-off farmer
|
0
|
9
|
0
|
9
|
|
|
,0%
|
100,0%
|
,0%
|
100,0%
|
|
Intermediate farmer
|
4
|
16
|
2
|
22
|
|
|
18,2%
|
72,7%
|
9,1%
|
100,0%
|
|
Poor farmer
|
13
|
18
|
3
|
34
|
|
|
38,2%
|
52,9%
|
8,8%
|
100,0%
|
|
Total
|
17
|
43
|
5
|
65
|
|
26,2%
|
66,2%
|
7,7%
|
100,0%
|
The results shown in the table below indicate that few farmers
(26%) sell labour and most of them preferring working permanently on their
farms. As selling labour is one of the income generating activity, a good
number of poor farmers (46 %) do sell labour. We expected this number to be
larger, but it is not the case probably due to the fact that the group is
mostly composed of old widowers and other vulnerable persons.
IV.1.2.9.Important food
crops
The general observation of data presented below indicates that
80% of the surveyed population ranked beans and sweet potatoes as their most
important food crop, these are traditional food crops that contribute to food
security of rural families in Rwanda, followed by bean alone (9.2%) at the
second position. Sweet potatoes, rice, and Irish potato are not favored as
food crop by the wealthy group; however, they can be cultivated for market
destination.
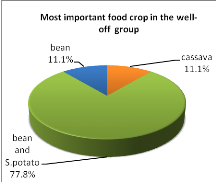
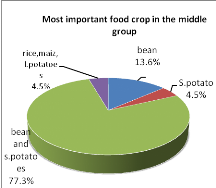
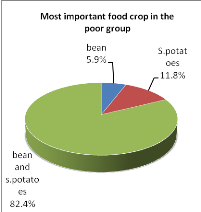
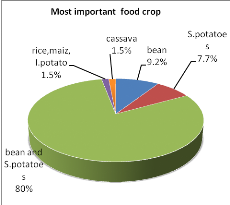
Figure 3: Most important food
crop
IV.1.2.10.Important cash
crops
In general, the majority of the surveyed farmers in Shanga
cell (46.2%) declared coffee as their most important income-earning crop
followed by vegetables (24.6%). In total 88.9% of wealthy farmers, 63.6% of the
intermediate and 23.5% of the poor farmers interviewed grow coffee and get
money out of it.
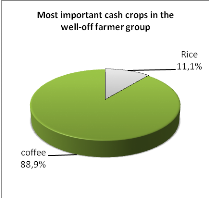
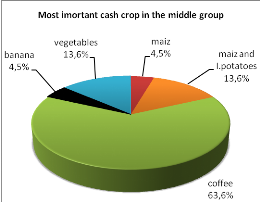
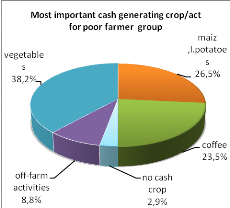
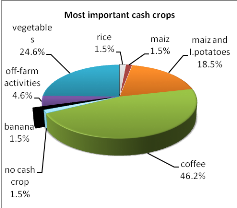
Figure 4: Most important
income-earning crop/Act
It is interesting to notice that poor farmers prefer diversify
cash crops on farmer because of constraint of land shortage and the desire of
attaining food self sufficiency.
IV.1.2.11.Livestock
From the results compiled in the table 15, 60% of farmers do
not own a cow. However 88.9% of wealthy farmers have more than 3 cows meaning
that these farmers can easily access farmyard manure needed for farming. In
addition they can produce milk as an extra benefit. Majority of intermediate
farmers (63.6%) own between 1 and 2 cattle while few poor farmers own a cow.
Referring to the criteria of farmer categorization, poor farmers should not
possess cattle. However in some cases we found farmers, especially poor farmers
keeping cattle for other farmers for the objective of accessing manure needed
for producing enough food. This phenomenon is locally known as
«Kuragiza». More than half of the surveyed farmers (53.8%) possess
goats in different proportions, but no one in the third class (poor farmers)
possess more than 4 goats, meaning that they can get limited quantity of manure
for allocation on the entire fields. 93.8% of the surveyed farmers do not
possess sheep. As for the small animals, 60% of the well-off farmers possess 1
to more than 4 chickens in their farms. Majority of intermediate and poor
farmers may possess at least 1 chicken. The reason for keeping small animals is
due to the fact that raising them does not require more resource and attention.
Chicken are also source of income since they can provide eggs. Also the table
shows that although half of the surveyed farmers (56,9%) does not possess pigs
but at least one farmer from each group possess 3 to 4 pigs. Pigs are easy to
raise and less demanding in terms of food requirements.
|
cattle
|
Number of livestock
|
Total
|
|
None
|
1 to 2
|
3 to 4
|
More than 4
|
|
|
Wealth category
|
|
Well-off farmer
|
1
|
0
|
7
|
1
|
9
|
|
|
|
11,1%
|
,0%
|
77,8%
|
11,1%
|
100,0%
|
|
|
Intermediate farmer
|
7
|
14
|
1
|
0
|
22
|
|
|
|
31,8%
|
63,6%
|
4,5%
|
,0%
|
100,0%
|
|
|
Poor farmer
|
31
|
3
|
0
|
0
|
34
|
|
|
|
91,2%
|
8,8%
|
,0%
|
,0%
|
100,0%
|
|
Total
|
39
|
17
|
8
|
1
|
65
|
|
60,0%
|
26,2%
|
12,3%
|
1,5%
|
100,0%
|
|
goats
|
|
Wealth category
|
|
Well-off farmer
|
4
|
1
|
1
|
3
|
9
|
|
|
|
44,4%
|
11,1%
|
11,1%
|
33,3%
|
100,0%
|
|
|
Intermediate farmer
|
8
|
5
|
4
|
5
|
22
|
|
|
|
36,4%
|
22,7%
|
18,2%
|
22,7%
|
100,0%
|
|
|
Poor farmer
|
18
|
10
|
6
|
0
|
34
|
|
|
|
52,9%
|
29,4%
|
17,6%
|
,0%
|
100,0%
|
|
Total
|
30
|
16
|
11
|
8
|
65
|
|
46,2%
|
24,6%
|
16,9%
|
12,3%
|
100,0%
|
|
sheep
|
|
Wealth category
|
|
Well-off farmer
|
7
|
0
|
1
|
1
|
9
|
|
|
|
77,8%
|
,0%
|
11,1%
|
11,1%
|
100,0%
|
|
|
Intermediate farmer
|
20
|
1
|
1
|
0
|
22
|
|
|
|
90,9%
|
4,5%
|
4,5%
|
,0%
|
100,0%
|
|
|
Poor farmer
|
34
|
0
|
0
|
0
|
34
|
|
|
|
100,0%
|
,0%
|
,0%
|
,0%
|
100,0%
|
|
Total
|
61
|
1
|
2
|
1
|
65
|
|
93,8%
|
1,5%
|
3,1%
|
1,5%
|
100,0%
|
|
chickens
|
|
Wealth category
|
|
Well-off farmer
|
3
|
1
|
1
|
4
|
9
|
|
|
|
33,3%
|
11,1%
|
11,1%
|
44,4%
|
100,0%
|
|
|
Intermediate farmer
|
17
|
3
|
1
|
1
|
22
|
|
|
|
77,3%
|
13,6%
|
4,5%
|
4,5%
|
100,0%
|
|
|
Poor farmer
|
30
|
3
|
0
|
1
|
34
|
|
|
|
88,2%
|
8,8%
|
,0%
|
2,9%
|
100,0%
|
|
Total
|
50
|
7
|
2
|
6
|
65
|
|
76,9%
|
10,8%
|
3,1%
|
9,2%
|
100,0%
|
|
Pigs/Others (rabbit....)
|
Table 15: Livestock
ownerships in wealth group categories
|
Wealth category
|
|
Well-off farmer
|
4
|
4
|
1
|
0
|
9
|
|
|
|
44,4%
|
44,4%
|
11,1%
|
0.0%
|
100,0%
|
|
|
Intermediate farmer
|
10
|
11
|
1
|
0
|
22
|
|
|
|
45,5%
|
50,0%
|
4,5%
|
0.0%
|
100,0%
|
|
|
Poor farmer
|
23
|
9
|
2
|
0
|
34
|
|
|
|
67,6%
|
26,5%
|
5,9%
|
0.0%
|
100,0%
|
|
Total
|
37
|
24
|
4
|
0
|
65
|
|
56,9%
|
36,9%
|
6,2%
|
0.0%
|
100,0%
|
IV.1.3. FARM MANAGEMENT ASPECTS.
IV.1.3.1.Use of inorganic fertilizers
The results show that 100% of the well-off farmers, 68.2% of
the intermediate farmers and 79.4% of poor farmers use inorganic fertilizers.
As for the destination of this fertilizer, it is interesting to notice that
55.6% of the well-off farmers apply the fertilizer in cash crops while other
groups seem to distribute it between cash and food crops, showing that resource
constrained farmers prefer to invest both in food and cash crops.
Table 16: use of
Inorganic fertilizers in different wealth groups
|
Inorganic fertilizers
Wealth category
|
|
|
|
None
|
Total
|
|
Staple crops
|
Staple and cash crops
|
cash crops
|
|
Well-off farmer
|
1
|
3
|
5
|
0
|
9
|
|
|
11,1%
|
33,3%
|
55,6%
|
,0%
|
100,0%
|
|
Intermediate farmer
|
3
|
8
|
4
|
7
|
22
|
|
|
13,6%
|
36,4%
|
18,2%
|
31,8%
|
100,0%
|
|
Poor farmer
|
11
|
7
|
9
|
7
|
34
|
|
|
32,4%
|
20,6%
|
26,5%
|
20,6%
|
100,0%
|
|
Total
|
15
|
18
|
18
|
14
|
65
|
|
23,1%
|
27,7%
|
27,7%
|
21,5%
|
100,0%
|
Large percentage of farmers using
mineral fertilizers may be explained by extensive cultivation of coffee in the
area that requires use of inorganic fertilizers. Fertilizers are being
distributed by a local coffee farmers association that allows even poor farmers
accessing the expensive input as under a refundable loan scheme.
IV.1.3.2. Use of Organic
fertilizers
Table 17: use of
Organic fertilizers in different wealth group
|
Organic fertilizers
Wealth category
|
|
|
Total
|
|
Staple crops
|
Staple and cash crops
|
|
Well-off farmer
|
1
|
8
|
9
|
|
|
11,1%
|
88,9%
|
100,0%
|
|
Intermediate farmer
|
12
|
10
|
22
|
|
|
54,5%
|
45,5%
|
100,0%
|
|
Poor farmer
|
20
|
14
|
34
|
|
|
58,8%
|
41,2%
|
100,0%
|
|
Total
|
33
|
32
|
65
|
|
50,8%
|
49,2%
|
100,0%
|
In general, results show how farmers apply fertilizers in both
staple and cash crops in almost same proportions. However 88.9 % of the
well-off farmers use it in cash and food crop since they have it in sufficient
quantity while relatively great numbers of intermediate and poor farmers
allocate it in cash crops because of limited quantity of inorganic fertilizers
that is not enough for improving production.
IV.2. SOIL NUTRIENT STATUS
The soil nutrient status are presented to show differences of
N, P, K, OC content between farms from different wealth categories and between
plots of the same farm and their average values.
IV.2.1 General Trend of Nutrient Distribution In Different
Plots
In order to measure variability between farms and within
farms, a soil analysis was performed on plots of different farmers. Two
representative farms of each farm category and different plots belonging to the
selected farms were sampled; this helped us to represent soil fertility status
of different farm types identified during the survey. Results are presented as
follow:
1)
2)
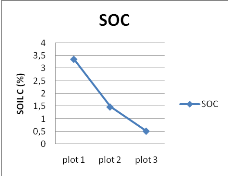
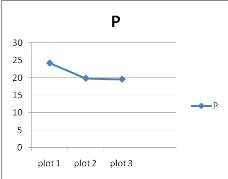 4)
3)
4)
3)
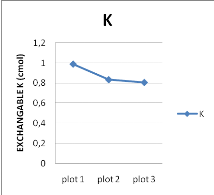
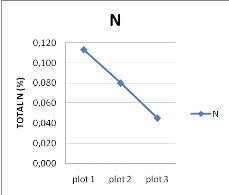
Figure 5: Variability of soil carbon
(1), available P (2), exchangeable K (3) and total N (4) within plots of farm.
Plots no increases as plot position moves from homestead to further
away from home
From these figures, the general observation is that there is a
difference of soil fertility from plot 1 up to plot 3. Form the graph (1) the
general observation is that the level of carbon decreases as we move from plot
1 to plot 3. On basis of the norms of interpretation (Mutwewingabo et Rutunga,
1987) , the content of carbon in plot 1, 2 and 3 indicate that organic matter
content in plot 1 is moderate (since we can determine the organic matter
content of a soil by multiplying carbon values to 1.72 which is a constant),
whereas in plot 2 and 3 is low. Based on the graph (2) it shows that the level
of phosphorus in plot 1 is moderate and low in plot 2 and plot 3 respectively.
The graph (3) reveals that the level of potassium in plot 1 is high, whereas
content in plot 2 and plot 3 is moderate on basis of norms (Mutwewingabo et
Rutunga, 1987). The graph (4) also show levels of nitrogen in plot 1 and plot 2
are moderate whereas the level in plot 3 is low. From these figures, evidence
of decreasing soil fertility in different plots with the distance from the
homestead is provided.
IV.2.2 Differences of Soil Fertility Within Farm
Mean values of two farms from each wealth category as
presented by graphs below, reveals the soil nutrient content of plots on farm,
the graphs are indicating the level of soil carbon, available phosphorus,
potassium and nitrogen.
1)
2)
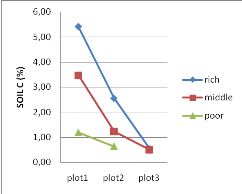
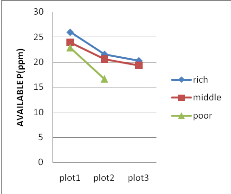
3)
4)
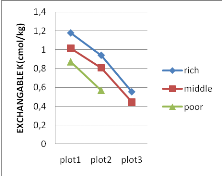
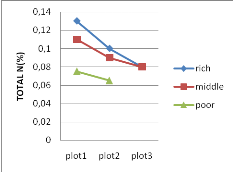
Figure 6:
Variability of total N (1), exchangeable K (2), soil carbon (3), and
Available P (4) in plots on farms in different wealth categories in
Shanga
Plots of wealthy farmers as are indicated by graph 6 are the
one containing more fertile, probably this in relation with large number of
animals owned by the farmer. The high number of livestock providing enough
organic manure to the farm may have a positive influence on soil fertility.
Looking at the soil carbon graph (1) and referring to the standards of
interpretation, we see that the plot 1 of well-off and middle farmers contains
high level of organic carbon but that of the poor farmer has little content.
However, a net C input was observed due to the transfer of biomass from other
fields via crop residues or compost. The graph (2) indicates the level of
phosphorus in 3 plots of different wealth group's farms. Based on the
interpretation standards, it is evident that the plot 1 in all the wealth group
contains moderate quantity of phosphorus, likewise in the plot 2 of the
well-off and middle farmers, except that of the poor farmer which has low
phosphorus level. The plot 3 of well-off farmer contains moderate phosphorus
and low in the middle farmers. The P concentrations in close field reflected
the inputs of ash, composted crop residues and manure, together with kitchen
wastes and house sweepings normally containing chicken dug. Looking at the
nitrogen level (graph (4)) and based on interpretation norms, plot 1 of the
well-off and middle farmers contains high level of nitrogen but it is low in
plot 1 of the poor farmers. Plots 2 and 3 of the well-off and middle farmer
contain moderate nitrogen level, whereas the plot 2 of poor farmer contains low
nitrogen quantity. Based on these data, a decreasing soil fertility level with
the distance from the homestead is also shown.
PART V DISCUSSION
Biophysical and socio-economical factors are major
determinants of farming systems as revealed by several studies conducted across
SSA countries. The current study in Shanga cell clearly showed that there are
different types of farms that differ according to the wealth status and the
management style of the farmer. Categorizing farms on basis of socio-economical
factors seems relevant since farmers categorize themselves on basis of these
factors. With regards to wealth criteria, cattle is still regarded as sign of
wealth in Rwandan rural area and considered as a major criterion for
categorizing socio-economical categories of farmers. In addition to economical
benefits, cattle can also play several roles such as food security through
provision of milk, meat and indirectly provide nutrients through manure. Well-
off farmers can afford to have more than two cattle. However, our observations
indicate that lack of biomass resource and limited grazing area have refrained
people in acquiring more cattle and well-off farmers that own heads tend to
borrow some to poor farmers that allow them access manure, a system known as
«Kuragiza». Other small animals such as pigs, chickens and goats are
also among common livestock. Most farmers prefer them because they don't
require much care or attention.
In Shanga, a typical smallholder farm comprises a house
surrounded by living fences delimiting a compound often used as grazing place
for tethered cattle, fruits trees are scattered around the house. Banana and
local vegetables intercropped with pulses and grains are grown around the
house. A number of plots grown with food crops or timber trees are located at a
distance from home. Looking at the social characteristics of farmers in Shanga,
the majority of the households are headed by men. Although male are in most
cases household heads, female and child are responsible for major part of
agricultural activities and the chief of the family is responsible for looking
for money for family nutritional needs. Most of female headed families are
widow or divorced and poor farmers. Although the majority of surveyed farmers
attended school, large part did not completed the primary schools. The major
reason for not attending school or not sending children to school is largely
attributable to ignorance. The results show difference between farmers with
regards to education. Farmers with resources seem to be more educated than
their fellows in other groups. In addition, they seem to have benefited more
training. Farmers, irrespective of the wealth group they belong to use family
labour .Most rich farmers hired casual labour and in some cases hire permanent
labour. Some farmers from the poor class derived income by working for other
farmers during land preparation, planting, weeding and harvesting times. In
that cell, only the rich farmers were self-sufficient in food production and
obtained only some specific food items on the market. In Middle farmer
category, most income is generated by farming and farmers normally produce
surpluses of food crops for the market. Input-demanding activities such as cash
crops are not widely adopted due to financial limiting. Poor farmers are land
constrained and one or more family members worked casually for other farmers.
Most households headed by women were found within this group. However, some
middle farmers extend the areas under crops by hiring extra land.
Land is an important asset for farmers in general and in
Shanga in particular. The study tried to establish how different farmers have
acquired land. Most farmers get land via inheritance. Few farmers with enough
resources have bought land. In general farm area is small. Land ownership is
dynamic in the area, to the extent that a portion of land can belong to two
different farmers within laps of two seasons. Farmers renting in or out the
part of the land to the others are a common feature in the area. However with
increasing annual rate of the population and continued fragmentation of land
due to in heritance mechanisms of land acquisition, the farm size will continue
to diminish and this will affect negatively the production sustainability.
The adoption of management practices such as fallow and crop
rotation vary between farmers classes and are normally constrained by land
size. Most frequently used organic fertilizers are cattle manure either applied
pure or composted together with other organic resources such as crop residues.
Land use in Shanga is not different to what is seen across the country and
farmers tend to mix several crops to optimize land utilization and try to rely
on their own production. Major food crops grown by farmers are sweet potato,
bean, cassava and sorghum the same as those cultivated in central plateau
(Djimde, 1988; Niang & Styger, 1990). Bean and sweet potatoes are the
traditional food crops not only in Shanga but also for several families in
rural area. The main cash crops are coffee and vegetables. The management of
close and remote fields strongly correlates with farm size, resource endowment
and labour availability. The amount and quality of nutrient resources applied
to them varied also between farmers from different social classes. Resource
management strategies by farmers consist of concentrating fertilizers in some
fields at the expense of other. In Shanga cell, fertilizers are used on crops
especially grown for sale. A large proportion of farmers do use fertilizers,
although often in limited quantities like farmers elsewhere in Africa ( Mapfumo
and Giller, 2001; Tittonell, 2003) . The well-off farmers apply organic
fertilizers to both staple and cash crops while intermediate and poor farmers
allocate preferably them on food crops. Differences in soil fertility status
across the farm are a direct consequence of farm and plot management.
Differential allocation of resources to different plots across
the farm leads to gradients of decreasing soil fertility with increasing
distance from homesteads. The gradient being more pronounced on poor farmers
than on well off farmers. This has been highlighted by soil analysis results
that indicated that distribution of total N, exchangeable K, soil C and
available P decreases from plot 1, near home to plots located far away from
home for the three wealth categories. The amount of total N, soil C, available
P and exchangeable K found is related to wealth categories in the order:
well-of farmers > intermediate farmer > poor farmer. The
difference between farmers owning livestock and those who haven't them shows
that livestock play a major role in recycling of nutrients in farming system as
also shown in other tropical countries such as Zimbabwe (Zingore, 2006).
PART VI: CONCLUSION AND
RECOMMENDATIONS
The main purpose of this work was to analyze the functioning
of different farming systems by establishing their major characteristics and
estimating the level of nutrients at farm and plot scales in Shanga taken as
representative site in plateau central agro-ecological zone. In this region,
priority is given to staple and cash crops. The most prevailing farming systems
are mixed crop and livestock production systems, 54% of surveyed farmers have
at least one goat at home. During this study, three types of farms were
identified based on their socio-economic conditions, namely the well-off,
middle and poor farmers.
Hypotheses formulated have been successfully tested. The
diversity of farms and fields in smallholder farming systems exist due to the
several factors, namely: (i) socio-economical factors; and (ii) management
factors. Plots belonging to the same farm are managed differently. Plots near
homestead where farmers allocate more nutrients are more fertile than those
located far away and receiving little fertilizers. Also other factors such as
labour are also limiting depending on the family size and wealth. Large
differences in nutrient content in plot's soils on different farms are linked
to resource endowment. Fertilizing farm fields far away from home requires
labour and much physical efforts.
Based on the results of our study, the following
recommendations can be made:
- Simple technologies that do not require lot of investment
such as agroforestry practices, rotation systems including legume crops should
be promoted to increase soil fertility on poor farms and training of farmers
for use of these technologies should be promoted.
- Crop production level of farms belonging to different wealth
categories should be
estimated. In order to evaluate average income of these
farms and therefore
scenario for improvements can be formulated
- The framework used to characterize farming system combines
both biophysical and socio-economical aspects and allow a comprehensive
understanding of the functioning of a farm. It should be recommended for other
areas of Rwanda so that options for improving productivity on an individual
category of farms can be then designed.
REFERENCES
Books and journals
Graves Anil, Matthews Robin and Waldi Kevin e, 2004. Low
external input technologies for livelihood improvement in subsistence
agriculture. Agriculture, Ecosystems and Environment 116. Bedfordshire,
UK
Rayar Antony Joseph, 2000.Sustainable Agriculture in
Sub-Sahara Africa, The role of soil productivity. Chennai India
Cairns M. and Garrity,1999,Improving shifting cultivation
in southeast Asia by building on indigenous fallow management strategies.
Agroforestry System 47,37-48. Slash and Burn, Swidden
Crowley, E.L., Carter, S.E., 2000.Agrarian change and the
changing relationships between toil and in Maragoli, western Kenya
(1900-1994).Hum.Ecol.28, 383-414.
Deckers, J., 2002. A system approach to target balanced
nutrient management in soilscapes of sub-Sahara Africa In: Vanlauwe, B.,
Diels, J., Sangiga, N, Merckx, R. (eds.), integrated plant nutrient
management in sub-Sahara Africa. From concepts to practice. CAB
International, Wallingford, UK pp 47-61.
Djimde, M., ed. 1988. Potentiel agroforestier dans
les systèmes d'utilisation des sols des hautes terres d'Afrique de
l'Est a régime pluviométrique bimodal. Rapport AFRENA,
Nairobi: ICRAF.
Drechsel P.,Steiner,K.G.and Hagedon,F.1996,A review on the
potential of improved fallows and green manure in Rwanda. Agroforestry
system 33-109. ISAR Rubona, Rwanda
John Dixon and Aidan Gulliver with David Gibbon, 2001.
Farming Systems and Poverty, improving farmers' livelihoods in a changing
world, 2 p. Roma, Italy
Haque I, Jutsi I, Neate P.J.H, 1985. Potentials of forage
legumes in farming systems of Sub-Sahara Afrca.Proceding of workshop held
at ILCA Addis Abeba, Ethiopia.
ISAR, 1990.Document de référence pour la
préparation du plan directeur nationale de la recherche agricole.
Rubona Rwanda
ISAR, 1991. Perception paysanne de la variabilité
des sites et gestion de leur productivité. en rapport annuel 1990.
Département étude du milieu et systèmes de production.
Rubona, Rwanda.
Jacques Tassin, 1989: Diversité des systèmes
de production sous l'angle de
l'agroforesterie. Résultats d'enquête en
milieu rural au Rwanda. Ruhande, Butare : ISAR Département de
foresterie, and Nairobi: ICRAF 12-13p.
Juo, 1978: Selected methods for soil and plant analysis
IITA, PMB 5320, Ibadan, Nigeria, 52 p.
Loning, N, 2002.Should Africa protects its farmers to
revitalize its economy? Gatekeeper Series 105, IIED (International
Institute for Environment and Development), London, UK.
Louise E.Buck,Eric C.M.Fernandes,1999.Agroforestry in
Sustainable Agriculture Systems.CRC Press, Boca Raton,London,New
York,Washington,DC
Gichuru,M.p, Bationo,A, Bekunda,M.A, Goma,H.C, Mafongonya P.L,
Mugendi D.N, Murwira H.M.,.Nandwa S.M, Nyathi P.and. Swift M.J,2004.Soil
fertility management in Africa: A regional perspective. Nairobi,
Kenya
Mapfumo, P.and Giller, K.E., 2001.Soil fertility
management strategies and practices by smallholder farmers in Semi-arid areas
of Zimbabwe.ICRISAT/FAO, Pantancheru, AP, India.
MINAGRI, 1991. Commission nationale de l'agriculture,
Rapport préliminaire, Kigali
MINAGRI, 1997.Plan directeur del'élevage volume I
version préliminaire. MINAGRI, KIGALI.
MINECOFIN, 2004.Indicateur du développement du
Rwanda. Kigali
MINIPLAN, 1984: Stratégies alimentaire au Rwanda.
Objectifs, chiffres et programmes
d'actions. Document n°3. Kigali. 194 p.
Mutwewingabo et Rutunga, 1987: Etude des sols des stations
d'essai du projet PIA situés dans la Mwogo, à Gitarama, à
Kaduha et dans la vallée de l'Akanyaru, MINAGRI- PIA, 114 p.
National Research Council, 1993.Sustainable agriculture
and environment in the Humid Tropics. National academy press, Washington,
DC.
Niang, A. I. & Stiger E., 1990.Les systèmes
d'utilisation des terres et leur potentiel agroforestier au Rwanda. In A.
I. Niang ; A. Gahamanyi& E. Stiger. Eds., Actes de la
première réunion agroforestière organisée par le
projet ICRAF/ISAR du 13 au 15/9/1990 à kigali. AFRENA report No36.
Butare, Rwanda. ICRAF/ISAR.
Pridencio, C.F., 1993.Ring management of soils and crops
in the West Africa semi-arid tropics: the case of the Mossi farming systems in
Burkina Faso. Agri. Ecosystem .Environ. 47,237-264. Ouagadougou
Richard R. Harwood, 1979.Small farm developpement:
Understanding and improving Farming systems in the humid tropics, Boulder,
Colorado.
Robert A. Luening,.Richard M.S, Klemme M, William P.
Mortenson, 1991. The farm management hand book, Interstate
Publishers, Inc Danville, Illinois.
Rothenberg, H., 1980.Farming system in the tropics,
third ed. Clarendon Press, Oxford. Sanchez,P.1999, Improved fallows come of
age in the tropics. Agroforestry systems 47,3-12. Nairobi, Kenya
Scones I, 2001.Dynamics and diversity soil fertility
management and farming livelihoods in Africa: case studies from
Ethiopia, Mali and Zimbabwe.Earthscan Publication Ltd, London, UK.
SHAMIE ZINGORE, 2006.Exploring diversity within
small-holder farming systems in Zimbabwe: Nutrient use efficiencies
and resource management strategies for crop production, Wageningen.
Smaling,E.M.A., Fresco,L.O.,De Jager, A.,1996.Classifying
and monitoring soil nutrient stocks and flows in African agriculture.Ambio
25,492-496.
Tittonell, P., 2003.Soil fertility gradients in
smallholder farm of Western Kenya: Their origin, management and
importance. Wageningen, Netherland
Tittonell, P., Vanlauwe B., Leffelaar P.A., Rowe E., Giller
K.E., 2005b.Exporing diversity in soil fertility management of smallholder
farms in western Kenya. I. Heterogeneity at region and farm
scale.Agric.Ecosyst.Environ 110,149-165. Bangor, UK
Vanlauwe, B. and K.E.Giller, 2006.Popular myths around
soil fertility management in Sub-Sahara Africa. Agriculture, Ecosystems
and Environment 116 pp 34-46. Nairobi, Kenya
Shaner,W.W, Philipp,P.F ,Schmeh,W.R, 1981.Farming systems
research and development: guidelines for developing countries. Volume I,
United States agency for international development, Washington, DC, USA.
Willem C. Beets, 1982: Multiple cropping and tropical
farming system: 31-43 p. Colorado, USA
Yearbook of Agriculture 1943-1947. Science in
farming: United States, Department of Agriculture, Washington, DC, US
Government printing office.
Mémoires
HITIMANA Nicolas, 1989.Etude du bilan d'azote, du
phosphore et potassium sous deux systèmes de production du haricot
(Phaseolus Vulgaris L) : Rotation sorgho--haricot et haricot
bananeraie. Mémoire UNR Butare
MUBASHANKWAYA Isaac, 2005.Contribution du projet HPI
à l'élevage bovin laitier au Rwanda : cas de la
province de Byumba.Memoire, UNR Butare.
NSHIMYUMUKIZA Wellars et BENDA Théophile,
2005.Etude des systèmes de cultures intégrant
l'agroforesterie dans la gestion des sols.Mémoire, ISAE
NYOMBAIRE George, 2001.Yield and phenological comparison
of Longe1 and Hybrid bunder different nutrient treatments in the Central
plateau of Rwanda: A case study of Tonga Experimental station.Memoire, UNR
Butare
Web Sites
http://
www.cipav.org.co/lrrd18/8/kune18113.htm
(May, 2007)
http://
www.fao.org/AG/aga/lspa/LXETML/tech/ch3b.htm
(Avril 2007)
http://
www.minagri.gov.rw(July 2007).
http://www.rwandagateway.com (August 2007)
http://
www.wikipedia.org/wiki / crop
rotation (April, 2007)
http://
www.wikipedia.org/wiki /monoculture
(April, 2007)
APPENDIXES
Appendix 1: Rapid Survey Questionnaire:
|
Name of household head:
|
|
Location (district/sector/cell/village/farm code):
|
|
Homestead Northing:
Easting:
Closest market (local &city) :
Observations :
|
a) Background information
|
1. Farmer name and age:
|
|
2. Household head: M/F
|
3. Family composition:
|
|
4. Household's marital status (circle):
Single widow(er) separated married(absent spouse)
married(present spouse)
|
b) Land holdings (acres)
|
5. Is land owned/occupied/rented?
5.1. Area owned:
5.2. Area cultivated:
5.3. Area under fallow:
5.4. Area for grazing:
|
6.1. Area rented in.........out..............
6.2. Use of common rangeland: yes/no
6.3. Have own woodlot: yes/no
|
c) Labour
|
7. Family size:
|
8. Number of household members working on farm full-time:
|
|
9.1. Labour use (circle):
Only use household labour Hire casuals Hire
full time farm-worker
9.2. Which are the activities for which labour is hired?
|
|
10.1. Sell labour to others: yes/no
10.2. Locally?
10.3. For which activities?
|
d) Livestock (indicate also main production:
meat/milk)
|
11. Number of local cows:
14. Number of sheep(of which rams):
|
12. Number of grade or improved cows:
15. Number of goats(of which bucks):
|
13. Number of oxen:
16. Others(chickens, pigs):
|
e) Use of key resources (in last 2 of last 5
years)
|
17. Inorganic fertilizer on which crops(circle):
Staples/staple & cash crops/cash crop/none
|
18. compost on which crops(circle):
Staples/staple & cash crops/cash crop/none
|
|
19. Farmyard manure on which crops (circle):
Staples/staple & cash crops/cash crop/none
|
20. Green manure on which crops(circle):
Staples/staple & cash crops/cash crop/none
|
f) Production activities and orientation
|
21. Farm production this year was used(circle):
Only for subsistence/ For subsistence + market/
Mostly for market
|
|
22. The most important food crops
|
23. The most important income-earning crops or activities
|
g) Income
|
Number of adults working full time in a formal wage job or owning
a full time business (how large, stable is income?)
24. Now?
25. How long(Circle): 0-5 yrs/ 5-10 yrs/
>10 yrs
26. Number of adults working outside the area, sending
remittances:
What are the times of the year in which there are important cash
needs?
Farmer's estimation of the % of income generated on-farm/
off-farm
|
h) Food security
|
27. Number of months farm produce of staple crops feeds
family:
|
27. Number of months household buys/gets stable foods from
outside:
|
|
29. Months of food deficit:
|
30. Does food deficit occur every year?
|
i) Farm assets and infrastructure
|
31.Transport
32. Tillage (including oxen) and crop husbandry
33. Livestock facilities (e.g.: roofed stalls)
34. Storage facilities
35.Size of the compound, type of house(e.g.: semi-permanent)
36.Water well, irrigation system, etc.
|
Comments
|
Indicate educational level of household head and skills(e.g.:
retired teacher)
Indicate wealthy status if you consider this to be important(e.g.
:type of roofing for main house)
Indicate affiliations to particular groups within the
community(e.g. :religious)
|
|
CATEGORY
|
Sample code
|
pH eau
|
pH KCl
|
C % N % C/N OM
%
|
P available/ppm
|
Uptaken K+
|
|
|
RICH
|
F91P1
|
5,05
|
4,89
|
5,71
|
0,13
|
43,90
|
9,82
|
25,55
|
1,245
|
|
|
F91P2
|
5,04
|
4,46
|
2,48
|
0,1
|
24,80
|
4,27
|
23,03
|
1,123
|
|
|
F91P3
|
5,35
|
5,05
|
0,53
|
0,08
|
6,60
|
0,91
|
20,29
|
0,921
|
|
|
F77P1
|
5,07
|
4,51
|
5,13
|
0,12
|
42,77
|
8,83
|
24,36
|
1,011
|
|
|
F77P2
|
5,07
|
4,51
|
2,62
|
0,1
|
26,20
|
4,51
|
22,07
|
0,759
|
|
MIDDLE
|
F80P1
|
4,81
|
4,73
|
2,97
|
0,11
|
26,99
|
5,11
|
23,26
|
1,044
|
|
|
F80P2
|
5,14
|
4,94
|
1,53
|
0,09
|
16,97
|
2,63
|
21,25
|
0,993
|
|
|
F80P3
|
4,91
|
4,69
|
0,49
|
0,08
|
6,14
|
0,84
|
19,32
|
0,744
|
|
|
F78P1
|
5,9
|
5,65
|
3,97
|
0,11
|
36,09
|
6,83
|
23,38
|
0,888
|
|
|
F78P2
|
5,23
|
5,23
|
0,91
|
0,09
|
10,11
|
1,57
|
20,81
|
0,721
|
|
POOR
|
F72P1
|
4,09
|
4,09
|
1,31
|
0,08
|
16,38
|
2,25
|
20,120
|
0,708
|
|
|
F72P2
|
4,75
|
4,69
|
0,59
|
0,07
|
8,39
|
1,01
|
19,174
|
0,642
|
|
|
F73P1
|
6,4
|
6,26
|
1,06
|
0,07
|
15,14
|
1,82
|
21,552
|
0,732
|
|
|
F73P2
|
5,94
|
5,49
|
0,69
|
0,06
|
11,58
|
1,20
|
18,026
|
0,659
|
Appendix 2: Soil analysis results
Appendix 3: Chemical analysis interpretation
|
Organic Matter (%)
|
Appreciation
|
|
0,5
0,5-1
1-2
2-5
5-8
8-14
>14
|
Quite low
Very low
Low
Average
High
Very high
Exceptional
|
|
Total Nitrogen (%)
|
Appreciation
|
|
< 0,075
0,075-0,125
>0,125
|
Low
Average
High
|
|
Available P (ppm)
|
Appreciation
|
|
= 3
3-20
20-50
50-80
= 80
|
Very low
Low
Average
High
Very high
|
|
C/N Ratio
|
Appreciation
|
|
< 9
9-12
12-17
17-25
> 25
|
Very low mineralization
High mineralization
Moderate mineralization
Slow mineralization
Very slow mineralization
|
|
Organic C
|
Appreciation
|
|
< 0,5
0,5-1,5
1,5-3,0
> 3,0
|
Very low
Low
Average
High
|
|
Echangeable K
(cmol (+)/kg de sol
|
Appreciation
|
|
<0.1
0.1-0.2
0.2-0.6
0.6-1.2
>1.2
|
Très faible
Faible
Moyen
Elève
Très élevé
|
|
Azote total
|
Appreciation
|
|
0.08-0.13
>0.13
|
Faible
Moyen
|
Source: Mutwewingabo et Rutunga, 1987
Appendix 4: List of farmers interviewed in Shanga
cell
|
|
FARMER' NAME
|
CODE
|
WEALTH CATEGORY
|
|
1
|
MATABARO Francois Xavier
|
68
|
well-off
|
|
2
|
BAMPIRE Veneranda
|
130
|
well-off
|
|
3
|
DEGERI Emmanuel
|
100
|
well-off
|
|
4
|
KAMUGUNGA Vianney
|
70
|
well-off
|
|
5
|
KIMONYO Innocent
|
91
|
well-off
|
|
6
|
MUNYAKAYANZA Laurent
|
101
|
well-off
|
|
7
|
NKOMEJE Narcisse
|
102
|
well-off
|
|
8
|
RUSANGANWA Vianney
|
77
|
well-off
|
|
9
|
SABAGIRIRWA Vincent
|
69
|
well-off
|
|
10
|
BAKUNDUKIZE Athanase
|
107
|
Middle
|
|
11
|
BUTERA J Damascene
|
104
|
Middle
|
|
12
|
HARERIMANA Alexis
|
103
|
Middle
|
|
13
|
KABAYUNDO Stefanie
|
79
|
Middle
|
|
14
|
KARINDA Jean
|
115
|
Middle
|
|
15
|
MBONABUCYA Andre
|
74
|
Middle
|
|
16
|
MUHIRE Desiree
|
76
|
Middle
|
|
17
|
MUKAGASHONGORE Anonciate
|
121
|
Middle
|
|
18
|
MUKAMURIGO Suzane
|
84
|
Middle
|
|
19
|
MUKAMUYANGO Domitilia
|
89
|
Middle
|
|
20
|
MUKANGENZI Laurence
|
116
|
Middle
|
|
21
|
MUREGANSHURO Innocent
|
118
|
Middle
|
|
22
|
NDIKURYAYO Samuel
|
131
|
Middle
|
|
23
|
NKEBUKANDE Gaspard
|
105
|
Middle
|
|
24
|
NYIRANSAGIZA Consensa
|
119
|
Middle
|
|
25
|
NYIRANTAWUBIZERA
|
120
|
Middle
|
|
26
|
RUHORAHOZA Justin
|
80
|
Middle
|
|
27
|
RUKEBESHA Vincent
|
117
|
Middle
|
|
28
|
RUTABAYIKA Boneventure
|
123
|
Middle
|
|
29
|
SABANE Laurent
|
78
|
Middle
|
|
30
|
TEGEJO Emmanuel
|
122
|
Middle
|
|
31
|
VUGUZIGA Timothé
|
132
|
Middle
|
|
32
|
BAGIRISHYA Alphonse
|
114
|
Poor
|
|
33
|
BAVUGIRIJE Simon
|
87
|
Poor
|
|
34
|
DUSABE Patricie
|
108
|
Poor
|
|
35
|
GASAMUNYIGA Gabriel
|
128
|
Poor
|
|
36
|
HABIMANA Leonard
|
98
|
Poor
|
|
37
|
HARERIMANA Elie
|
95
|
Poor
|
|
38
|
IGENORYAYO Alexis
|
92
|
Poor
|
|
39
|
MINANI Jean
|
99
|
Poor
|
|
40
|
MUKAKAYONGA Laurencie
|
83
|
Poor
|
|
41
|
MUKAMURIGO Violette
|
109
|
Poor
|
|
42
|
MUKAMUSONI Velene
|
75
|
Poor
|
|
43
|
MUKAMUVARA Marceline
|
113
|
Poor
|
|
44
|
MUKANGOMBWA Agnes
|
111
|
Poor
|
|
45
|
MUKARANGO Anonciata
|
127
|
Poor
|
|
46
|
MUKARUGENERA Esperence
|
71
|
Poor
|
|
47
|
MUKARUTESI Winifride
|
106
|
Poor
|
|
48
|
MURENGERA Damien
|
94
|
Poor
|
|
49
|
MUSABIMANA Berancille
|
88
|
Poor
|
|
50
|
MYASIRO Celestin
|
82
|
Poor
|
|
51
|
NDAYISABA Boniface
|
90
|
Poor
|
|
52
|
NIBIVUGIRE Patricie
|
81
|
Poor
|
|
53
|
NIYIBIZI Andre
|
125
|
Poor
|
|
54
|
NKUSI Emmanuel
|
124
|
Poor
|
|
55
|
NTAGANDA Alphonse
|
93
|
Poor
|
|
56
|
NTAKIRUTIMANA Oswald
|
110
|
Poor
|
|
57
|
NTAMWEMEZI Vedaste
|
97
|
Poor
|
|
58
|
NYIRAMIHIGO Judith
|
85
|
Poor
|
|
59
|
NZAMURAMBAHO Innocent
|
126
|
Poor
|
|
60
|
NZEYIMANA Emmanuel
|
73
|
Poor
|
|
61
|
RUTAYISIRE Innocent
|
86
|
Poor
|
|
62
|
RUTESI Bosco
|
72
|
Poor
|
|
63
|
RWABIGWI Francois
|
129
|
Poor
|
|
64
|
SIBOMANA Fidele
|
96
|
Poor
|
|
65
|
TURASENGAMUNGU Stanislas
|
112
|
Poor
|
|
|


