IV.2. SOIL NUTRIENT STATUS
The soil nutrient status are presented to show differences of
N, P, K, OC content between farms from different wealth categories and between
plots of the same farm and their average values.
IV.2.1 General Trend of Nutrient Distribution In Different
Plots
In order to measure variability between farms and within
farms, a soil analysis was performed on plots of different farmers. Two
representative farms of each farm category and different plots belonging to the
selected farms were sampled; this helped us to represent soil fertility status
of different farm types identified during the survey. Results are presented as
follow:
1)
2)
 4)
3)
4)
3)
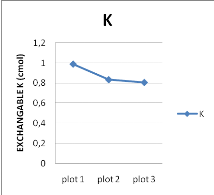
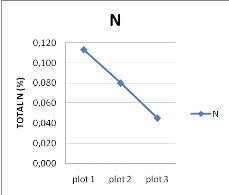
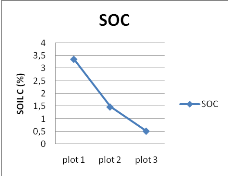
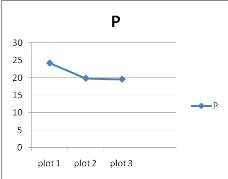
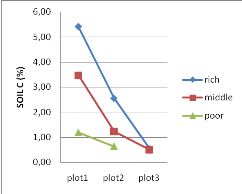
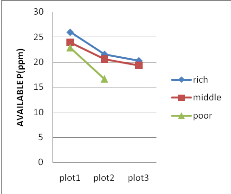
Figure 5: Variability of soil carbon
(1), available P (2), exchangeable K (3) and total N (4) within plots of farm.
Plots no increases as plot position moves from homestead to further
away from home
From these figures, the general observation is that there is a
difference of soil fertility from plot 1 up to plot 3. Form the graph (1) the
general observation is that the level of carbon decreases as we move from plot
1 to plot 3. On basis of the norms of interpretation (Mutwewingabo et Rutunga,
1987) , the content of carbon in plot 1, 2 and 3 indicate that organic matter
content in plot 1 is moderate (since we can determine the organic matter
content of a soil by multiplying carbon values to 1.72 which is a constant),
whereas in plot 2 and 3 is low. Based on the graph (2) it shows that the level
of phosphorus in plot 1 is moderate and low in plot 2 and plot 3 respectively.
The graph (3) reveals that the level of potassium in plot 1 is high, whereas
content in plot 2 and plot 3 is moderate on basis of norms (Mutwewingabo et
Rutunga, 1987). The graph (4) also show levels of nitrogen in plot 1 and plot 2
are moderate whereas the level in plot 3 is low. From these figures, evidence
of decreasing soil fertility in different plots with the distance from the
homestead is provided.
IV.2.2 Differences of Soil Fertility Within Farm
Mean values of two farms from each wealth category as
presented by graphs below, reveals the soil nutrient content of plots on farm,
the graphs are indicating the level of soil carbon, available phosphorus,
potassium and nitrogen.
1)
2)
3)
4)
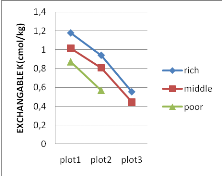
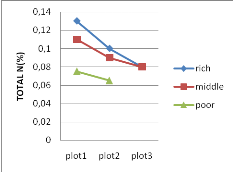
Figure 6:
Variability of total N (1), exchangeable K (2), soil carbon (3), and
Available P (4) in plots on farms in different wealth categories in
Shanga
Plots of wealthy farmers as are indicated by graph 6 are the
one containing more fertile, probably this in relation with large number of
animals owned by the farmer. The high number of livestock providing enough
organic manure to the farm may have a positive influence on soil fertility.
Looking at the soil carbon graph (1) and referring to the standards of
interpretation, we see that the plot 1 of well-off and middle farmers contains
high level of organic carbon but that of the poor farmer has little content.
However, a net C input was observed due to the transfer of biomass from other
fields via crop residues or compost. The graph (2) indicates the level of
phosphorus in 3 plots of different wealth group's farms. Based on the
interpretation standards, it is evident that the plot 1 in all the wealth group
contains moderate quantity of phosphorus, likewise in the plot 2 of the
well-off and middle farmers, except that of the poor farmer which has low
phosphorus level. The plot 3 of well-off farmer contains moderate phosphorus
and low in the middle farmers. The P concentrations in close field reflected
the inputs of ash, composted crop residues and manure, together with kitchen
wastes and house sweepings normally containing chicken dug. Looking at the
nitrogen level (graph (4)) and based on interpretation norms, plot 1 of the
well-off and middle farmers contains high level of nitrogen but it is low in
plot 1 of the poor farmers. Plots 2 and 3 of the well-off and middle farmer
contain moderate nitrogen level, whereas the plot 2 of poor farmer contains low
nitrogen quantity. Based on these data, a decreasing soil fertility level with
the distance from the homestead is also shown.
| 

