Plots with a higher sensibility to water
Lower sensibility
Figure 4.4: Sensibility of various plots to water stress
with respect to Kc
4.5.2 Spatial representation of some plot valves
For interventions on the plots, prompt actions could be taken
if the exact valves that need to be opened or closed are being represented
graphically as shown. When water becomes a limiting factor, particular plots
which to be privileged could thus be quickly identified and satisfied. This is
obtained through queries on the database and the results represented spatially
on map as shown in Figure 4.5. In case of a repair intervention on a given
plot, the exact valve to be closed is easily recognized geographically from the
map. Another utility of such a map could be in the regulation of pressure on a
given plot during periods of water shortages, by closing the valves which have
plants which are less sensitive to water stress and opening those of plots with
a high sensitivity to water stress.
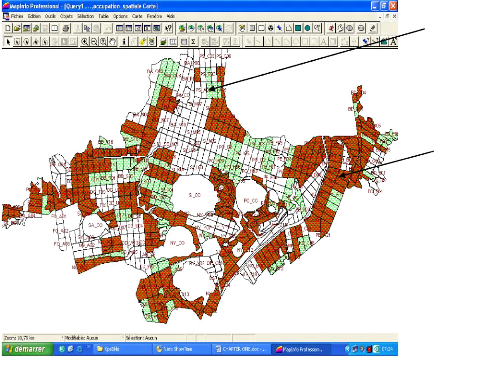
Figure 4.5: Plot valves for two irrigation
plots
4.5.3 Theissen polygon for rainfall heights on the
plantation
Rainfall heights entered in the database from the different
meteorological stations are being interpolated to get the rainfall in
plantations with no rain gauges using the MapInfo GIS software. The
distribution of rainfall within the different plots in the plantation could be
obtained spatially and integrated into maps to get the rainfall depths for
other portions of the plantation with no rain gauges. Figure 4.5 shows the
distribution of rainfall depths in the plantation after a rainfall in the
plantation. The irrigation manager uses this information to adjust the water
requirements of each plot in the water balance equation by knowing the amount
of rainfall that is received each plot. This is to minimize energy used in
pumping of water and hence to maximize profits from the sale of bananas.

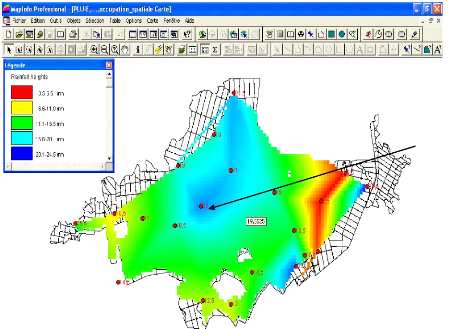
Position of rain guage
Figure 4.6: Repartition of rainfall depths in the
plantation
CHAPTER V: CONCLUSIONS AND RECOMMENDATIONS 5.1
Conclusions
Based on the methodology used and the analysis of results:
· A total of 17 tables for the various aspects
pertaining to irrigation management have been developed for the database. The
main aspects such as the crop coefficients of the various production plots, the
irrigation systems involved etc. These tables developed help in enhancing data
entry and retrieval through the use of forms and queries.
· Thematic layers for the GIS such as the soil types,
the boundary/limit of the various plots have been determined by the use of a
map of the plantation developed with the use of a GPS. This land use map
constituted the main thematic layer for the GIS.
· The crop water requirements were calculated to be 40
mm for an average rooting depth of 50 cm for the irrigation of banana in the
area. The probability of satisfaction reveals that, this depth of water will
satisfy crop water requirements 1 year out of 20. The water requirement will be
adjusted in the database depending on the ETc and Peff of
the previous day or week.
· Analysis of the existing network revealed that, the
system in place is functioning properly considering the pressures and flow rate
required. The flow velocities (0.8=V= 1.1 m/s) in the different branches of the
network show that they are satisfactory. This shows that if there exist
deficiencies in the system this could be only due to scheduling options as
earlier stated by Sisodia, (1992).
· Maps have been developed for plot valves, position of
rain gauges in the plantation, the type of irrigation system involved, the
sensibility of the various plots to water stress and other aspects related to
the irrigation system and which are necessary for the calculation of the water
requirements have been represented spatially to help irrigation managers in the
aspects of irrigation scheduling. Maps for any event on the plantation could
thus be printed out and given to the technicians for execution of particular
tasks on the irrigation system.
The irrigation network has undergone some form of evaluation
and monitoring. For instance, monitoring of the flow rates in the main
irrigation canals has been carried out. If
this type of information is available in a GIS format,
evaluation and monitoring can be made easier, timely and cost-effective.
| 

