CHAPTER FOUR: PRESENTATION OF RESEARCH FINDINGS AND
ANALYSIS
3.0 Introduction
This chapter is comprised of two sections: Section A presents
the quantitative data which corresponds to the first objective while section B
presents the qualitative data that corresponds to the last three objectives.
The results of the quantitative data in section A are
presented in the form of tables and their corresponding charts. The qualitative
results are presented in section B. This section describes the interview of
participants, the emerged themes and then presentation of the results. In the
presentation of the findings, verbatim quotations from interviews were used to
illustrate response. For anonymity and confidentiality of the participants, the
participants were given cryptogram as R1 to R2.
3.1 Section A: Quantitative Data
These results respond to the first objective which was to
explore the level of awareness of EKJ&CIE employees in relation with risk
management.
Table 4.1.1: Distribution of respondents by
Gender
|
Gender
|
Number
|
Percentage
|
|
Males
|
39
|
78
|
|
Females
|
11
|
22
|
|
Total
|
50
|
100
|
Source: Field research, June 2011
The table above and chart below show that among 50
respondents, 39 or 78% were males while 11 or 22% were females. This inequality
explains that there are few female technicians employed by this company which
may have an impact on decision making whereby men are more represented than
females.
Chart 4.1.1 Distribution of
Respondents by Gender
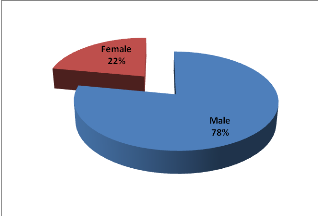
Source: Field research, June 2011
Also, the reason as to why males out number females is that,
in Rwanda, males tend to study engineering related courses than females, and
therefore have more chances of being employed than females. It means that males
are more influential than females in all matters regarding their activities
thus the female contribution may be little for instance while planning for risk
management, the campany may set only those set by men thus women related risks
may be neglected.
Table 4.1.2 Distribution of
resondents by age
|
Age
|
Number
|
Percentage
|
|
< 20
|
0
|
0
|
|
20-29
|
35
|
70
|
|
30-39
|
9
|
18
|
|
40-49
|
6
|
12
|
|
Total
|
50
|
100
|
Source: Field research, June 2011
The table 4.1.2 above and collesponding chart below explain
the distribution of respondents according to their age groups. Generally, 35
emloyees which are 70% are between 20 and 29 years of age, followed by 9
employees or 18% who are between 30 and 39 years of age. Those aged between
40 and 49 are 6 or 12 % of respondents while nobody above 50 years or below 20
years of age.
This explains how the company employs young aged personnel
mainly because its main works are technical and require physical fitness and
agility.
Chart 4.1.2 Distribution of
Respondents by age
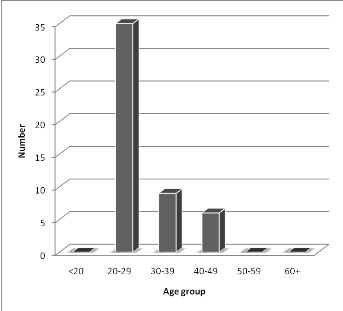
Source: Field research, June 2011
As far as risk management is concerned, this age distribution
on one hand has a positive impact on the company in the way that young people
are the ones fit to perform energy requiring activities such as construction
works and are less exposed to work related deseases such as low back pains etc.
again as the majority are below 30 years of age, the campany has great
opportunity to employ them for long time which may be good for the management
to use less money for new recruitments and medical expences because normally
people of this age group do not fall sick frequently compared to older people.
On the other hand, this age distribution may play a negative impact on the
company in the way that this group may be the one with little job experience
which expose them to incidents/accidents risks more than older employees,
furthermore this may also affect the overall quality of the company's work. If
not controlled, this group (20-29) may tend to negliget the use personal
protective equipments because they feel capable to work with much agility and
speed but this may expose them to minor as well as major injuries which may
cause a huge loss of human resources, financial and reputation to the company.
Table 4.1.3 Distribution of
respondents by Education
|
Education level
|
Number
|
Percentage
|
|
Primary
|
11
|
22
|
|
Secondary
|
19
|
38
|
|
Advanced diploma
|
12
|
24
|
|
Bachelor degree and above
|
8
|
16
|
|
Total
|
50
|
100
|
Source: Field research, June 2011
The table 4.1.3 above and coresponding pie chart below show
the distribution of education among respondents. No illeterate respondent, 22%
have a primary education level, 38% have a secondary level, 24% with advanced
diploma while 16% have bachelor degree and above.
This distribution shows a positive thing whereby no illiterate
personel employed by the company which is good for the company management in
relation with risk management because every body is able to read the campany's
manual of internal rules and regulations and can report any incident through
writing to the management.
| 

