ANNEXES
600
500
400
300
200
100
LH1
LC1
LL1
70 75 80 85 90 95 00
LD1
10000
8000
6000
4000
2000
0
70 75 80 85 90 95 00
LI1
LY1
6000
5000
4000
3000
2000
1000
0
70 75 80 85 90 95 00
LV1
70 75 80 85 90 95 00
4000
3000
2000
1000
0
70 75 80 85 90 95 00
1200
1000
800
600
400
200
0
2000
1500
1000
500
0
4000
3000
2000
1000
0
70 75 80 85 90 95 00
70 75 80 85 90 95 00
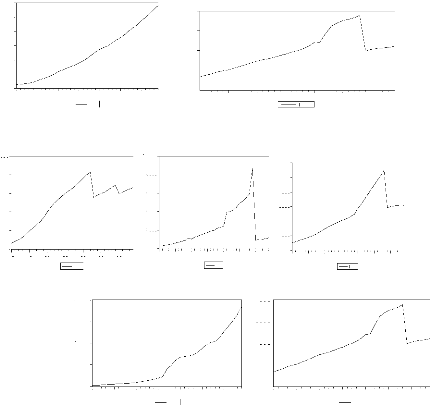
Illustration graphique des séries
(échantillon 1, l'ensemble des
pays)
70 75 80 85 90 95 00

LY1 LL1 LC 1
LD 1 LI1 LV1
LH 1
TEST DE RACINE UNITAIRE (Augmented Dickey Fuller)
Test en niveau LY1
ADF Test Statistic -1.333631 1% Critical Value* -4.2605
5% Critical Value -3.5514
10% Critical Value -3.2081
*MacKinnon critical values for rejection of hypothesis of a unit
root.
Augmented Dickey-Fuller Test Equation
Dependent Variable: D(LY1) Method: Least Squares
Date: 01/31/09 Time: 17:23 Sample(adjusted): 1972 2004
Included observations: 33 after adjusting endpoints
|
Variable
|
Coefficient
|
Std. Error t-Statistic
|
Prob.
|
|
LY1(-1)
|
-0.161056
|
0.120765 -1.333631
|
0.1927
|
|
D(LY1(-1))
|
0.073784
|
0.196933 0.374665
|
0.7106
|
|
C
|
265.6855
|
152.3807 1.743563
|
0.0918
|
|
@TREND(1970)
|
5.661507
|
11.10387 0.509868
|
0.6140
|
|
R-squared
|
0.088087
|
Mean dependent var
|
44.42121
|
|
Adjusted R-squared
|
-0.006249
|
S.D. dependent var
|
342.2448
|
|
S.E. of regression
|
343.3124
|
Akaike info criterion
|
14.62837
|
|
Sum squared resid
|
3418039.
|
Schwarz criterion
|
14.80977
|
|
Log likelihood
|
-237.3681
|
F-statistic
|
0.933763
|
|
Durbin-Watson stat
|
2.016349
|
Prob(F-statistic)
|
0.436971
|
|
En Différence première
|
|
|
|
ADF Test Statistic -3.855490
|
1% Critical Value*
|
-4.2712
|
|
|
5% Critical Value
|
-3.5562
|
|
|
10% Critical Value
|
-3.2109
|
*MacKinnon critical values for rejection of hypothesis of a unit
root.
Augmented Dickey-Fuller Test Equation Dependent Variable:
D(LY1,2)
Method: Least Squares
Date: 01/31/09 Time: 17:26
Sample(adjusted): 1973 2004
Included observations: 32 after adjusting endpoints
|
Variable
|
Coefficient
|
Std. Error t-Statistic
|
Prob.
|
|
D(LY1(-1))
|
-1.049021
|
0.272085 -3.855490
|
0.0006
|
|
D(LY1(-1),2)
|
0.015051
|
0.189173 0.079564
|
0.9371
|
|
C
|
175.5644
|
149.9251 1.171014
|
0.2515
|
|
@TREND(1970)
|
-7.019125
|
7.137056 -0.983476
|
0.3338
|
|
R-squared
|
0.516330
|
Mean dependent var
|
-0.656250
|
|
Adjusted R-squared
|
0.464508
|
S.D. dependent var
|
491.4087
|
|
S.E. of regression
|
359.5996
|
Akaike info criterion
|
14.72433
|
|
Sum squared resid
|
3620733.
|
Schwarz criterion
|
14.90755
|
|
Log likelihood
|
-231.5893
|
F-statistic
|
9.963572
|
|
Durbin-Watson stat
|
1.997958
|
Prob(F-statistic)
|
0.000123
|
|
Test en niveau LL1
|
|
|
|
ADF Test Statistic -0.368433
|
1% Critical Value*
|
-4.2605
|
|
|
5% Critical Value
|
-3.5514
|
|
|
10% Critical Value
|
-3.2081
|
*MacKinnon critical values for rejection of hypothesis of a unit
root.
Augmented Dickey-Fuller Test Equation
Dependent Variable: D(LL1)
Method: Least Squares
Date: 01/31/09 Time: 17:27
Sample(adjusted): 1972 2004
Included observations: 33 after adjusting endpoints
|
Variable
|
Coefficient
|
Std. Error t-Statistic
|
Prob.
|
|
LL1(-1)
|
-0.008949
|
0.024290 -0.368433
|
0.7152
|
|
D(LL1(-1))
|
0.142345
|
0.182297 0.780839
|
0.4412
|
|
C
|
7.942003
|
3.980121 1.995417
|
0.0555
|
|
@TREND(1970)
|
1.403013
|
0.848709 1.653114
|
0.1091
|
|
R-squared
|
0.801714
|
Mean dependent var
|
33.48061
|
|
Adjusted R-squared
|
0.781201
|
S.D. dependent var
|
14.03044
|
|
S.E. of regression
|
6.562869
|
Akaike info criterion
|
6.713945
|
|
Sum squared resid
|
1249.066
|
Schwarz criterion
|
6.895340
|
|
Log likelihood
|
-106.7801
|
F-statistic
|
39.08435
|
|
Durbin-Watson stat
|
2.007209
|
Prob(F-statistic)
|
0.000000
|
|
En Différence Première
|
|
|
|
ADF Test Statistic -3.589994
|
1% Critical Value*
|
-4.2712
|
|
|
5% Critical Value
|
-3.5562
|
|
|
10% Critical Value
|
-3.2109
|
*MacKinnon critical values for rejection of hypothesis of a unit
root. Augmented Dickey-Fuller Test Equation
Dependent Variable: D(LL1,2)
Method: Least Squares
Date: 01/31/09 Time: 17:28
Sample(adjusted): 1973 2004
Included observations: 32 after adjusting endpoints
|
Variable
|
Coefficient
|
Std. Error t-Statistic
|
Prob.
|
|
D(LL1(-1))
|
-0.862467
|
0.245019 -3.519994
|
0.0015
|
|
D(LL1(-1),2)
|
-0.019675
|
0.186354 -0.105579
|
0.9167
|
|
C
|
9.880086
|
3.315551 2.979923
|
0.0059
|
|
@TREND(1970)
|
1.079930
|
0.337585 3.198984
|
0.0034
|
|
R-squared
|
0.448019
|
Mean dependent var
|
1.585937
|
|
Adjusted R-squared
|
0.388878
|
S.D. dependent var
|
8.427825
|
|
S.E. of regression
|
6.588393
|
Akaike info criterion
|
6.724965
|
|
Sum squared resid
|
1215.394
|
Schwarz criterion
|
6.908182
|
|
Log likelihood
|
-103.5994
|
F-statistic
|
7.575454
|
|
Durbin-Watson stat
|
2.024481
|
Prob(F-statistic)
|
0.000735
|
|
Test en niveau LC1
|
|
|
|
ADF Test Statistic -1.385535
|
1% Critical Value*
|
-4.2605
|
|
|
5% Critical Value
|
-3.5514
|
|
|
10% Critical Value
|
-3.2081
|
*MacKinnon critical values for rejection of hypothesis of a unit
root.
Augmented Dickey-Fuller Test Equation
Dependent Variable: D(LC1)
Method: Least Squares
Date: 01/31/09 Time: 17:31
Sample(adjusted): 1972 2004
Included observations: 33 after adjusting endpoints
|
Variable
|
Coefficient
|
Std. Error t-Statistic
|
Prob.
|
|
LC1(-1)
|
-0.134922
|
0.097379 -1.385535
|
0.1765
|
|
D(LC1(-1))
|
-0.004368
|
0.187722 -0.023270
|
0.9816
|
|
C
|
12.27152
|
5.512383 2.226174
|
0.0339
|
|
@TREND(1970)
|
0.110237
|
0.263161 0.418897
|
0.6784
|
|
R-squared
|
0.118695
|
Mean dependent var
|
2.093939
|
|
Adjusted R-squared
|
0.027526
|
S.D. dependent var
|
7.586746
|
|
S.E. of regression
|
7.481601
|
Akaike info criterion
|
6.975983
|
|
Sum squared resid
|
1623.256
|
Schwarz criterion
|
7.157378
|
|
Log likelihood
|
-111.1037
|
F-statistic
|
1.301922
|
|
Durbin-Watson stat
|
2.015896
|
Prob(F-statistic)
|
0.292632
|
|
En Différence Première
|
|
|
|
ADF Test Statistic -4.388598
|
1% Critical Value*
|
-4.2712
|
|
|
5% Critical Value
|
-3.5562
|
|
|
10% Critical Value
|
-3.2109
|
*MacKinnon critical values for rejection of hypothesis of a unit
root.
Augmented Dickey-Fuller Test Equation Dependent Variable:
D(LC1,2)
Method: Least Squares
Date: 01/31/09 Time: 17:32
Sample(adjusted): 1973 2004
Included observations: 32 after adjusting endpoints
|
Variable
|
Coefficient
|
Std. Error t-Statistic
|
Prob.
|
|
D(LC1(-1))
|
-1.216374
|
0.277167 -4.388598
|
0.0001
|
|
D(LC1(-1),2)
|
0.118951
|
0.187897 0.633067
|
0.5318
|
|
C
|
7.098303
|
3.481207 2.039035
|
0.0510
|
|
@TREND(1970)
|
-0.245946
|
0.159366 -1.543282
|
0.1340
|
|
R-squared
|
0.549361
|
Mean dependent var
|
0.028125
|
|
Adjusted R-squared
|
0.501079
|
S.D. dependent var
|
11.01076
|
|
S.E. of regression
|
7.777383
|
Akaike info criterion
|
7.056785
|
|
Sum squared resid
|
1693.655
|
Schwarz criterion
|
7.240002
|
|
Log likelihood
|
-108.9086
|
F-statistic
|
11.37802
|
|
Durbin-Watson stat
|
2.032879
|
Prob(F-statistic)
|
0.000047
|
|
Test en niveau LD1
|
|
|
|
ADF Test Statistic -1.205804
|
1% Critical Value*
|
-4.2605
|
|
|
5% Critical Value
|
-3.5514
|
|
|
10% Critical Value
|
-3.2081
|
*MacKinnon critical values for rejection of hypothesis of a unit
root.
Augmented Dickey-Fuller Test Equation
Dependent Variable: D(LD1) Method: Least Squares
Date: 01/31/09 Time: 17:33 Sample(adjusted): 1972 2004
Included observations: 33 after adjusting endpoints
|
Variable
|
Coefficient
|
Std. Error t-Statistic
|
Prob.
|
|
LD1(-1)
|
-0.100863
|
0.083648 -1.205804
|
0.2376
|
|
D(LD1(-1))
|
0.004461
|
0.187048 0.023848
|
0.9811
|
|
C
|
41.88263
|
18.57762 2.254466
|
0.0319
|
|
@TREND(1970)
|
0.142413
|
0.962529 0.147957
|
0.8834
|
|
R-squared
|
0.117384
|
Mean dependent var
|
8.766667
|
|
Adjusted R-squared
|
0.026079
|
S.D. dependent var
|
28.49537
|
|
S.E. of regression
|
28.12135
|
Akaike info criterion
|
9.624148
|
|
Sum squared resid
|
22933.50
|
Schwarz criterion
|
9.805542
|
|
Log likelihood
|
-154.7984
|
F-statistic
|
1.285625
|
|
Durbin-Watson stat
|
2.015066
|
Prob(F-statistic)
|
0.297914
|
|
En Différence Première
|
|
|
|
ADF Test Statistic -4.195187
|
1% Critical Value*
|
-4.2712
|
|
|
5% Critical Value
|
-3.5562
|
|
|
10% Critical Value
|
-3.2109
|
*MacKinnon critical values for rejection of hypothesis of a unit
root.
Augmented Dickey-Fuller Test Equation Dependent Variable:
D(LD1,2)
Method: Least Squares
|
Date: 01/31/09 Time: 17:35
Sample(adjusted): 1973 2004
Included observations: 32 after adjusting endpoints
|
|
|
Variable
|
Coefficient
|
Std. Error t-Statistic
|
Prob.
|
|
D(LD1(-1))
|
-1.148938
|
0.273871 -4.195187
|
0.0002
|
|
D(LD1(-1),2)
|
0.083708
|
0.188148 0.444906
|
0.6598
|
|
C
|
28.36144
|
13.34173 2.125770
|
0.0425
|
|
@TREND(1970)
|
-0.987474
|
0.603956 -1.635009
|
0.1132
|
|
R-squared
|
0.533863
|
Mean dependent var
|
-0.025000
|
|
Adjusted R-squared
|
0.483920
|
S.D. dependent var
|
40.50511
|
|
S.E. of regression
|
29.09835
|
Akaike info criterion
|
9.695708
|
|
Sum squared resid
|
23707.99
|
Schwarz criterion
|
9.878925
|
|
Log likelihood
|
-151.1313
|
F-statistic
|
10.68940
|
|
Durbin-Watson stat
|
2.017042
|
Prob(F-statistic)
|
0.000074
|
|
Test en niveau LI1
|
|
|
|
ADF Test Statistic -1.675700
|
1% Critical Value*
|
-4.2605
|
|
|
5% Critical Value
|
-3.5514
|
|
|
10% Critical Value
|
-3.2081
|
*MacKinnon critical values for rejection of hypothesis of a unit
root.
Augmented Dickey-Fuller Test Equation
Dependent Variable: D(LI1)
Method: Least Squares
Date: 01/31/09 Time: 17:37
Sample(adjusted): 1972 2004
Included observations: 33 after adjusting endpoints
|
Variable
|
Coefficient
|
Std. Error t-Statistic
|
Prob.
|
|
LI1(-1)
|
-0.309553
|
0.184731 -1.675700
|
0.1045
|
|
D(LI1(-1))
|
-0.121786
|
0.200209 -0.608297
|
0.5477
|
|
C
|
388.2784
|
539.9711 0.719072
|
0.4779
|
|
@TREND(1970)
|
19.24918
|
36.49316 0.527474
|
0.6019
|
|
R-squared
|
0.181352
|
Mean dependent var
|
25.39394
|
|
Adjusted R-squared
|
0.096664
|
S.D. dependent var
|
1514.190
|
|
S.E. of regression
|
1439.147
|
Akaike info criterion
|
17.49470
|
|
Sum squared resid
|
60063147
|
Schwarz criterion
|
17.67610
|
|
Log likelihood
|
-284.6626
|
F-statistic
|
2.141414
|
|
Durbin-Watson stat
|
1.985292
|
Prob(F-statistic)
|
0.116584
|
|
En Différence Première
|
|
|
|
ADF Test Statistic -4.853837
|
1% Critical Value*
|
-4.2712
|
|
|
5% Critical Value
|
-3.5562
|
|
|
10% Critical Value
|
-3.2109
|
*MacKinnon critical values for rejection of hypothesis of a unit
root.
Augmented Dickey-Fuller Test Equation Dependent Variable:
D(LI1,2)
Method: Least Squares
Date: 01/31/09 Time: 17:38
Sample(adjusted): 1973 2004
Included observations: 32 after adjusting endpoints
|
Variable
|
Coefficient
|
Std. Error t-Statistic
|
Prob.
|
|
D(LI1(-1))
|
-1.470098
|
0.302873 -4.853837
|
0.0000
|
|
D(LI1(-1),2)
|
0.128508
|
0.187626 0.684916
|
0.4990
|
|
C
|
554.6303
|
612.9929 0.904791
|
0.3733
|
|
@TREND(1970)
|
-28.06257
|
29.70124 -0.944828
|
0.3528
|
|
R-squared
|
0.656903
|
Mean dependent var
|
-0.412500
|
|
Adjusted R-squared
|
0.620142
|
S.D. dependent var
|
2466.083
|
|
S.E. of regression
|
1519.911
|
Akaike info criterion
|
17.60716
|
|
Sum squared resid
|
64683649
|
Schwarz criterion
|
17.79038
|
|
Log likelihood
|
-277.7146
|
F-statistic
|
17.86982
|
|
Durbin-Watson stat
|
2.023657
|
Prob(F-statistic)
|
0.000001
|
|
Test en niveau LV1
|
|
|
|
ADF Test Statistic -1.473408
|
1% Critical Value*
|
-4.2605
|
|
|
5% Critical Value
|
-3.5514
|
|
|
10% Critical Value
|
-3.2081
|
*MacKinnon critical values for rejection of hypothesis of a unit
root.
Augmented Dickey-Fuller Test Equation
Dependent Variable: D(LV1) Method: Least Squares
Date: 01/31/09 Time: 17:39 Sample(adjusted): 1972 2004
Included observations: 33 after adjusting endpoints
|
Variable
|
Coefficient
|
Std. Error t-Statistic
|
Prob.
|
|
LV1(-1)
|
-0.198246
|
0.134549 -1.473408
|
0.1514
|
|
D(LV1(-1))
|
0.077681
|
0.197653 0.393017
|
0.6972
|
|
C
|
245.7904
|
187.6859 1.309584
|
0.2006
|
|
@TREND(1970)
|
17.01945
|
19.01135 0.895225
|
0.3780
|
|
R-squared
|
0.090744
|
Mean dependent var
|
74.53333
|
|
Adjusted R-squared
|
-0.003317
|
S.D. dependent var
|
490.8794
|
|
S.E. of regression
|
491.6929
|
Akaike info criterion
|
15.34680
|
|
Sum squared resid
|
7011094.
|
Schwarz criterion
|
15.52819
|
|
Log likelihood
|
-249.2222
|
F-statistic
|
0.964738
|
|
Durbin-Watson stat
|
2.012056
|
Prob(F-statistic)
|
0.422636
|
|
En Différence Première
|
|
|
|
ADF Test Statistic -3.911694
|
1% Critical Value*
|
-4.2712
|
|
|
5% Critical Value
|
-3.5562
|
|
|
10% Critical Value
|
-3.2109
|
*MacKinnon critical values for rejection of hypothesis of a unit
root.
Augmented Dickey-Fuller Test Equation Dependent Variable:
D(LV1,2)
Method: Least Squares
Date: 01/31/09 Time: 17:41
Sample(adjusted): 1973 2004
Included observations: 32 after adjusting endpoints
|
Variable
|
Coefficient
|
Std. Error t-Statistic
|
Prob.
|
|
D(LV1(-1))
|
-1.068063
|
0.273044 -3.911694
|
0.0005
|
|
D(LV1(-1),2)
|
0.018700
|
0.188621 0.099142
|
0.9217
|
|
C
|
235.5522
|
213.1995 1.104844
|
0.2786
|
|
@TREND(1970)
|
-8.433431
|
10.11882 -0.833440
|
0.4117
|
|
R-squared
|
0.524782
|
Mean dependent var
|
-2.503125
|
|
Adjusted R-squared
|
0.473866
|
S.D. dependent var
|
714.4091
|
|
S.E. of regression
|
518.1975
|
Akaike info criterion
|
15.45506
|
|
Sum squared resid
|
7518802.
|
Schwarz criterion
|
15.63828
|
|
Log likelihood
|
-243.2809
|
F-statistic
|
10.30677
|
|
Durbin-Watson stat
|
2.003172
|
Prob(F-statistic)
|
0.000097
|
|
Test en niveau LH1
|
|
|
|
ADF Test Statistic 0.232643
|
1% Critical Value*
|
-4.2605
|
|
|
5% Critical Value
|
-3.5514
|
|
|
10% Critical Value
|
-3.2081
|
*MacKinnon critical values for rejection of hypothesis of a unit
root.
Augmented Dickey-Fuller Test Equation
Dependent Variable: D(LH1) Method: Least Squares
Date: 01/31/09 Time: 17:42 Sample(adjusted): 1972 2004
Included observations: 33 after adjusting endpoints
|
Variable
|
Coefficient
|
Std. Error t-Statistic
|
Prob.
|
|
LH1(-1)
|
0.009822
|
0.042220 0.232643
|
0.8177
|
|
D(LH1(-1))
|
0.457047
|
0.183905 2.485230
|
0.0190
|
|
C
|
-8.727067
|
19.59044 -0.445476
|
0.6593
|
|
@TREND(1970)
|
2.006774
|
2.119978 0.946601
|
0.3517
|
|
R-squared
|
0.626330
|
Mean dependent var
|
55.14333
|
|
Adjusted R-squared
|
0.587675
|
S.D. dependent var
|
55.03372
|
|
S.E. of regression
|
35.33855
|
Akaike info criterion
|
10.08104
|
|
Sum squared resid
|
36215.59
|
Schwarz criterion
|
10.26243
|
|
Log likelihood
|
-162.3371
|
F-statistic
|
16.20288
|
|
Durbin-Watson stat
|
1.900065
|
Prob(F-statistic)
|
0.000002
|
|
En Différence Première
|
|
|
|
ADF Test Statistic -3.855490
|
1% Critical Value*
|
-4.2712
|
|
|
5% Critical Value
|
-3.5562
|
|
|
10% Critical Value
|
-3.2109
|
*MacKinnon critical values for rejection of hypothesis of a unit
root.
Augmented Dickey-Fuller Test Equation
Dependent Variable: D(LH1,2)
Method: Least Squares
Date: 01/31/09 Time: 17:49
Sample(adjusted): 1973 2004
Included observations: 32 after adjusting endpoints
LY1 LL1 LC1 LD1 LI1
LY1(-1) 0.789156 0.221885 0.467481 14.61628 0.719118
(0.39209) (0.81436) (1.99295) (12.1998) (3.79751)
(2.01270) (0.27246) (0.23457) (1.19808) (0.18937)
LL1(-1) -1.443669 -1.357253 -5.813946 26.94642 -8.756328
(0.38402) (0.79760) (1.95194) (11.9487) (3.71936)
(-3.75936) (-1.70167) (-2.97855) (2.25517) (-2.35426)
|
LV1
|
LH1
|
|
45.76870
|
3.966643
|
|
(59.1796)
|
(2.31994)
|
|
(0.77339)
|
(1.70980)
|
|
137.5571
|
-2.330918
|
|
(57.9618)
|
(2.27220)
|
|
(2.37324)
|
(-1.02584)
|
|
Variable
|
Coefficient
|
Std. Error t-Statistic
|
Prob.
|
|
D(LH1(-1))
|
-1.049021
|
0.272085 -3.855490
|
0.0006
|
|
D(LH1(-1),2)
|
0.015051
|
0.189173 0.079564
|
0.9371
|
|
C
|
175.5644
|
149.9251 1.171014
|
0.2515
|
|
@TREND(1970)
|
-7.019125
|
7.137056 -0.983476
|
0.3338
|
|
R-squared
|
0.516330
|
Mean dependent var
|
-0.656250
|
|
Adjusted R-squared
|
0.464508
|
S.D. dependent var
|
491.4087
|
|
S.E. of regression
|
359.5996
|
Akaike info criterion
|
14.72433
|
|
Sum squared resid
|
3620733.
|
Schwarz criterion
|
14.90755
|
|
Log likelihood
|
-231.5893
|
F-statistic
|
9.963572
|
|
Durbin-Watson stat
|
1.997958
|
Prob(F-statistic)
|
0.000123
|
|
Stationnarité des Résidus
|
|
|
ADF Test Statistic -2.787108
|
1% Critical Value*
|
-2.6344
|
|
|
5% Critical Value
|
-1.9514
|
|
|
10% Critical Value
|
-1.6211
|
*MacKinnon critical values for rejection of hypothesis of a unit
root.
Augmented Dickey-Fuller Test Equation
Dependent Variable: D(RESID01)
Method: Least Squares
Date: 02/04/09 Time: 22:57
Sample(adjusted): 1972 2004
Included observations: 33 after adjusting endpoints
|
Variable
|
Coefficient
|
Std. Error t-Statistic
|
Prob.
|
|
RESID01(-1)
|
-0.613236
|
0.220026 -2.787108
|
0.0090
|
|
D(RESID01(-1))
|
-0.156247
|
0.193450 -0.807687
|
0.4254
|
|
R-squared
|
0.344826
|
Mean dependent var
|
1.95E-11
|
|
Adjusted R-squared
|
0.323692
|
S.D. dependent var
|
5.68E-10
|
|
S.E. of regression
|
4.67E-10
|
Akaike info criterion
|
-40.07093
|
|
Sum squared resid
|
6.77E-18
|
Schwarz criterion
|
-39.98023
|
|
Log likelihood
|
663.1703
|
Durbin-Watson stat
|
1.833330
|
Nombre optimal de retard Q=1
Date: 02/01/09 Time: 18:42
Sample(adjusted): 1971 2004
Included observations: 34 after adjusting endpoints Standard
errors & t-statistics in parentheses
|
LC1(-1) 0.555657
|
0.756198
|
2.884456
|
-12.51171
|
3.359137
|
-53.12095
|
-0.368271
|
|
(0.20572)
|
(0.42728)
|
(1.04566)
|
(6.40099)
|
(1.99248)
|
(31.0504)
|
(1.21723)
|
|
(2.70101)
|
(1.76980)
|
(2.75850)
|
(-1.95465)
|
(1.68591)
|
(-1.71080)
|
(-0.30255)
|
|
LD1(-1) 0.010509
|
0.010865
|
0.044544
|
0.818880
|
-0.075068
|
6.828004
|
-0.059750
|
|
(0.00438)
|
(0.00911)
|
(0.02229)
|
(0.13643)
|
(0.04247)
|
(0.66180)
|
(0.02594)
|
|
(2.39677)
|
(1.19306)
|
(1.99868)
|
(6.00228)
|
(-1.76768)
|
(10.3174)
|
(-2.30308)
|
|
LI1(-1) -0.018501
|
-0.032962
|
-0.091962
|
0.138215
|
0.815653
|
-3.711244
|
0.125323
|
|
(0.00989)
|
(0.02055)
|
(0.05029)
|
(0.30783)
|
(0.09582)
|
(1.49325)
|
(0.05854)
|
|
(-1.87007)
|
(-1.60412)
|
(-1.82873)
|
(0.44900)
|
(8.51230)
|
(-2.48535)
|
(2.14088)
|
|
LV1(-1) -0.002788
|
-0.003678
|
-0.011752
|
0.009393
|
-0.024062
|
-0.058508
|
0.004722
|
|
(0.00068)
|
(0.00142)
|
(0.00348)
|
(0.02129)
|
(0.00663)
|
(0.10330)
|
(0.00405)
|
|
(-4.07337)
|
(-2.58729)
|
(-3.37818)
|
(0.44108)
|
(-3.63000)
|
(-0.56639)
|
(1.16613)
|
|
LH1(-1) 0.021146
|
0.048898
|
0.120749
|
-0.111164
|
0.610032
|
-0.378836
|
0.846917
|
|
(0.02000)
|
(0.04153)
|
(0.10164)
|
(0.62217)
|
(0.19367)
|
(3.01806)
|
(0.11831)
|
|
(1.05754)
|
(1.17738)
|
(1.18804)
|
(-0.17867)
|
(3.14992)
|
(-0.12552)
|
(7.15827)
|
|
C -37.92026
|
-53.25763
|
-129.0867
|
945.7084
|
-198.4155
|
2781.043
|
-28.08353
|
|
(15.0029)
|
(31.1607)
|
(76.2582)
|
(466.812)
|
(145.308)
|
(2264.45)
|
(88.7704)
|
|
(-2.52753)
|
(-1.70913)
|
(-1.69276)
|
(2.02589)
|
(-1.36548)
|
(1.22813)
|
(-0.31636)
|
|
R-squared 0.983964
|
0.947299
|
0.966736
|
0.969873
|
0.998650
|
0.917305
|
0.997167
|
|
Adj. R-squared 0.979646
|
0.933110
|
0.957780
|
0.961762
|
0.998286
|
0.895041
|
0.996404
|
|
Sum sq. resids 484.7825
|
2091.281
|
12524.78
|
469334.0
|
45475.29
|
11043900
|
16972.03
|
|
S.E. equation 4.318041
|
8.968494
|
21.94818
|
134.3551
|
41.82164
|
651.7403
|
25.54937
|
|
F-statistic 227.9033
|
66.76429
|
107.9462
|
119.5729
|
2746.967
|
41.20140
|
1307.237
|
|
Log likelihood -93.41869
|
-118.2698
|
-148.6987
|
-210.3000
|
-170.6195
|
-263.9914
|
-153.8642
|
|
Akaike AIC 5.965805
|
7.427637
|
9.217569
|
12.84117
|
10.50703
|
15.99949
|
9.521426
|
|
Schwarz SC 6.324949
|
7.786780
|
9.576713
|
13.20032
|
10.86617
|
16.35864
|
9.880570
|
|
Mean dependent 85.18235
|
87.51471
|
356.4265
|
1289.097
|
1631.450
|
2247.682
|
444.1676
|
|
S.D. dependent 30.26667
|
34.67689
|
106.8170
|
687.0767
|
1010.214
|
2011.711
|
426.0549
|
|
Determinant Residual
|
4.05E+16
|
|
|
|
|
|
|
Covariance
|
|
|
|
|
|
|
|
Log Likelihood
|
-987.7931
|
|
|
|
|
|
|
Akaike Information Criteria
|
61.39959
|
|
|
|
|
|
|
Schwarz Criteria
|
63.91360
|
|
|
|
|
|
Q=2
Date: 02/01/09 Time: 18:44
Sample(adjusted): 1972 2004
Included observations: 33 after adjusting endpoints Standard
errors & t-statistics in parentheses
LY1 LL1 LC1 LD1 LI1 LV1 LH1
LY1(-1) 0.913838 -1.630209 -2.193834 -12.69141 8.356108 -41.56414
3.332516
(2.08576) (4.28587) (10.5963) (55.6020) (17.9949) (194.755)
(11.9564)
(0.43813) (-0.38037) (-0.20704) (-0.22825) (0.46436) (-0.21342)
(0.27872)
LY1(-2) 0.077761 1.854241 3.031097 42.09998 -2.868094 28.21537
2.137697
(1.79911) (3.69685) (9.14003) (47.9604) (15.5218) (167.989)
(10.3132)
(0.04322) (0.50157) (0.33163) (0.87781) (-0.18478) (0.16796)
(0.20728)
LL1(-1) -0.928024 -0.652049 -3.816553 72.08520 -12.25157
-135.1702 -1.755943
(1.58152) (3.24974) (8.03462) (42.1599) (13.6446) (147.672)
(9.06588)
|
(-0.58679)
|
(-0.20065)
|
(-0.47501)
|
(1.70980)
|
(-0.89791)
|
(-0.91534)
|
(-0.19369)
|
|
LL1(-2)
|
-0.850227
|
-2.327244
|
-5.335681
|
-20.08738
|
7.321730
|
105.0177
|
1.195592
|
|
(1.45528)
|
(2.99035)
|
(7.39330)
|
(38.7947)
|
(12.5555)
|
(135.885)
|
(8.34225)
|
|
(-0.58423)
|
(-0.77825)
|
(-0.72169)
|
(-0.51779)
|
(0.58315)
|
(0.77284)
|
(0.14332)
|
|
LC1(-1)
|
0.276468
|
0.718781
|
2.338361
|
-26.64799
|
3.902014
|
82.14110
|
-0.130678
|
|
(1.00041)
|
(2.05565)
|
(5.08237)
|
(26.6686)
|
(8.63099)
|
(93.4112)
|
(5.73470)
|
|
(0.27636)
|
(0.34966)
|
(0.46009)
|
(-0.99923)
|
(0.45209)
|
(0.87935)
|
(-0.02279)
|
|
LC1(-2)
|
0.391333
|
0.684291
|
1.820541
|
3.277858
|
-3.300162
|
-72.24742
|
-1.346854
|
|
(0.85800)
|
(1.76304)
|
(4.35893)
|
(22.8725)
|
(7.40243)
|
(80.1147)
|
(4.91840)
|
|
(0.45610)
|
(0.38813)
|
(0.41766)
|
(0.14331)
|
(-0.44582)
|
(-0.90180)
|
(-0.27384)
|
|
LD1(-1)
|
0.008612
|
0.011068
|
0.045559
|
0.021894
|
-0.082956
|
11.15087
|
-0.091627
|
|
(0.01058)
|
(0.02174)
|
(0.05376)
|
(0.28207)
|
(0.09129)
|
(0.98800)
|
(0.06066)
|
|
(0.81390)
|
(0.50907)
|
(0.84752)
|
(0.07762)
|
(-0.90871)
|
(11.2863)
|
(-1.51061)
|
|
LD1(-2)
|
0.017779
|
0.025568
|
0.062042
|
2.181817
|
-0.046157
|
-11.55113
|
0.058055
|
|
(0.02445)
|
(0.05023)
|
(0.12420)
|
(0.65170)
|
(0.21092)
|
(2.28269)
|
(0.14014)
|
|
(0.72726)
|
(0.50899)
|
(0.49954)
|
(3.34788)
|
(-0.21884)
|
(-5.06032)
|
(0.41427)
|
|
LI1(-1)
|
-0.043954
|
-0.075647
|
-0.205856
|
-0.345201
|
0.937621
|
0.849773
|
0.053844
|
|
(0.02503)
|
(0.05144)
|
(0.12718)
|
(0.66735)
|
(0.21598)
|
(2.33752)
|
(0.14350)
|
|
(-1.75575)
|
(-1.47058)
|
(-1.61861)
|
(-0.51727)
|
(4.34121)
|
(0.36354)
|
(0.37520)
|
|
LI1(-2)
|
-0.007047
|
-0.017132
|
-0.035767
|
-0.409239
|
0.031044
|
0.683291
|
0.166546
|
|
(0.02308)
|
(0.04742)
|
(0.11724)
|
(0.61521)
|
(0.19911)
|
(2.15488)
|
(0.13229)
|
|
(-0.30535)
|
(-0.36127)
|
(-0.30506)
|
(-0.66520)
|
(0.15592)
|
(0.31709)
|
(1.25892)
|
|
LV1(-1)
|
-0.003749
|
-0.004632
|
-0.014083
|
-0.153050
|
-0.032759
|
0.820692
|
-0.003798
|
|
(0.00252)
|
(0.00518)
|
(0.01280)
|
(0.06716)
|
(0.02174)
|
(0.23524)
|
(0.01444)
|
|
(-1.48804)
|
(-0.89476)
|
(-1.10035)
|
(-2.27889)
|
(-1.50718)
|
(3.48876)
|
(-0.26296)
|
|
LV1(-2)
|
-0.002974
|
-0.006338
|
-0.015318
|
-0.074869
|
0.025453
|
0.360269
|
0.004800
|
|
(0.00153)
|
(0.00314)
|
(0.00777)
|
(0.04077)
|
(0.01320)
|
(0.14281)
|
(0.00877)
|
|
(-1.94447)
|
(-2.01672)
|
(-1.97131)
|
(-1.83625)
|
(1.92892)
|
(2.52267)
|
(0.54747)
|
|
LH1(-1)
|
0.017946
|
0.024955
|
0.076244
|
-0.279083
|
-0.136284
|
-2.386292
|
0.698342
|
|
(0.04208)
|
(0.08646)
|
(0.21377)
|
(1.12174)
|
(0.36304)
|
(3.92906)
|
(0.24121)
|
|
(0.42647)
|
(0.28861)
|
(0.35665)
|
(-0.24880)
|
(-0.37540)
|
(-0.60734)
|
(2.89513)
|
|
LH1(-2)
|
0.053845
|
0.116839
|
0.283545
|
0.243400
|
0.522562
|
-0.159126
|
-0.065144
|
|
(0.03737)
|
(0.07679)
|
(0.18986)
|
(0.99627)
|
(0.32243)
|
(3.48958)
|
(0.21423)
|
|
(1.44076)
|
(1.52147)
|
(1.49342)
|
(0.24431)
|
(1.62070)
|
(-0.04560)
|
(-0.30408)
|
|
C
|
-43.50496
|
-94.57336
|
-207.6369
|
1689.849
|
-69.24280
|
-1823.785
|
13.29672
|
|
(26.9050)
|
(55.2849)
|
(136.686)
|
(717.229)
|
(232.123)
|
(2512.21)
|
(154.230)
|
|
(-1.61698)
|
(-1.71065)
|
(-1.51908)
|
(2.35608)
|
(-0.29830)
|
(-0.72597)
|
(0.08621)
|
|
R-squared
|
0.987620
|
0.960267
|
0.974094
|
0.983947
|
0.999233
|
0.977749
|
0.998127
|
|
Adj. R-squared
|
0.977991
|
0.929364
|
0.953945
|
0.971461
|
0.998636
|
0.960443
|
0.996669
|
|
Sum sq. resids
|
330.7812
|
1396.655
|
8537.317
|
235066.4
|
24621.28
|
2883943.
|
10869.53
|
|
S.E. equation
|
4.286809
|
8.808629
|
21.77832
|
114.2771
|
36.98444
|
400.2737
|
24.57362
|
|
F-statistic
|
102.5667
|
31.07328
|
48.34435
|
78.80387
|
1674.036
|
56.49670
|
685.0114
|
|
Log likelihood
|
-84.85664
|
-108.6229
|
-138.4939
|
-193.1984
|
-155.9701
|
-234.5646
|
-142.4790
|
|
Akaike AIC
|
6.051918
|
7.492296
|
9.302662
|
12.61808
|
10.36183
|
15.12513
|
9.544179
|
|
Schwarz SC
|
6.732148
|
8.172526
|
9.982893
|
13.29831
|
11.04206
|
15.80536
|
10.22441
|
|
Mean dependent
|
86.95152
|
89.52424
|
362.8970
|
1317.976
|
1669.158
|
2306.945
|
457.1203
|
|
S.D. dependent
|
28.89559
|
33.14323
|
101.4813
|
676.4506
|
1001.284
|
2012.537
|
425.8085
|
|
Determinant Residual
|
4.05E+14
|
|
|
|
|
|
Covariance
Log Likelihood -882.7334
Akaike Information Criteria 53.38872
Schwarz Criteria 60.44257
Q=3
Date: 02/01/09 Time: 18:45
Sample(adjusted): 1973 2004
Included observations: 32 after adjusting endpoints Standard
errors & t-statistics in parentheses
LY1 LL1 LC1 LD1 LI1 LV1 LH1
LY1(-1) -0.799434 -3.630197 -8.283425 24.11953 15.11625 -123.7206
8.354567
(2.64445) (5.08428) (12.9372) (63.8412) (15.8513) (215.806)
(13.3906)
(-0.30231) (-0.71400) (-0.64028) (0.37781) (0.95363) (-0.57330)
(0.62391)
LY1(-2) -1.792642 -4.177081 -9.908928 125.0923 18.76423 -315.1959
-17.82704
(3.33054) (6.40337) (16.2937) (80.4043) (19.9638) (271.795)
(16.8646)
(-0.53824) (-0.65233) (-0.60814) (1.55579) (0.93991) (-1.15968)
(-1.05707)
LY1(-3) 3.159896 7.134746 17.24718 -99.36813 -29.34967 415.4750
14.47576
(2.02468) (3.89269) (9.90515) (48.8788) (12.1362) (165.228)
(10.2522)
(1.56069) (1.83286) (1.74123) (-2.03295) (-2.41835) (2.51456)
(1.41196)
LL1(-1) -1.647734 -2.186819 -7.699288 79.47685 -12.26726
-170.8321 -10.69164
(1.60472) (3.08526) (7.85062) (38.7403) (9.61892) (130.956)
(8.12571)
(-1.02681) (-0.70879) (-0.98072) (2.05153) (-1.27533) (-1.30450)
(-1.31578)
LL1(-2) -0.990027 -3.214814 -5.851639 0.968251 -2.811784 131.7574
9.216998
(2.26064) (4.34636) (11.0595) (54.5753) (13.5506) (184.484)
(11.4471)
(-0.43794) (-0.73966) (-0.52910) (0.01774) (-0.20750) (0.71419)
(0.80518)
LL1(-3) 0.351572 0.782715 0.958173 -25.98542 3.495470 -12.70602
-2.638364
(1.51881) (2.92009) (7.43032) (36.6663) (9.10395) (123.945)
(7.69068)
(0.23148) (0.26804) (0.12895) (-0.70870) (0.38395) (-0.10251)
(-0.34306)
LC1(-1) 0.820212 1.578241 4.692385 -35.19632 3.140050 100.9792
2.620612
(1.04140) (2.00221) (5.09473) (25.1409) (6.24228) (84.9852)
(5.27325)
(0.78761) (0.78825) (0.92103) (-1.39996) (0.50303) (1.18820)
(0.49696)
LC1(-2) 0.781179 2.172210 4.441562 -19.55906 -2.587554 -16.20735
-0.380550
(1.39580) (2.68360) (6.82857) (33.6969) (8.36666) (113.907)
(7.06785)
(0.55966) (0.80944) (0.65044) (-0.58044) (-0.30927) (-0.14229)
(-0.05384)
LC1(-3) -0.562194 -1.401859 -2.931816 22.63674 1.755221 -52.40406
-2.689552
(0.89494) (1.72064) (4.37825) (21.6053) (5.36443) (73.0337)
(4.53167)
(-0.62819) (-0.81473) (-0.66963) (1.04774) (0.32720) (-0.71753)
(-0.59350)
LD1(-1) -0.008746 -0.019285 -0.038999 0.322787 0.064007 9.094339
-0.121631
(0.01495) (0.02875) (0.07315) (0.36097) (0.08963) (1.22021)
(0.07571)
(-0.58492) (-0.67085) (-0.53313) (0.89422) (0.71416) (7.45308)
(-1.60647)
LD1(-2) 0.005249 0.014601 0.033863 3.249835 0.364282 -11.09972
0.237531
(0.03444) (0.06622) (0.16849) (0.83147) (0.20645) (2.81065)
(0.17440)
(0.15241) (0.22049) (0.20098) (3.90856) (1.76453) (-3.94917)
(1.36201)
LD1(-3) 0.075861 0.109030 0.311130 -2.927112 -1.136003 8.599341
-0.258010
(0.06233) (0.11985) (0.30495) (1.50485) (0.37364) (5.08694)
(0.31564)
(1.21700) (0.90975) (1.02025) (-1.94512) (-3.04034) (1.69047)
(-0.81742)
LI1(-1) 0.012642 0.025739 0.058746 -1.095061 0.682587 4.548384
0.153658
(0.04107) (0.07897) (0.20093) (0.99154) (0.24619) (3.35177)
(0.20797)
(0.30779) (0.32595) (0.29237) (-1.10440) (2.77258) (1.35701)
(0.73883)
LI1(-2) -0.108085 -0.211008 -0.530559 -0.164971 0.074455
-4.346295 0.120089
(0.05339) (0.10265) (0.26121) (1.28897) (0.32004) (4.35717)
(0.27036)
(-2.02437) (-2.05555) (-2.03120) (-0.12799) (0.23264) (-0.99750)
(0.44418)
LI1(-3) 0.013697 0.046416 0.092228 1.565890 0.654318 -5.754602
0.197511
(0.02717) (0.05225) (0.13294) (0.65604) (0.16289) (2.21765)
(0.13760)
(0.50402) (0.88840) (0.69373) (2.38688) (4.01694) (-2.59491)
(1.43537)
LV1(-1) -0.003154 -0.004491 -0.013738 -0.211693 -0.059043
0.741015 -0.025048
(0.00326) (0.00626) (0.01593) (0.07862) (0.01952) (0.26575)
(0.01649)
(-0.96864) (-0.71732) (-0.86233) (-2.69277) (-3.02480) (2.78841)
(-1.51902)
LV1(-2) -0.008850 -0.014706 -0.038568 0.178667 0.112002 -0.333731
0.040387
(0.00585) (0.01124) (0.02860) (0.14115) (0.03505) (0.47713)
(0.02961)
(-1.51374) (-1.30821) (-1.34838) (1.26581) (3.19585) (-0.69945)
(1.36417)
LV1(-3) -0.004630 -0.008084 -0.022178 0.068971 0.030148 -0.488203
0.000927
(0.00290) (0.00558) (0.01419) (0.07003) (0.01739) (0.23674)
(0.01469)
(-1.59591) (-1.44948) (-1.56268) (0.98484) (1.73376) (-2.06220)
(0.06309)
LH1(-1) -0.019424 -0.035011 -0.087056 -0.239999 -0.118951
0.135563 0.490284
(0.05762) (0.11077) (0.28187) (1.39095) (0.34536) (4.70192)
(0.29175)
(-0.33713) (-0.31605) (-0.30885) (-0.17254) (-0.34442) (0.02883)
(1.68049)
LH1(-2) 0.079116 0.138564 0.357571 0.645125 0.671919 -3.656440
-0.078764
(0.06212) (0.11943) (0.30390) (1.49967) (0.37236) (5.06942)
(0.31455)
(1.27360) (1.16018) (1.17659) (0.43018) (1.80451) (-0.72127)
(-0.25040)
LH1(-3) 0.008580 0.032720 0.082264 -0.177656 -0.170403 4.970051
-0.164169
(0.05946) (0.11432) (0.29090) (1.43549) (0.35642) (4.85249)
(0.30109)
(0.14430) (0.28621) (0.28279) (-0.12376) (-0.47809) (1.02423)
(-0.54525)
C -73.89154 -171.8166 -375.9236 2359.007 -219.6893 -3271.800
-139.5288
(35.0080) (67.3072) (171.267) (845.147) (209.843) (2856.90)
(177.268)
(-2.11070) (-2.55272) (-2.19496) (2.79124) (-1.04692) (-1.14523)
(-0.78711)
R-squared 0.992973 0.980281 0.986219 0.993080 0.999808 0.991355
0.999254
Adj. R-squared 0.978215 0.938871 0.957279 0.978548 0.999404
0.973200 0.997687
Sum sq. resids 163.1692 603.1510 3905.248 95097.28 5862.647
1086660. 4183.730
S.E. equation 4.039420 7.766280 19.76170 97.51784 24.21290
329.6452 20.45417
F-statistic 67.28662 23.67269 34.07779 68.33655 2476.705 54.60601
637.6744
Log likelihood -71.47086 -92.38894 -122.2755 -173.3567 -128.7760
-212.3322 -123.3776
Akaike AIC 5.841929 7.149309 9.017218 12.20980 9.423498 14.64576
9.086100
Schwarz SC 6.849622 8.157002 10.02491 13.21749 10.43119 15.65345
10.09379
Mean dependent 88.77188 91.60312 369.5094 1347.178 1707.891
2367.819 470.7206
S.D. dependent 27.36803 31.41162 95.60974 665.8053 991.8695
2013.637 425.2773
Determinant Residual 2.39E+10
Covariance
Log Likelihood -700.2195
Akaike Information Criteria 59.86263
Schwarz Criteria 64.62424
Q=4
Date: 02/01/09 Time: 18:47
Sample(adjusted): 1974 2004
Included observations: 31 after adjusting endpoints Standard
errors & t-statistics in parentheses
LY1 LL1 LC1 LD1 LI1 LV1 LH1
LY1(-1) 5.344082 6.702909 20.76125 -132.4906 80.91659 199.2077
40.93642
(7.93816) (20.6256) (48.0078) (285.335) (27.7891) (367.445)
(27.2057)
(0.67321) (0.32498) (0.43246) (-0.46433) (2.91181) (0.54214)
(1.50470)
LY1(-2) -7.823182 -13.16963 -35.80192 239.5359 -22.82968
-443.7527 -24.77193
(4.16659) (10.8260) (25.1984) (149.767) (14.5860) (192.865)
(14.2797)
(-1.87760) (-1.21648) (-1.42080) (1.59939) (-1.56518) (-2.30085)
(-1.73476)
LY1(-3) 10.33632 20.37881 52.24529 -165.0990 -1.714039 405.8983
-0.970132
(6.59507) (17.1359) (39.8851) (237.058) (23.0874) (305.275)
(22.6026)
(1.56728) (1.18925) (1.30989) (-0.69645) (-0.07424) (1.32961)
(-0.04292)
LY1(-4) -3.251433 -8.441097 -20.40365 42.75031 -23.33829
-125.3120 5.446886
(8.32275) (21.6249) (50.3337) (299.159) (29.1355) (385.247)
(28.5238)
(-0.39067) (-0.39034) (-0.40537) (0.14290) (-0.80103) (-0.32528)
(0.19096)
LL1(-1) 6.719979 11.73586 31.39649 -141.2574 41.62122 83.25204
26.09970
(5.89468) (15.3161) (35.6494) (211.883) (20.6355) (272.856)
(20.2023)
(1.14001) (0.76625) (0.88070) (-0.66668) (2.01697) (0.30511)
(1.29192)
LL1(-2) -6.303110 -11.10665 -29.47978 163.1058 -42.10251
-157.2869 -22.41640
(3.87848) (10.0774) (23.4560) (139.411) (13.5774) (179.529)
(13.2923)
(-1.62515) (-1.10214) (-1.25681) (1.16996) (-3.10093) (-0.87611)
(-1.68641)
LL1(-3) 6.402472 12.11825 31.32336 -101.5073 6.164936 56.31505
1.572117
(2.99871) (7.79150) (18.1354) (107.788) (10.4976) (138.806)
(10.2772)
(2.13507) (1.55532) (1.72720) (-0.94173) (0.58727) (0.40571)
(0.15297)
LL1(-4) -4.504161 -8.803740 -22.75542 25.96988 -10.29451 19.07714
1.660076
(2.81189) (7.30609) (17.0055) (101.073) (9.84359) (130.158)
(9.63693)
(-1.60183) (-1.20499) (-1.33812) (0.25694) (-1.04581) (0.14657)
(0.17226)
LC1(-1) -3.667304 -5.860680 -16.24523 79.39529 -30.63037
-56.98395 -17.95434
(3.68974) (9.58700) (22.3145) (132.627) (12.9167) (170.792)
(12.6455)
(-0.99392) (-0.61132) (-0.72801) (0.59864) (-2.37138) (-0.33364)
(-1.41982)
LC1(-2) 3.877564 6.676494 17.91716 -102.0941 21.10439 132.3576
13.42457
(2.16730) (5.63125) (13.1072) (77.9028) (7.58705) (100.321)
(7.42776)
(1.78913) (1.18562) (1.36697) (-1.31053) (2.78163) (1.31934)
(1.80735)
LC1(-3) -4.272170 -8.333382 -21.38508 63.25802 -4.265096
-82.74989 -0.397992
(1.98081) (5.14670) (11.9794) (71.1995) (6.93421) (91.6884)
(6.78863)
(-2.15678) (-1.61917) (-1.78516) (0.88846) (-0.61508) (-0.90251)
(-0.05863)
LC1(-4) 2.572568 5.342054 13.55426 -20.09738 6.809614 4.738635
-3.633296
(2.08816) (5.42562) (12.6286) (75.0582) (7.31001) (96.6575)
(7.15654)
(1.23198) (0.98460) (1.07330) (-0.26776) (0.93155) (0.04902)
(-0.50769)
LD1(-1) 0.010206 0.018176 0.060057 -0.817185 0.263556 10.55862
0.008374
(0.03359) (0.08728) (0.20316) (1.20748) (0.11760) (1.55495)
(0.11513)
(0.30381) (0.20825) (0.29562) (-0.67677) (2.24117) (6.79033)
(0.07274)
LD1(-2) -0.040028 -0.112218 -0.253735 4.309371 0.569452 -6.134439
0.146184
(0.05429) (0.14105) (0.32831) (1.95132) (0.19004) (2.51285)
(0.18605)
(-0.73735) (-0.79558) (-0.77285) (2.20844) (2.99646) (-2.44123)
(0.78572)
LD1(-3) 0.080364 0.119621 0.346176 -1.672153 -1.183442 6.443154
0.036731
(0.14707) (0.38213) (0.88943) (5.28636) (0.51484) (6.80759)
(0.50404)
(0.54644) (0.31304) (0.38921) (-0.31631) (-2.29864) (0.94647)
(0.07287)
LD1(-4) 0.147643 0.229973 0.621927 -3.032689 -0.454401 -6.890726
-0.412299
(0.26028) (0.67629) (1.57412) (9.35582) (0.91117) (12.0481)
(0.89204)
(0.56724) (0.34005) (0.39509) (-0.32415) (-0.49870) (-0.57193)
(-0.46220)
LI1(-1) 0.007183 0.054820 0.084928 -0.502206 -0.353007 -2.714636
-0.119578
(0.11887) (0.30885) (0.71888) (4.27269) (0.41612) (5.50223)
(0.40739)
(0.06043) (0.17750) (0.11814) (-0.11754) (-0.84833) (-0.49337)
(-0.29353)
LI1(-2) -0.181101 -0.341210 -0.875158 2.730891 -0.223340
-1.990356 -0.443695
(0.08589) (0.22318) (0.51946) (3.08744) (0.30069) (3.97591)
(0.29438)
(-2.10842) (-1.52887) (-1.68473) (0.88452) (-0.74276) (-0.50060)
(-1.50723)
LI1(-3) 0.071192 0.157533 0.409313 -4.016498 1.816736 2.608944
1.542211
(0.14012) (0.36408) (0.84742) (5.03668) (0.49053) (6.48607)
(0.48023)
(0.50807) (0.43269) (0.48301) (-0.79745) (3.70363) (0.40224)
(3.21141)
LI1(-4) -0.135203 -0.178106 -0.554176 5.215701 -0.822062
-7.324097 -0.660407
(0.16658) (0.43282) (1.00742) (5.98760) (0.58314) (7.71063)
(0.57090)
(-0.81165) (-0.41150) (-0.55010) (0.87108) (-1.40972) (-0.94987)
(-1.15679)
LV1(-1) 0.004162 0.013340 0.029308 -0.427780 -0.038797 0.514693
0.006817
(0.00925) (0.02403) (0.05593) (0.33241) (0.03237) (0.42806)
(0.03169)
(0.45002) (0.55517) (0.52404) (-1.28692) (-1.19841) (1.20238)
(0.21509)
LV1(-2) -0.014562 -0.021432 -0.061775 0.263071 0.061784 -0.508781
-0.022947
(0.01307) (0.03396) (0.07905) (0.46983) (0.04576) (0.60504)
(0.04480)
(-1.11405) (-0.63106) (-0.78146) (0.55992) (1.35024) (-0.84091)
(-0.51224)
LV1(-3) -0.016408 -0.025325 -0.068643 0.332165 0.064005 0.415130
0.035303
(0.02315) (0.06015) (0.14001) (0.83215) (0.08104) (1.07161)
(0.07934)
(-0.70876) (-0.42102) (-0.49027) (0.39917) (0.78976) (0.38739)
(0.44495)
LV1(-4) -0.004166 -0.006330 -0.016960 -0.086558 0.035778 0.276714
0.046676
(0.00733) (0.01904) (0.04432) (0.26341) (0.02565) (0.33921)
(0.02511)
(-0.56854) (-0.33245) (-0.38270) (-0.32861) (1.39467) (0.81577)
(1.85850)
LH1(-1) 0.090371 0.111979 0.369639 -4.554235 1.485740 11.55551
0.882907
(0.14227) (0.36967) (0.86043) (5.11397) (0.49806) (6.58560)
(0.48760)
(0.63519) (0.30292) (0.42960) (-0.89055) (2.98308) (1.75466)
(1.81072)
|
LH1(-2)
|
-0.007696
|
0.006775
|
-0.014887
|
2.607119
|
0.108372
|
-4.389817
|
-0.045779
|
|
(0.06941)
|
(0.18034)
|
(0.41976)
|
(2.49487)
|
(0.24298)
|
(3.21281)
|
(0.23788)
|
|
(-0.11087)
|
(0.03757)
|
(-0.03547)
|
(1.04499)
|
(0.44601)
|
(-1.36635)
|
(-0.19245)
|
|
LH1(-3)
|
0.023703
|
0.061962
|
0.156702
|
2.128439
|
-0.545975
|
2.480604
|
-0.757606
|
|
(0.10376)
|
(0.26958)
|
(0.62748)
|
(3.72944)
|
(0.36322)
|
(4.80266)
|
(0.35559)
|
|
(0.22845)
|
(0.22984)
|
(0.24973)
|
(0.57071)
|
(-1.50317)
|
(0.51651)
|
(-2.13057)
|
|
LH1(-4)
|
0.120687
|
0.112376
|
0.391117
|
-3.829976
|
1.690713
|
3.630916
|
0.605197
|
|
(0.10994)
|
(0.28565)
|
(0.66488)
|
(3.95173)
|
(0.38486)
|
(5.08891)
|
(0.37678)
|
|
(1.09776)
|
(0.39340)
|
(0.58825)
|
(-0.96919)
|
(4.39301)
|
(0.71350)
|
(1.60622)
|
|
C
|
140.7212
|
212.4412
|
671.3743
|
-2236.910
|
666.3828
|
486.0639
|
466.8828
|
|
(153.235)
|
(398.147)
|
(926.721)
|
(5507.98)
|
(536.429)
|
(7093.00)
|
(525.167)
|
|
(0.91834)
|
(0.53357)
|
(0.72446)
|
(-0.40612)
|
(1.24226)
|
(0.06853)
|
(0.88902)
|
|
R-squared
|
0.998792
|
0.993784
|
0.996339
|
0.997598
|
0.999990
|
0.999580
|
0.999948
|
|
Adj. R-squared
|
0.981883
|
0.906754
|
0.945087
|
0.963969
|
0.999848
|
0.993693
|
0.999221
|
|
Sum sq. resids
|
23.89773
|
161.3353
|
874.0576
|
30876.41
|
292.8642
|
51203.72
|
280.6960
|
|
S.E. equation
|
3.456713
|
8.981516
|
20.90523
|
124.2506
|
12.10091
|
160.0058
|
11.84686
|
|
F-statistic
|
59.06733
|
11.41891
|
19.43997
|
29.66518
|
7040.355
|
169.7995
|
1375.353
|
|
Log likelihood
|
-39.95394
|
-69.55430
|
-95.74406
|
-150.9954
|
-78.79578
|
-158.8356
|
-78.13801
|
|
Akaike AIC
|
4.448641
|
6.358342
|
8.048004
|
11.61261
|
6.954567
|
12.11842
|
6.912130
|
|
Schwarz SC
|
5.790113
|
7.699814
|
9.389476
|
12.95408
|
8.296039
|
13.45990
|
8.253602
|
|
Mean dependent
|
90.63226
|
93.76452
|
376.2161
|
1377.097
|
1748.445
|
2430.716
|
484.9771
|
|
S.D. dependent
|
25.68135
|
29.41267
|
89.21083
|
654.5796
|
980.9255
|
2014.715
|
424.4629
|
|
Determinant Residual
|
0.000000
|
|
|
|
|
|
|
Covariance
|
|
|
|
|
|
|
Test de Cointégration de JOHANSEN
Date: 02/01/09 Time: 18:06
Sample: 1970 2004
Included observations: 33
Test
assumption:
Linear
deterministic
trend in the
data
Series: LY1 LL1 LC1 LD1 LI1 LV1 LH1
Lags interval: 1 to 1
|
Eigenvalue
|
Likelihood
Ratio
|
5 Percent
Critical Value
|
1 Percent
Critical Value
|
Hypothesized
No. of CE(s)
|
|
0.849850
|
179.8056
|
124.24
|
133.57
|
None **
|
|
0.718013
|
117.2336
|
94.15
|
103.18
|
At most 1 **
|
|
0.586166
|
75.45907
|
68.52
|
76.07
|
At most 2 *
|
|
0.449082
|
46.34348
|
47.21
|
54.46
|
At most 3
|
|
0.375869
|
26.66987
|
29.68
|
35.65
|
At most 4
|
|
0.264515
|
11.11382
|
15.41
|
20.04
|
At most 5
|
|
0.029125
|
0.975397
|
3.76
|
6.65
|
At most 6
|
*(**) denotes
rejection of the
hypothesis
at
5%(1%)
significance
level
L.R. test
indicates
3
cointegrating
equation(s) at
5%
significance
level
Normalized Cointegrating Coefficients: 1 Cointegrating
Equation(s)
|
LY1
1.000000
Log likelihood
|
LL1
0.133676
(0.04212)
-941.3501
|
LC1
-0.358572
(0.01422)
|
LD1
-0.039942
(0.00266)
|
LI1
0.0.20455
(0.00225)
|
LV1
0.006042
(0.00045)
|
LH1
0.024097
(0.000217)
|
C
25.57425
|
|
Normalized Cointegrating Coefficients: 2 Cointegrating
Equation(s)
|
|
|
|
|
|
|
|
|
LY1
|
LL1
|
LC1
|
LD1
|
LI1
|
LV1
|
LH1
|
C
|
|
1.000000
0.000000
Log likelihood
|
0.000000
1.000000
-920.4629
|
-0.405662 (0.22520) -0.236397 (0.04977)
|
-0.096248 (0.14444) 0.085192 (0.03192)
|
0.261880 (0.39519) -0.078277 (0.08734)
|
0.011593 (0.02309) -0.014117 (0.00510)
|
-0.370328 (0.63657) 0.035600 (0.14069)
|
-101.2342
29.08664
|
|
Normalized
|
|
|
|
|
|
|
|
|
Cointegrating
|
|
|
|
|
|
|
|
|
Coefficients: 3
|
|
|
|
|
|
|
|
|
Cointegrating
|
|
|
|
|
|
|
|
|
Equation(s)
|
|
|
|
|
|
|
|
|
LY1
|
LL1
|
LC1
|
LD1
|
LI1
|
LV1
|
LH1
|
C
|
|
1.000000
|
0.000000
|
0.000000
|
0.158107
|
-0.144118
|
-0.032144
|
0.086294
|
-21.45901
|
|
|
|
(0.02315)
|
(0.11693)
|
(0.00550)
|
(0.22674)
|
|
|
0.000000
|
1.000000
|
0.000000
|
0.233416
|
-0.314870
|
-0.039604
|
0.301695
|
75.57519
|
|
|
|
(0.04560)
|
(0.23031)
|
(0.01084)
|
(0.44659)
|
|
|
0.000000
|
0.000000
|
1.000000
|
0.627013
|
-1.000827
|
-0.107814
|
1.125622
|
196.6542
|
|
|
|
(0.14775)
|
(0.74618)
|
(0.03511)
|
(1.44691)
|
|
|
Log likelihood
|
-905.9051
|
|
|
|
|
|
|
|
Normalized
|
|
|
|
|
|
|
|
|
Cointegrating
|
|
|
|
|
|
|
|
|
Coefficients: 4
|
|
|
|
|
|
|
|
|
Cointegrating
|
|
|
|
|
|
|
|
|
Equation(s)
|
|
|
|
|
|
|
|
|
LY1
|
LL1
|
LC1
|
LD1
|
LI1
|
LV1
|
LH1
|
C
|
|
1.000000
|
0.000000
|
0.000000
|
0.000000
|
5.747749
|
-0.178145
|
-11.18412
|
-4016.454
|
|
|
|
|
(53.7603)
|
(1.57201)
|
(104.799)
|
|
|
0.000000
|
1.000000
|
0.000000
|
0.000000
|
8.383381
|
-0.255148
|
-16.33698
|
-5822.297
|
|
|
|
|
(77.9471)
|
(2.27925)
|
(151.948)
|
|
|
0.000000
|
0.000000
|
1.000000
|
0.000000
|
22.36481
|
-0.686819
|
-43.56995
|
-15646.48
|
|
|
|
|
(208.441)
|
(6.09502)
|
(406.329)
|
|
|
0.000000
|
0.000000
|
0.000000
|
1.000000
|
-37.26500
|
0.923434
|
71.28332
|
25267.63
|
|
|
|
|
(339.908)
|
(9.93925)
|
(662.607)
|
|
|
Log likelihood
|
-896.0683
|
|
|
|
|
|
|
|
Normalized
|
|
|
|
|
|
|
|
|
Cointegrating
|
|
|
|
|
|
|
|
|
Coefficients: 5
|
|
|
|
|
|
|
|
|
Cointegrating
|
|
|
|
|
|
|
|
|
Equation(s)
|
|
|
|
|
|
|
|
|
LY1
|
LL1
|
LC1
|
LD1
|
LI1
|
LV1
|
LH1
|
C
|
|
1.000000
|
0.000000
|
0.000000
|
0.000000
|
0.000000
|
-0.015181
|
0.109158
|
-95.18805
|
|
|
|
|
|
(0.00451)
|
(0.05807)
|
|
|
0.000000
|
1.000000
|
0.000000
|
0.000000
|
0.000000
|
-0.017456
|
0.134827
|
-102.9324
|
|
|
|
|
|
(0.00591)
|
(0.07601)
|
|
|
0.000000
|
0.000000
|
1.000000
|
0.000000
|
0.000000
|
-0.052715
|
0.372813
|
-388.6118
|
|
|
|
|
|
(0.01631)
|
(0.20986)
|
|
|
0.000000
|
0.000000
|
0.000000
|
1.000000
|
0.000000
|
-0.133132
|
-1.935578
|
-155.5385
|
|
|
|
|
|
(0.02455)
|
(0.31586)
|
|
|
0.000000
|
0.000000
|
0.000000
|
0.000000
|
1.000000
|
-0.028353
|
-1.964817
|
-682.2265
|
|
|
|
|
|
(0.01334)
|
(0.17156)
|
|
|
Log likelihood
|
-888.2903
|
|
|
|
|
|
|
|
Normalized
|
|
|
|
|
|
|
|
|
Cointegrating
|
|
|
|
|
|
|
|
|
Coefficients: 6
|
|
|
|
|
|
|
|
|
Cointegrating
|
|
|
|
|
|
|
|
|
Equation(s)
|
|
|
|
|
|
|
|
|
LY1
|
LL1
|
LC1
|
LD1
|
LI1
|
LV1
|
LH1
|
C
|
|
1.000000
|
0.000000
|
0.000000
|
0.000000
|
0.000000
|
0.000000
|
-0.217880
|
5.929235
|
|
|
|
|
|
|
(0.14683)
|
|
|
0.000000
|
1.000000
|
0.000000
|
0.000000
|
0.000000
|
0.000000
|
-0.241241
|
13.34449
|
|
|
|
|
|
|
(0.16325)
|
|
|
0.000000
|
0.000000
|
1.000000
|
0.000000
|
0.000000
|
0.000000
|
-0.762836
|
-37.47985
|
|
|
|
|
|
|
(0.50720)
|
|
|
0.000000
|
0.000000
|
0.000000
|
1.000000
|
0.000000
|
0.000000
|
-4.803659
|
731.2451
|
|
|
|
|
|
|
(1.95456)
|
|
|
0.000000
|
0.000000
|
0.000000
|
0.000000
|
1.000000
|
0.000000
|
-2.575626
|
-493.3699
|
|
|
|
|
|
|
(0.36597)
|
|
|
0.000000
|
0.000000
|
0.000000
|
0.000000
|
0.000000
|
1.000000
|
-21.54322
|
6660.960
|
|
|
|
|
|
|
(12.5953)
|
|
|
Log likelihood
|
-883.2211
|
|
|
|
|
|
|
Estimation du VECM
Date: 02/01/09 Time: 18:24
Sample(adjusted): 1973 2004
Included observations: 32 after adjusting endpoints
Standard errors & t-statistics in parentheses
|
Cointegrating Eq:
|
CointEq1
|
|
|
|
|
|
|
|
LY1(-1)
|
1.000000
|
|
|
|
|
|
|
|
LL1(-1)
|
0.133676
|
|
|
|
|
|
|
|
(0.04212)
|
|
|
|
|
|
|
|
(3.17353)
|
|
|
|
|
|
|
|
LC1(-1)
|
-0.358572
|
|
|
|
|
|
|
|
(0.01422)
|
|
|
|
|
|
|
|
(-25.2223)
|
|
|
|
|
|
|
|
LD1(-1)
|
-0.039942
|
|
|
|
|
|
|
|
(0.00266)
|
|
|
|
|
|
|
|
(-15.0220)
|
|
|
|
|
|
|
|
LI1(-1)
|
0.020455
|
|
|
|
|
|
|
|
(0.00225)
|
|
|
|
|
|
|
|
(9.09466)
|
|
|
|
|
|
|
|
LV1(-1)
|
0.006042
|
|
|
|
|
|
|
|
(0.00045)
|
|
|
|
|
|
|
|
(13.5034)
|
|
|
|
|
|
|
|
LH1(-1)
|
0.024097
|
|
|
|
|
|
|
|
(0.00217)
|
|
|
|
|
|
|
|
(11.1022)
|
|
|
|
|
|
|
|
C
|
25.57425
|
|
|
|
|
|
|
|
Error Correction:
|
D(LY1)
|
D(LL1)
|
D(LC1)
|
D(LD1)
|
D(LI1)
|
D(LV1)
|
D(LH1)
|
|
CointEq1
|
-0.430715
|
-0.580505
|
-1.418382
|
33.81925
|
16.59082
|
-90.44913
|
6.130396
|
|
(0.57113)
|
(1.18338)
|
(2.92584)
|
(10.3096)
|
(3.50635)
|
(32.4437)
|
(3.29331)
|
|
(-2.75415)
|
(-2.49055)
|
(-2.48478)
|
(3.28035)
|
(4.73165)
|
(-2.78788)
|
(1.86147)
|
|
D(LY1(-1))
|
1.128497
|
1.081714
|
3.898838
|
34.83750
|
22.10816
|
-33.25280
|
24.75070
|
|
(2.39546)
|
(4.96337)
|
(12.2717)
|
(43.2411)
|
(14.7065)
|
(136.077)
|
(13.8129)
|
|
(1.47110)
|
(1.21794)
|
(1.31771)
|
(1.80566)
|
(1.50329)
|
(-0.24437)
|
(1.79185)
|
|
D(LY1(-2))
|
-1.677219
|
-2.684125
|
-7.688464
|
104.4778
|
34.29288
|
-367.7833
|
2.516808
|
|
(2.14145)
|
(4.43707)
|
(10.9704)
|
(38.6560)
|
(13.1471)
|
(121.648)
|
(12.3482)
|
|
(-1.78322)
|
(-1.60493)
|
(-1.70083)
|
(2.70276)
|
(2.60841)
|
(-3.02335)
|
(1.20382)
|
|
D(LL1(-1))
|
-1.284150
|
-1.598436
|
-5.311541
|
78.68691
|
-0.942130
|
-232.0976
|
4.355496
|
|
(1.67451)
|
(3.46958)
|
(8.57837)
|
(30.2272)
|
(10.2804)
|
(95.1227)
|
(9.65575)
|
|
(-1.76688)
|
(-0.46070)
|
(-0.61918)
|
(2.60319)
|
(-0.09164)
|
(-2.43998)
|
(0.45108)
|
|
D(LL1(-2))
|
-2.190368
|
-4.362032
|
-10.97016
|
33.42845
|
11.18970
|
-91.53003
|
5.796280
|
|
(1.51369)
|
(3.13636)
|
(7.75449)
|
(27.3241)
|
(9.29304)
|
(85.9871)
|
(8.72840)
|
|
(-1.44704)
|
(-1.39080)
|
(-1.41468)
|
(1.22340)
|
(1.20409)
|
(-1.06446)
|
(0.66407)
|
|
D(LC1(-1))
|
0.234009
|
0.314965
|
1.125616
|
-33.11707
|
-1.052314
|
105.0301
|
-5.943697
|
|
(1.01616)
|
(2.10548)
|
(5.20569)
|
(18.3430)
|
(6.23854)
|
(57.7242)
|
(5.85949)
|
|
(1.23029)
|
(0.14959)
|
(0.21623)
|
(-1.80543)
|
(-0.16868)
|
(1.81951)
|
(-1.01437)
|
|
D(LC1(-2))
|
1.192081
|
2.263658
|
5.918494
|
-22.91446
|
-8.830030
|
88.81067
|
-2.193364
|
|
(0.90682)
|
(1.87893)
|
(4.64556)
|
(16.3693)
|
(5.56727)
|
(51.5131)
|
(5.22900)
|
|
(1.31457)
|
(1.20476)
|
(1.27401)
|
(-1.39984)
|
(-1.58606)
|
(1.72404)
|
(-0.41946)
|
|
D(LD1(-1))
|
-0.009276
|
-0.014194
|
-0.015241
|
1.177110
|
0.694806
|
6.053097
|
0.203100
|
|
(0.03107)
|
(0.06437)
|
(0.15916)
|
(0.56084)
|
(0.19074)
|
(1.76491)
|
(0.17915)
|
|
(-1.29857)
|
(-0.22048)
|
(-0.09575)
|
(2.09885)
|
(3.64263)
|
(3.42968)
|
(1.13366)
|
|
D(LD1(-2)) 0.008055
|
0.024226
|
0.076539
|
4.747023
|
1.085077
|
-5.610636
|
0.460794
|
|
(0.05112)
|
(0.10592)
|
(0.26188)
|
(0.92279)
|
(0.31384)
|
(2.90395)
|
(0.29478)
|
|
(1.15757)
|
(0.22872)
|
(0.29226)
|
(5.14421)
|
(3.45737)
|
(-1.93207)
|
(1.56320)
|
|
D(LI1(-1)) 0.020320
|
0.042180
|
0.076905
|
-2.791466
|
-0.330022
|
6.800664
|
-0.233518
|
|
(0.05029)
|
(0.10421)
|
(0.25765)
|
(0.90787)
|
(0.30877)
|
(2.85700)
|
(0.29001)
|
|
(1.40402)
|
(0.40477)
|
(0.29849)
|
(-3.07475)
|
(-1.06883)
|
(2.38036)
|
(-0.80521)
|
|
D(LI1(-2)) -0.015018
|
-0.047471
|
-0.107140
|
-1.668803
|
-0.463985
|
4.041318
|
-0.111440
|
|
(0.02944)
|
(0.06099)
|
(0.15079)
|
(0.53135)
|
(0.18071)
|
(1.67211)
|
(0.16973)
|
|
(-1.51020)
|
(-0.77834)
|
(-0.71050)
|
(-3.14070)
|
(-2.56752)
|
(2.41689)
|
(-0.65656)
|
|
D(LV1(-1)) -0.001844
|
-0.003126
|
-0.011455
|
-0.427682
|
-0.146341
|
0.276840
|
-0.046336
|
|
(0.00524)
|
(0.01085)
|
(0.02683)
|
(0.09454)
|
(0.03215)
|
(0.29752)
|
(0.03020)
|
|
(-1.35199)
|
(-0.28802)
|
(-0.42694)
|
(-4.52363)
|
(-4.55113)
|
(0.93048)
|
(-1.53425)
|
|
D(LV1(-2)) -0.001427
|
-0.002837
|
-0.007876
|
-0.128724
|
-0.014954
|
0.296812
|
-0.000135
|
|
(0.00239)
|
(0.00495)
|
(0.01223)
|
(0.04310)
|
(0.01466)
|
(0.13562)
|
(0.01377)
|
|
(-1.59778)
|
(-0.57342)
|
(-0.64394)
|
(-2.98684)
|
(-1.02024)
|
(2.18850)
|
(-0.00978)
|
|
D(LH1(-1)) 0.018070
|
0.028494
|
0.083517
|
-0.172621
|
-0.322004
|
3.088715
|
0.311525
|
|
(0.05039)
|
(0.10440)
|
(0.25813)
|
(0.90958)
|
(0.30935)
|
(2.86237)
|
(0.29055)
|
|
(1.35861)
|
(0.27292)
|
(0.32354)
|
(-0.18978)
|
(-1.04090)
|
(1.07908)
|
(1.07218)
|
|
D(LH1(-2)) 0.081498
|
0.164966
|
0.400315
|
-0.642171
|
0.377409
|
0.273855
|
0.049255
|
|
(0.04051)
|
(0.08394)
|
(0.20755)
|
(0.73133)
|
(0.24873)
|
(2.30145)
|
(0.23362)
|
|
(2.01160)
|
(1.96518)
|
(1.92877)
|
(-0.87809)
|
(1.51735)
|
(0.11899)
|
(0.21084)
|
|
C -3.479734
|
-7.167479
|
-18.20827
|
54.37015
|
11.44097
|
-1041.779
|
4.755857
|
|
(3.73536)
|
(7.73964)
|
(19.1359)
|
(67.4281)
|
(22.9326)
|
(212.192)
|
(21.5392)
|
|
(-0.93157)
|
(-0.92607)
|
(-0.95152)
|
(0.80634)
|
(0.49890)
|
(-4.90962)
|
(0.22080)
|
|
0.594193
|
0.457167
|
0.513991
|
0.762676
|
0.921324
|
0.978836
|
0.712030
|
|
R-squared
|
|
|
|
|
|
|
|
Adj. R-squared 0.213750
|
-0.051740
|
0.058357
|
0.540185
|
0.847565
|
0.958995
|
0.442058
|
|
Sum sq. resids 481.1805
|
2065.783
|
12628.18
|
156792.7
|
18136.33
|
1552744.
|
15999.38
|
|
S.E. equation 5.483957
|
11.36272
|
28.09379
|
98.99266
|
33.66779
|
311.5229
|
31.62216
|
|
F-statistic 1.561844
|
0.898332
|
1.128079
|
3.427890
|
12.49105
|
49.33315
|
2.637420
|
|
Log likelihood -88.77414
|
-112.0865
|
-141.0532
|
-181.3571
|
-146.8450
|
-218.0428
|
-144.8391
|
|
Akaike AIC 6.548384
|
8.005406
|
9.815827
|
12.33482
|
10.17781
|
14.62768
|
10.05245
|
|
Schwarz SC 7.281252
|
8.738274
|
10.54869
|
13.06769
|
10.91068
|
15.36054
|
10.78531
|
|
Mean dependent 2.456250
|
2.759375
|
8.778125
|
55.48438
|
108.6562
|
24.09375
|
43.17531
|
|
S.D. dependent 6.184629
|
11.07971
|
28.95125
|
145.9860
|
86.23284
|
1538.400
|
42.33474
|
|
Determinant Residual
|
6.70E+13
|
|
|
|
|
|
|
Covariance
|
|
|
|
|
|
|
|
Log Likelihood
|
-827.2228
|
|
|
|
|
|
|
Akaike Information Criteria
|
59.13893
|
|
|
|
|
|
|
Schwarz Criteria
|
64.58963
|
|
|
|
|
|
Decomposition de la variance
Varia
nce
Deco
mposi
tion of
LY1:
|
Perio
d
|
S.E.
|
LY1
|
LL1
|
LC1
|
LD1
|
LI1
|
LV1
|
LH1
|
|
1
|
3.166018
|
100.0000
|
0.000000
|
0.000000
|
0.000000
|
0.000000
|
0.000000
|
0.000000
|
|
2
|
3.434566
|
88.78875
|
0.255433
|
0.232175
|
0.954986
|
3.836985
|
5.524315
|
0.407360
|
|
3
|
4.330526
|
55.85259
|
0.189794
|
0.653421
|
8.261803
|
4.690334
|
23.18026
|
7.171788
|
|
4
|
5.533345
|
34.32353
|
0.799082
|
1.405027
|
20.82632
|
4.650721
|
28.02456
|
9.970762
|
|
5
|
6.094218
|
28.42829
|
3.003940
|
1.434894
|
20.82843
|
4.989316
|
30.92220
|
10.39293
|
|
6
|
6.495212
|
25.15319
|
3.091678
|
2.575879
|
18.43957
|
5.716328
|
35.69445
|
9.328908
|
|
7
|
7.124911
|
21.43765
|
3.784047
|
5.143314
|
15.32460
|
6.502566
|
40.05365
|
7.754173
|
|
8
|
8.031471
|
17.36426
|
9.940176
|
6.559195
|
12.19368
|
7.065318
|
40.75583
|
6.121545
|
|
9
|
9.042812
|
14.10563
|
19.59717
|
6.113521
|
9.791593
|
7.640403
|
37.88217
|
4.869505
|
|
10
|
10.07406
|
11.92515
|
29.48276
|
5.083773
|
7.890427
|
8.240118
|
33.44045
|
3.937319
|
Varia
nce
Deco mposi tion of LL1:
|
Perio
d
|
S.E.
|
LY1
|
LL1
|
LC1
|
LD1
|
LI1
|
LV1
|
LH1
|
|
1
|
6.505603
|
94.06571
|
5.934287
|
0.000000
|
0.000000
|
0.000000
|
0.000000
|
0.000000
|
|
2
|
7.010347
|
83.57657
|
10.07871
|
0.776893
|
0.023892
|
3.334946
|
2.019910
|
0.189076
|
|
3
|
8.034988
|
63.63344
|
11.29928
|
1.369949
|
4.496112
|
3.938366
|
9.067245
|
6.195605
|
|
4
|
9.284231
|
47.89979
|
8.471767
|
1.034418
|
16.81915
|
4.194662
|
12.32599
|
9.254218
|
|
5
|
9.759850
|
43.97939
|
10.80565
|
1.086989
|
16.78605
|
4.367674
|
13.14408
|
9.830160
|
|
6
|
10.11034
|
41.26708
|
12.11331
|
1.620129
|
15.72255
|
4.655771
|
15.45850
|
9.162667
|
|
7
|
10.71902
|
37.34580
|
10.80400
|
4.636536
|
14.14146
|
5.099909
|
19.70944
|
8.262851
|
|
8
|
11.61754
|
32.07649
|
12.68109
|
7.136399
|
12.08002
|
5.571328
|
23.41177
|
7.042900
|
|
9
|
12.67631
|
27.05117
|
19.04007
|
7.241926
|
10.37787
|
6.221634
|
24.14013
|
5.927193
|
|
10
|
13.79260
|
23.04765
|
27.26171
|
6.260300
|
8.789329
|
6.970057
|
22.64694
|
5.024011
|
Varia
nce
Deco mposi tion of LC1:
|
Perio d
|
S.E.
|
LY1
|
LL1
|
LC1
|
LD1
|
LI1
|
LV1
|
LH1
|
|
1
|
16.08436
|
97.31131
|
2.335554
|
0.353139
|
0.000000
|
0.000000
|
0.000000
|
0.000000
|
|
2
|
17.31035
|
86.32514
|
3.925646
|
1.829984
|
0.808705
|
3.758812
|
3.062248
|
0.289470
|
|
3
|
20.59584
|
61.09519
|
5.233247
|
1.375930
|
6.305047
|
4.541102
|
14.75875
|
6.690728
|
|
4
|
24.61979
|
43.22621
|
3.680631
|
1.064788
|
18.61194
|
4.663461
|
18.96264
|
9.790323
|
|
5
|
26.09443
|
39.01436
|
5.464012
|
0.948201
|
18.65535
|
4.938049
|
20.65677
|
10.32326
|
|
6
|
27.17269
|
36.29003
|
5.906809
|
1.755364
|
17.26946
|
5.421061
|
23.82952
|
9.527750
|
|
7
|
29.23841
|
32.04393
|
5.736163
|
4.807046
|
15.08114
|
5.974565
|
28.04664
|
8.310522
|
|
8
|
32.36688
|
26.57271
|
10.56185
|
6.938979
|
12.34308
|
6.434533
|
30.36456
|
6.784285
|
|
9
|
35.91615
|
21.81363
|
19.35001
|
6.727132
|
10.19908
|
7.016850
|
29.36724
|
5.526056
|
|
10
|
39.52889
|
18.35014
|
28.74407
|
5.683360
|
8.424489
|
7.689292
|
26.53383
|
4.574809
|
Varia
nce
Deco
mposi
tion of
LD1:
|
Perio
d
|
S.E.
|
LY1
|
LL1
|
LC1
|
LD1
|
LI1
|
LV1
|
LH1
|
|
1
|
84.39920
|
21.48853
|
4.739922
|
1.880795
|
71.89075
|
0.000000
|
0.000000
|
0.000000
|
|
2
|
120.5865
|
14.90720
|
26.73661
|
13.89299
|
36.64431
|
0.089727
|
7.649234
|
0.079924
|
|
3
|
145.4018
|
14.66695
|
36.87421
|
15.23318
|
25.47720
|
0.088336
|
7.605123
|
0.054996
|
|
4
|
158.0911
|
12.48511
|
44.05073
|
14.33565
|
22.23675
|
0.079795
|
6.733414
|
0.078547
|
|
5
|
166.7851
|
11.24062
|
47.24062
|
13.24595
|
21.85524
|
0.081388
|
6.063669
|
0.272514
|
|
6
|
172.7692
|
10.55768
|
48.95246
|
12.55758
|
21.77678
|
0.099842
|
5.760324
|
0.295337
|
|
7
|
175.8486
|
10.28106
|
49.66282
|
12.50554
|
21.08673
|
0.157239
|
5.996350
|
0.310253
|
|
8
|
177.2694
|
10.17784
|
49.29196
|
12.61270
|
20.78679
|
0.227569
|
6.440928
|
0.462212
|
|
9
|
178.5172
|
10.04405
|
48.60954
|
12.80040
|
20.53440
|
0.315820
|
7.092625
|
0.603156
|
|
10
|
180.7489
|
9.804059
|
47.51358
|
13.20254
|
20.04994
|
0.464897
|
8.291520
|
0.673469
|
Varia
nce
Deco mposi tion of LI1:
|
Perio
d
|
S.E.
|
LY1
|
LL1
|
LC1
|
LD1
|
LI1
|
LV1
|
LH1
|
|
1
|
27.31482
|
1.382414
|
0.556570
|
0.180649
|
32.47558
|
65.40478
|
0.000000
|
0.000000
|
|
2
|
41.63389
|
11.57427
|
7.975357
|
0.576778
|
23.26664
|
53.48263
|
2.964439
|
0.159883
|
|
3
|
57.34247
|
8.698827
|
26.91020
|
0.617096
|
16.02854
|
41.52623
|
4.798543
|
1.420573
|
|
4
|
83.42863
|
7.891199
|
44.98775
|
1.728302
|
9.201818
|
28.98647
|
3.069051
|
4.135412
|
|
5
|
113.4345
|
7.167360
|
56.11676
|
1.393522
|
7.239336
|
21.15118
|
2.628952
|
4.302893
|
|
6
|
143.3309
|
5.668528
|
63.19750
|
1.117207
|
5.479619
|
17.52158
|
2.801744
|
4.213818
|
|
7
|
172.1577
|
5.044975
|
65.68357
|
0.783732
|
4.968522
|
15.76179
|
3.683772
|
4.073635
|
|
8
|
199.4006
|
4.707841
|
66.32361
|
0.585720
|
4.866983
|
14.98818
|
4.525919
|
4.001742
|
|
9
|
225.0409
|
4.725253
|
65.97287
|
0.487237
|
4.774050
|
14.90559
|
5.130007
|
4.004988
|
|
10
|
249.4789
|
4.824651
|
65.23849
|
0.494854
|
4.672516
|
15.22196
|
5.504107
|
4.043418
|
Varia
nce
Deco mposi tion of LV1:
|
Perio d
|
S.E.
|
LY1
|
LL1
|
LC1
|
LD1
|
LI1
|
LV1
|
LH1
|
|
1
|
295.6217
|
9.632136
|
6.147125
|
12.96110
|
15.36207
|
1.916991
|
53.98058
|
0.000000
|
|
2
|
854.9493
|
1.473644
|
2.642407
|
11.82508
|
72.79886
|
0.387964
|
10.75580
|
0.116244
|
|
3
|
1102.015
|
3.837210
|
21.69256
|
17.38666
|
43.84798
|
1.909690
|
10.96476
|
0.361138
|
|
4
|
1274.991
|
8.285985
|
31.38963
|
15.69874
|
32.78372
|
1.973247
|
9.403412
|
0.465264
|
|
5
|
1352.445
|
7.386788
|
37.50900
|
15.00105
|
29.23499
|
2.059177
|
8.395427
|
0.413569
|
|
6
|
1411.961
|
6.939309
|
39.45202
|
13.86444
|
28.64417
|
2.363071
|
7.950036
|
0.786946
|
|
7
|
1481.635
|
6.484547
|
41.22723
|
12.92806
|
28.26787
|
2.731304
|
7.220927
|
1.140071
|
|
8
|
1548.026
|
6.299688
|
43.40205
|
12.79394
|
26.09425
|
3.430979
|
6.823676
|
1.155421
|
|
9
|
1600.545
|
6.150483
|
44.94849
|
12.55306
|
24.41528
|
4.267354
|
6.584247
|
1.081082
|
|
10
|
1642.200
|
5.961747
|
45.82866
|
12.27341
|
23.19360
|
5.331870
|
6.383136
|
1.027582
|
Varia
nce
Deco mposi tion of LH1:
|
Perio d
|
S.E.
|
LY1
|
LL1
|
LC1
|
LD1
|
LI1
|
LV1
|
LH1
|
|
1
|
18.14882
|
4.429773
|
8.502750
|
21.07472
|
0.896425
|
19.74914
|
0.046072
|
45.30112
|
|
2
|
22.87780
|
5.094728
|
5.513801
|
16.57893
|
8.583660
|
21.72962
|
0.087375
|
42.41189
|
|
3
|
28.82553
|
4.305368
|
21.37445
|
12.40377
|
5.497693
|
25.39454
|
0.577113
|
30.44706
|
|
4
|
37.67825
|
2.760669
|
40.74941
|
7.338573
|
3.955931
|
26.49235
|
0.433595
|
18.26947
|
|
5
|
47.59462
|
2.444990
|
53.26716
|
5.049063
|
2.545322
|
24.83184
|
0.371713
|
11.48991
|
|
6
|
57.90444
|
3.228139
|
59.17582
|
3.620227
|
1.740680
|
23.54776
|
0.666755
|
8.020619
|
|
7
|
68.75658
|
4.773956
|
61.06479
|
2.608511
|
1.971638
|
22.00921
|
1.230436
|
6.341454
|
|
8
|
80.41887
|
5.646941
|
61.93931
|
1.966357
|
2.564796
|
20.55918
|
1.634634
|
5.688782
|
|
9
|
93.08116
|
5.991689
|
62.48018
|
1.707501
|
3.082692
|
19.38134
|
1.927950
|
5.428645
|
|
10
|
106.6486
|
5.838800
|
63.25807
|
1.613682
|
3.374523
|
18.55496
|
2.141506
|
5.218458
|
Fonctions de Reponses impulsionnelles
-Réponse de LY1 a un choc sur LL1, LC1, LD1, LH1
Response of LY1 to One S.D. LL1 Innovation Response of LY1 to One
S.D. LC1 Innovation Response of LY1 to One S.D. LD1 Innovation Response of LY1
to One S.D. LH1 Innovation
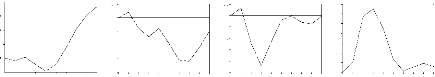
1.4
1.2
1.0
0.8
0.6
0.4
0.2
0.0
1 2 3 4 5 6 7 8 9 10
4
3
2
1
0
1
1 2 3 4 5 6 7 8 9 10
0.4
0.0
-0.4
-0.8
-1.2
-1.6
1 2 3 4 5 6 7 8 9 10
0.5
0.0
-0.5
-1.0
-1.5
-2.0
-2.5
1 2 3 4 5 6 7 8 9 10
-Réponse de LL1, LC1, LD1, LH1 a un choc sur
LY1
Response of LL1 to One S.D. LY1 Innovation Response of LC1 to One
S.D. LY1 Innovation Response of LD1 to One S.D. LY1 Innovation Response of LH1
to One S.D. LY1 Innovation
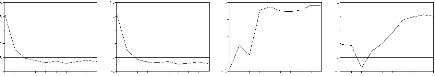
16
12
8
4
0
4
1 2 3 4 5 6 7 8 9 10
8
6
4
2
0
2
1 2 3 4 5 6 7 8 9 10
20
15
10
5
0
5
1 2 3 4 5 6 7 8 9 10
0
-10
-20
-30
40
1 2 3 4 5 6 7 8 9 10
Quelques Résultats pour les échantillons 2 (pays
développés) et les échantillons 3 (pays en
développés)
ADF TEST pour pays développés LY2 en
Différence : I(1)
ADF Test Statistic -3.773341 1% Critical Value* -4.2712
5% Critical Value -3.5562
10% Critical Value -3.2109
*MacKinnon critical values for rejection of hypothesis of a unit
root.
Augmented Dickey-Fuller Test Equation Dependent Variable:
D(LY2,2)
Method: Least Squares
Date: 02/04/09 Time: 16:48
Sample(adjusted): 1973 2004
Included observations: 32 after adjusting endpoints
Variable Coefficient Std. Error t-Statistic Prob.
D(LY2(-1)) -0.972162 0.257640 -3.773341 0.0008
D(LY2(-1),2) 0.021316 0.187141 0.113904 0.9101
C 6.510794 2.931691 2.220832 0.0346
@TREND(1970) -0.222870 0.129311 -1.723518 0.0958
-squared 0.478534 Mean dependent var -0.006250
Adjusted R-squared 0.422663 S.D. dependent var 8.018846
S.E. of regression 6.092936 Akaike info criterion 6.568606
Sum squared resid 1039.468 Schwarz criterion 6.751823
Log likelihood -101.0977 F-statistic 8.564936
Durbin-Watson stat 2.006797 Prob(F-statistic) 0.000341
LL2 en Différence I(1)
ADF Test Statistic -4.212604 1% Critical Value* -4.2712
5% Critical Value -3.5562
10% Critical Value -3.2109
*MacKinnon critical values for rejection of hypothesis of a unit
root.
Augmented Dickey-Fuller Test Equation
Dependent Variable: D(LL2,2)
Method: Least Squares
Date: 02/04/09 Time: 16:52
Sample(adjusted): 1973 2004
Included observations: 32 after adjusting endpoints
Variable Coefficient Std. Error t-Statistic Prob.
D(LL2(-1)) -1.160269 0.275428 -4.212604 0.0002
D(LL2(-1),2) 0.078991 0.187964 0.420247 0.6775
C 8.978357 4.927039 1.822262 0.0791
@TREND(1970) -0.312605 0.227679 -1.373008 0.1806
R-squared 0.541525 Mean dependent var 0.015625
Adjusted R-squared 0.492403 S.D. dependent var 15.83239
S.E. of regression 11.27992 Akaike info criterion 7.800394
Sum squared resid 3562.626 Schwarz criterion 7.983611
Log likelihood -120.8063 F-statistic 11.02401
Durbin-Watson stat 2.019605 Prob(F-statistic) 0.000059
L en Différence : I(1)
ADF Test Statistic -4.195187 1% Critical Value* -4.2712
5% Critical Value -3.5562
10% Critical Value -3.2109
*MacKinnon critical values for rejection of hypothesis of a unit
root.
Augmented Dickey-Fuller Test Equation Dependent Variable:
D(L,2)
Method: Least Squares
Date: 02/04/09 Time: 16:54
Sample(adjusted): 1973 2004
Included observations: 32 after adjusting endpoints
Variable Coefficient Std. Error t-Statistic Prob.
D(L(-1)) -1.148938 0.273871 -4.195187 0.0002
D(L(-1),2) 0.083708 0.188148 0.444906 0.6598
C 28.36144 13.34173 2.125770 0.0425
@TREND(1970) -0.987474 0.603956 -1.635009 0.1132
R-squared 0.533863 Mean dependent var -0.025000
Adjusted R-squared 0.483920 S.D. dependent var 40.50511
S.E. of regression 29.09835 Akaike info criterion 9.695708
Sum squared resid 23707.99 Schwarz criterion 9.878925
Log likelihood -151.1313 F-statistic 10.68940
Durbin-Watson stat 2.017042 Prob(F-statistic) 0.000074
LD2 en Différence : I(1)
ADF Test Statistic -3.802972 1% Critical Value* -4.2712
5% Critical Value -3.5562
10% Critical Value -3.2109
*MacKinnon critical values for rejection of hypothesis of a unit
root.
Augmented Dickey-Fuller Test Equation
Dependent Variable: D(LD2,2)
Method: Least Squares
Date: 02/04/09 Time: 16:57
Sample(adjusted): 1973 2004
Included observations: 32 after adjusting endpoints
|
Variable
|
Coefficient
|
|
D(LD2(-1))
|
-1.062865
|
|
D(LD2(-1),2)
|
-0.029454
|
|
C
|
70.09658
|
|
@TREND(1970)
|
-0.601964
|
|
R-squared
|
0.547960
|
|
Adjusted R-squared
|
0.499527
|
|
S.E. of regression
|
152.7441
|
|
Sum squared resid
|
653261.0
|
|
Log likelihood
|
-204.1900
|
|
Durbin-Watson stat
|
2.003002
|
LI2 en Différence : I(1)
ADF Test Statistic -4.081272
Std. Error t-Statistic Prob.
|
0.279483 -3.802972
|
0.0007
|
|
0.188847 -0.155967
|
0.8772
|
|
63.10635 1.110769
|
0.2761
|
|
2.928265 -0.205570
|
0.8386
|
|
Mean dependent var
|
0.465625
|
|
S.D. dependent var
|
215.9106
|
|
Akaike info criterion
|
13.01187
|
|
Schwarz criterion
|
13.19509
|
|
F-statistic
|
11.31379
|
|
Prob(F-statistic)
|
0.000049
|
|
|
|
1% Critical Value*
|
-4.2712
|
|
5% Critical Value
|
-3.5562
|
|
10% Critical Value
|
-3.2109
|
*MacKinnon critical values for rejection of hypothesis of a unit
root.
Augmented Dickey-Fuller Test Equation
Dependent Variable: D(LI2,2)
Method: Least Squares
Date: 02/04/09 Time: 20:00
Sample(adjusted): 1973 2004
Included observations: 32 after adjusting endpoints
Variable Coefficient Std. Error t-Statistic Prob.
D(LI2(-1)) -1.144501 0.280427 -4.081272 0.0003
D(LI2(-1),2) 0.049409 0.189615 0.260576 0.7963
C 1041.848 720.0771 1.446857 0.1590
@TREND(1970) -30.04743 33.43739 -0.898618 0.3765
R-squared 0.544536 Mean dependent var 20.12656
Adjusted R-squared 0.495736 S.D. dependent var 2388.389
S.E. of regression 1696.032 Akaike info criterion 17.82644
Sum squared resid 80542640 Schwarz criterion 18.00966
Log likelihood -281.2230 F-statistic 11.15859
Durbin-Watson stat 1.996177 Prob(F-statistic) 0.000054
LV2 en Différence : I(1)
ADF Test Statistic -4.853837 1% Critical Value* -4.2712
5% Critical Value -3.5562
10% Critical Value -3.2109
*MacKinnon critical values for rejection of hypothesis of a unit
root.
Augmented Dickey-Fuller Test Equation
Dependent Variable: D(LV2,2)
Method: Least Squares
Date: 02/04/09 Time: 16:59
Sample(adjusted): 1973 2004
Included observations: 32 after adjusting endpoints
Variable Coefficient Std. Error t-Statistic Prob.
D(LV2(-1)) -1.470098 0.302873 -4.853837 0.0000
D(LV2(-1),2) 0.128508 0.187626 0.684916 0.4990
C 554.6303 612.9929 0.904791 0.3733
@TREND(1970) -28.06257 29.70124 -0.944828 0.3528
R-squared 0.656903 Mean dependent var -0.412500
Adjusted R-squared 0.620142 S.D. dependent var 2466.083
S.E. of regression 1519.911 Akaike info criterion 17.60716
Sum squared resid 64683649 Schwarz criterion 17.79038
Log likelihood -277.7146 F-statistic 17.86982
Durbin-Watson stat 2.023657 Prob(F-statistic) 0.000001
LH2 en Différence : I(1)
ADF Test Statistic -3.239488 1% Critical Value* -4.2712
5% Critical Value -3.5562
10% Critical Value -3.2109
*MacKinnon critical values for rejection of hypothesis of a unit
root.
Augmented Dickey-Fuller Test Equation
Dependent Variable: D(LH2,2)
Method: Least Squares
Date: 02/04/09 Time: 17:00
Sample(adjusted): 1973 2004
Included observations: 32 after adjusting endpoints
|
Variable
|
Coefficient
|
Std. Error
|
t-Statistic
|
Prob.
|
|
D(LH2(-1))
|
-0.850540
|
0.262554
|
-3.239488
|
0.0031
|
|
D(LH2(-1),2)
|
0.003121
|
0.198037
|
0.015762
|
0.9875
|
|
C
|
-12.21893
|
13.06156
|
-0.935487
|
0.3575
|
@TREND(1970) 2.676849 0.928269 2.883698 0.0075
R-squared 0.411674 Mean dependent var 3.956875
Adjusted R-squared 0.348639 S.D. dependent var 39.76432
S.E. of regression 32.09256 Akaike info criterion 9.891594
Sum squared resid 28838.10 Schwarz criterion 10.07481
Log likelihood -154.2655 F-statistic 6.530895
Durbin-Watson stat 1.960378 Prob(F-statistic) 0.001731
Stationnarité du résidu,
échantillon2
ADF Test Statistic -2.787108 1% Critical Value* -2.6344
5% Critical Value -1.9514
10% Critical Value -1.6211
*MacKinnon critical values for rejection of hypothesis of a unit
root.
Augmented Dickey-Fuller Test Equation
Dependent Variable: D(RESID02)
Method: Least Squares
Date: 01/04/80 Time: 00:17
Sample(adjusted): 1972 2004
Included observations: 33 after adjusting endpoints
|
Variable
|
Coefficient
|
Std. Error t-Statistic
|
Prob.
|
|
RESID02(-1)
|
-0.613236
|
0.220026 -2.787108
|
0.0090
|
|
D(RESID02(-1))
|
-0.156247
|
0.193450 -0.807687
|
0.4254
|
|
R-squared
|
0.344826
|
Mean dependent var
|
1.95E-11
|
|
Adjusted R-squared
|
0.323692
|
S.D. dependent var
|
5.68E-10
|
|
S.E. of regression
|
4.67E-10
|
Akaike info criterion
|
-40.07093
|
|
Sum squared resid
|
6.77E-18
|
Schwarz criterion
|
-39.98023
|
|
Log likelihood
|
663.1703
|
Durbin-Watson stat
|
1.833330
|
Estimation du MVCE : échantillon 2
Date: 02/04/09 Time: 16:39
Sample(adjusted): 1973 2004
Included observations: 32 after adjusting endpoints Standard
errors & t-statistics in parentheses
Cointegrating Eq: CointEq1
LY2(-1) 1.000000
LL2(-1) 0.133676
(0.04212)
(3.17353)
L(-1) -0.358572
(0.01422)
(-25.2223)
LD2(-1) -0.039942
(0.00266)
(-15.0220)
LI2(-1) 0.020455
(0.00225)
(9.09466)
LV2(-1) 0.006042
(0.00045)
(13.5034)
LH2(-1) 0.024097
(0.00217)
(11.1022)
C 25.57425
Error Correction: D(LY2) D(LL2) D(L) D(LD2) D(LI2) D(LV2)
D(LH2)
CointEq1 -0.430715 -0.580505 -1.418382 33.81925 16.59082
-90.44913 6.130396
(0.57113) (1.18338) (2.92584) (10.3096) (3.50635) (32.4437)
(3.29331)
(-2.75415) (-2.49055) (-2.48478) (3.28035) (4.73165) (-2.78788)
(1.86147)
D(LY2(-1)) 1.128497 1.081714 3.898838 34.83750 22.10816 -33.25280
24.75070
(2.39546) (4.96337) (12.2717) (43.2411) (14.7065) (136.077)
(13.8129)
(1.47110) (1.21794) (1.31771) (1.80566) (1.50329) (-0.24437)
(1.79185)
D(LY2(-2)) -1.677219 -2.684125 -7.688464 104.4778 34.29288
-367.7833 2.516808
(2.14145) (4.43707) (10.9704) (38.6560) (13.1471) (121.648)
(12.3482)
(-1.78322) (-1.60493) (-1.70083) (1.70276) (2.60841) (-3.02335)
(2.20382)
D(LL2(-1)) -1.284150 -1.598436 -5.311541 78.68691 -0.942130
-232.0976 4.355496
(1.67451) (3.46958) (8.57837) (30.2272) (10.2804) (95.1227)
(9.65575)
(-1.76688) (-0.46070) (-0.61918) (2.60319) (-0.09164) (-2.43998)
(0.45108)
D(LL2(-2)) -2.190368 -4.362032 -10.97016 33.42845 11.18970
-91.53003 5.796280
(1.51369) (3.13636) (7.75449) (27.3241) (9.29304) (85.9871)
(8.72840)
(-1.44704) (-1.39080) (-1.41468) (1.22340) (1.20409) (-1.06446)
(0.66407)
D(L(-1)) 0.234009 0.314965 1.125616 -33.11707 -1.052314 105.0301
-5.943697
(1.01616) (2.10548) (5.20569) (18.3430) (6.23854) (57.7242)
(5.85949)
(1.23029) (0.14959) (0.21623) (-1.80543) (-0.16868) (1.81951)
(-1.01437)
D(L(-2)) 1.192081 2.263658 5.918494 -22.91446 -8.830030 88.81067
-2.193364
(0.90682) (1.87893) (4.64556) (16.3693) (5.56727) (51.5131)
(5.22900)
(1.31457) (1.20476) (1.27401) (-1.39984) (-1.58606) (1.72404)
(-0.41946)
D(LD2(-1)) -0.009276 -0.014194 -0.015241 1.177110 0.694806
6.053097 0.203100
(0.03107) (0.06437) (0.15916) (0.56084) (0.19074) (1.76491)
(0.17915)
(-1.29857) (-0.22048) (-0.09575) (2.09885) (3.64263) (3.42968)
(1.13366)
D(LD2(-2)) 0.008055 0.024226 0.076539 4.747023 1.085077 -5.610636
0.460794
(0.05112) (0.10592) (0.26188) (0.92279) (0.31384) (2.90395)
(0.29478)
(1.15757) (0.22872) (0.29226) (5.14421) (3.45737) (-1.93207)
(1.56320)
D(LI2(-1)) 0.020320 0.042180 0.076905 -2.791466 -0.330022
6.800664 -0.233518
(0.05029) (0.10421) (0.25765) (0.90787) (0.30877) (2.85700)
(0.29001)
(1.40402) (0.40477) (0.29849) (-3.07475) (-1.06883) (2.38036)
(-0.80521)
D(LI2(-2)) -0.015018 -0.047471 -0.107140 -1.668803 -0.463985
4.041318 -0.111440
(0.02944) (0.06099) (0.15079) (0.53135) (0.18071) (1.67211)
(0.16973)
(-1.51020) (-0.77834) (-0.71050) (-3.14070) (-2.56752) (2.41689)
(-0.65656)
|
D(LV2(-1)) -0.001844
|
-0.003126
|
-0.011455
|
-0.427682
|
-0.146341
|
0.276840
|
-0.046336
|
|
(0.00524)
|
(0.01085)
|
(0.02683)
|
(0.09454)
|
(0.03215)
|
(0.29752)
|
(0.03020)
|
|
(-1.35199)
|
(-0.28802)
|
(-0.42694)
|
(-4.52363)
|
(-4.55113)
|
(0.93048)
|
(-1.53425)
|
|
D(LV2(-2)) -0.001427
|
-0.002837
|
-0.007876
|
-0.128724
|
-0.014954
|
0.296812
|
-0.000135
|
|
(0.00239)
|
(0.00495)
|
(0.01223)
|
(0.04310)
|
(0.01466)
|
(0.13562)
|
(0.01377)
|
|
(-1.59778)
|
(-0.57342)
|
(-0.64394)
|
(-2.98684)
|
(-1.02024)
|
(2.18850)
|
(-0.00978)
|
|
D(LH2(-1)) 0.018070
|
0.028494
|
0.083517
|
-0.172621
|
-0.322004
|
3.088715
|
0.311525
|
|
(0.05039)
|
(0.10440)
|
(0.25813)
|
(0.90958)
|
(0.30935)
|
(2.86237)
|
(0.29055)
|
|
(1.35861)
|
(0.27292)
|
(0.32354)
|
(-0.18978)
|
(-1.04090)
|
(1.07908)
|
(1.07218)
|
|
D(LH2(-2)) 0.081498
|
0.164966
|
0.400315
|
-0.642171
|
0.377409
|
0.273855
|
0.049255
|
|
(0.04051)
|
(0.08394)
|
(0.20755)
|
(0.73133)
|
(0.24873)
|
(2.30145)
|
(0.23362)
|
|
(2.01160)
|
(1.96518)
|
(1.92877)
|
(-0.87809)
|
(1.51735)
|
(0.11899)
|
(0.21084)
|
|
C -3.479734
|
-7.167479
|
-18.20827
|
54.37015
|
11.44097
|
-1041.779
|
4.755857
|
|
(3.73536)
|
(7.73964)
|
(19.1359)
|
(67.4281)
|
(22.9326)
|
(212.192)
|
(21.5392)
|
|
(-0.93157)
|
(-0.92607)
|
(-0.95152)
|
(0.80634)
|
(0.49890)
|
(-4.90962)
|
(0.22080)
|
|
R-squared 0.594193
|
0.457167
|
0.513991
|
0.762676
|
0.921324
|
0.978836
|
0.712030
|
|
Adj. R-squared 0.213750
|
-0.051740
|
0.058357
|
0.540185
|
0.847565
|
0.958995
|
0.442058
|
|
Sum sq. resids 481.1805
|
2065.783
|
12628.18
|
156792.7
|
18136.33
|
1552744.
|
15999.38
|
|
S.E. equation 5.483957
|
11.36272
|
28.09379
|
98.99266
|
33.66779
|
311.5229
|
31.62216
|
|
F-statistic 1.561844
|
0.898332
|
1.128079
|
3.427890
|
12.49105
|
49.33315
|
2.637420
|
|
Log likelihood -88.77414
|
-112.0865
|
-141.0532
|
-181.3571
|
-146.8450
|
-218.0428
|
-144.8391
|
|
Akaike AIC 6.548384
|
8.005406
|
9.815827
|
12.33482
|
10.17781
|
14.62768
|
10.05245
|
|
Schwarz SC 7.281252
|
8.738274
|
10.54869
|
13.06769
|
10.91068
|
15.36054
|
10.78531
|
|
Mean dependent 2.456250
|
2.759375
|
8.778125
|
55.48438
|
108.6562
|
24.09375
|
43.17531
|
|
S.D. dependent 6.184629
|
11.07971
|
28.95125
|
145.9860
|
86.23284
|
1538.400
|
42.33474
|
|
Determinant Residual
|
6.70E+13
|
|
|
|
|
|
|
Covariance
|
|
|
|
|
|
|
|
Log Likelihood
|
-827.2228
|
|
|
|
|
|
|
Akaike Information Criteria
|
59.13893
|
|
|
|
|
|
|
Schwarz Criteria
|
64.58963
|
|
|
|
|
|
ADF TEST échantillon 3(Pays en
développés) LY3 en Différence : I (1)
ADF Test Statistic -3.773341 1% Critical Value* -4.2712
5% Critical Value -3.5562
10% Critical Value -3.2109
*MacKinnon critical values for rejection of hypothesis of a unit
root.
Augmented Dickey-Fuller Test Equation
Dependent Variable: D(LY3,2)
Method: Least Squares
Date: 02/04/09 Time: 19:18
Sample(adjusted): 1973 2004
Included observations: 32 after adjusting endpoints
|
Variable
|
Coefficient
|
Std. Error
|
t-Statistic
|
Prob.
|
|
D(LY3(-1))
|
-0.972162
|
0.257640
|
-3.773341
|
0.0008
|
|
D(LY3(-1),2)
|
0.021316
|
0.187141
|
0.113904
|
0.9101
|
|
C
|
6.510794
|
2.931691
|
2.220832
|
0.0346
|
@TREND(1970) -0.222870 0.129311 -1.723518 0.0958
R-squared 0.478534 Mean dependent var -0.006250
Adjusted R-squared 0.422663 S.D. dependent var 8.018846
S.E. of regression 6.092936 Akaike info criterion 6.568606
Sum squared resid 1039.468 Schwarz criterion 6.751823
Log likelihood -101.0977 F-statistic 8.564936
Durbin-Watson stat 2.006797 Prob(F-statistic) 0.000341
LL3 en Différence : I(1)
ADF Test Statistic -4.212604 1% Critical Value* -4.2712
5% Critical Value -3.5562
10% Critical Value -3.2109
*MacKinnon critical values for rejection of hypothesis of a unit
root.
Augmented Dickey-Fuller Test Equation
Dependent Variable: D(LL3,2)
Method: Least Squares
Date: 02/04/09 Time: 19:19
Sample(adjusted): 1973 2004
Included observations: 32 after adjusting endpoints
Variable Coefficient Std. Error t-Statistic Prob.
D(LL3(-1)) -1.160269 0.275428 -4.212604 0.0002
D(LL3(-1),2) 0.078991 0.187964 0.420247 0.6775
C 8.978357 4.927039 1.822262 0.0791
@TREND(1970) -0.312605 0.227679 -1.373008 0.1806
R-squared 0.541525 Mean dependent var 0.015625
Adjusted R-squared 0.492403 S.D. dependent var 15.83239
S.E. of regression 11.27992 Akaike info criterion 7.800394
Sum squared resid 3562.626 Schwarz criterion 7.983611
Log likelihood -120.8063 F-statistic 11.02401
Durbin-Watson stat 2.019605 Prob(F-statistic) 0.000059
LC3 en Différence : I(1)
ADF Test Statistic -4.195187 1% Critical Value* -4.2712
5% Critical Value -3.5562
10% Critical Value -3.2109
*MacKinnon critical values for rejection of hypothesis of a unit
root.
Augmented Dickey-Fuller Test Equation
Dependent Variable: D(LC3,2)
Method: Least Squares
Date: 02/04/09 Time: 19:21
Sample(adjusted): 1973 2004
Included observations: 32 after adjusting endpoints
Variable Coefficient Std. Error t-Statistic Prob.
D(LC3(-1)) -1.148938 0.273871 -4.195187 0.0002
D(LC3(-1),2) 0.083708 0.188148 0.444906 0.6598
C 28.36144 13.34173 2.125770 0.0425
@TREND(1970) -0.987474 0.603956 -1.635009 0.1132
R-squared 0.533863 Mean dependent var -0.025000
Adjusted R-squared 0.483920 S.D. dependent var 40.50511
S.E. of regression 29.09835 Akaike info criterion 9.695708
Sum squared resid 23707.99 Schwarz criterion 9.878925
Log likelihood -151.1313 F-statistic 10.68940
Durbin-Watson stat 2.017042 Prob(F-statistic) 0.000074
LD3 en Différence : I(1)
ADF Test Statistic -3.802972 1% Critical Value* -4.2712
5% Critical Value -3.5562
10% Critical Value -3.2109
*MacKinnon critical values for rejection of hypothesis of a unit
root.
Augmented Dickey-Fuller Test Equation
Dependent Variable: D(LD3,2)
Method: Least Squares
Date: 02/04/09 Time: 19:23
Sample(adjusted): 1973 2004
Included observations: 32 after adjusting endpoints
|
Variable
|
Coefficient
|
|
D(LD3(-1))
|
-1.062865
|
|
D(LD3(-1),2)
|
-0.029454
|
|
C
|
70.09658
|
|
@TREND(1970)
|
-0.601964
|
|
R-squared
|
0.547960
|
|
Adjusted R-squared
|
0.499527
|
|
S.E. of regression
|
152.7441
|
|
Sum squared resid
|
653261.0
|
|
Log likelihood
|
-204.1900
|
|
Durbin-Watson stat
|
2.003002
|
|
Std. Error t-Statistic
|
Prob.
|
|
0.279483 -3.802972
|
0.0007
|
|
0.188847 -0.155967
|
0.8772
|
|
63.10635 1.110769
|
0.2761
|
|
2.928265 -0.205570
|
0.8386
|
|
Mean dependent var
|
0.465625
|
|
S.D. dependent var
|
215.9106
|
|
Akaike info criterion
|
13.01187
|
|
Schwarz criterion
|
13.19509
|
|
F-statistic
|
11.31379
|
|
Prob(F-statistic)
|
0.000049
|
|
1% Critical Value*
|
-4.2712
|
|
5% Critical Value
|
-3.5562
|
|
10% Critical Value
|
-3.2109
|
LI3 en Différence : I(1)
ADF Test Statistic -3.855490
*MacKinnon critical values for rejection of hypothesis of a unit
root.
Augmented Dickey-Fuller Test Equation
Dependent Variable: D(LI3,2)
Method: Least Squares
Date: 02/04/09 Time: 20:06
Sample(adjusted): 1973 2004
Included observations: 32 after adjusting endpoints
|
Variable
|
Coefficient
|
Std. Error
|
t-Statistic
|
Prob.
|
|
D(LI3(-1))
|
-1.049021
|
0.272085
|
-3.855490
|
0.0006
|
|
D(LI3(-1),2)
|
0.015051
|
0.189173
|
0.079564
|
0.9371
|
|
C
|
175.5644
|
149.9251
|
1.171014
|
0.2515
|
|
@TREND(1970)
|
-7.019125
|
7.137056
|
-0.983476
|
0.3338
|
R-squared 0.516330 Mean dependent var -0.656250
Adjusted R-squared 0.464508 S.D. dependent var 491.4087
S.E. of regression 359.5996 Akaike info criterion 14.72433
Sum squared resid 3620733. Schwarz criterion 14.90755
Log likelihood -231.5893 F-statistic 9.963572
Durbin-Watson stat 1.997958 Prob(F-statistic) 0.000123
LV3 en Différence : I(1)
ADF Test Statistic -4.853837 1% Critical Value* -4.2712
5% Critical Value -3.5562
10% Critical Value -3.2109
*MacKinnon critical values for rejection of hypothesis of a unit
root.
Augmented Dickey-Fuller Test Equation
Dependent Variable: D(LV3,2)
Method: Least Squares
Date: 02/04/09 Time: 19:24
Sample(adjusted): 1973 2004
Included observations: 32 after adjusting endpoints
Variable Coefficient Std. Error t-Statistic Prob.
D(LV3(-1)) -1.470098 0.302873 -4.853837 0.0000
D(LV3(-1),2) 0.128508 0.187626 0.684916 0.4990
C 554.6303 612.9929 0.904791 0.3733
@TREND(1970) -28.06257 29.70124 -0.944828 0.3528
R-squared 0.656903 Mean dependent var -0.412500
Adjusted R-squared 0.620142 S.D. dependent var 2466.083
S.E. of regression 1519.911 Akaike info criterion 17.60716
Sum squared resid 64683649 Schwarz criterion 17.79038
Log likelihood -277.7146 F-statistic 17.86982
Durbin-Watson stat 2.023657 Prob(F-statistic) 0.000001
LH3 en Différence : I(1)
ADF Test Statistic -3.239488 1% Critical Value* -4.2712
5% Critical Value -3.5562
10% Critical Value -3.2109
*MacKinnon critical values for rejection of hypothesis of a unit
root.
Augmented Dickey-Fuller Test Equation
Dependent Variable: D(LH3,2)
Method: Least Squares
Date: 02/04/09 Time: 19:25
Sample(adjusted): 1973 2004
Included observations: 32 after adjusting endpoints
Variable Coefficient Std. Error t-Statistic Prob.
D(LH3(-1)) -0.850540 0.262554 -3.239488 0.0031
D(LH3(-1),2) 0.003121 0.198037 0.015762 0.9875
C -12.21893 13.06156 -0.935487 0.3575
@TREND(1970) 2.676849 0.928269 2.883698 0.0075
R-squared 0.411674 Mean dependent var 3.956875
Adjusted R-squared 0.348639 S.D. dependent var 39.76432
S.E. of regression 32.09256 Akaike info criterion 9.891594
Sum squared resid 28838.10 Schwarz criterion 10.07481
Log likelihood -154.2655 F-statistic 6.530895
Durbin-Watson stat 1.960378 Prob(F-statistic) 0.001731
Stationnarité du résidu, échantillon3
ADF Test Statistic -2.878571 1% Critical Value* -2.6344
5% Critical Value -1.9514
10% Critical Value -1.6211
*MacKinnon critical values for rejection of hypothesis of a unit
root.
Augmented Dickey-Fuller Test Equation
Dependent Variable: D(RESID03)
Method: Least Squares
Date: 01/04/80 Time: 00:13
Sample(adjusted): 1972 2004
Included observations: 33 after adjusting endpoints
|
Variable
|
Coefficient
|
Std. Error t-Statistic
|
Prob.
|
|
RESID03(-1)
|
-0.390170
|
0.135543 -2.878571
|
0.0072
|
|
D(RESID03(-1))
|
0.293456
|
0.173179 1.694530
|
0.1002
|
|
R-squared
|
0.217972
|
Mean dependent var
|
-0.044206
|
|
Adjusted R-squared
|
0.192745
|
S.D. dependent var
|
2.469471
|
|
S.E. of regression
|
2.218755
|
Akaike info criterion
|
4.490461
|
|
Sum squared resid
|
152.6091
|
Schwarz criterion
|
4.581158
|
|
Log likelihood
|
-72.09261
|
Durbin-Watson stat
|
2.105107
|
Estimation de MVCE (échantillon 3)
Date: 02/14/09 Time: 09:25
Sample(adjusted): 1973 2004
Included observations: 32 after adjusting endpoints Standard
errors & t-statistics in parentheses
Cointegrating Eq: CointEq1
LY3(-1) 1.000000
LL3(-1) 0.133676
(0.04212)
(3.17353)
|
LC3(-1)
|
-0.358572
|
|
|
|
|
|
|
|
(0.01422)
|
|
|
|
|
|
|
|
(-25.2223)
|
|
|
|
|
|
|
|
LD3(-1)
|
-0.039942
|
|
|
|
|
|
|
|
(0.00266)
|
|
|
|
|
|
|
|
(-15.0220)
|
|
|
|
|
|
|
|
LI3(-1)
|
0.020455
|
|
|
|
|
|
|
|
(0.00225)
|
|
|
|
|
|
|
|
(9.09466)
|
|
|
|
|
|
|
|
LV3(-1)
|
0.006042
|
|
|
|
|
|
|
|
(0.00045)
|
|
|
|
|
|
|
|
(13.5034)
|
|
|
|
|
|
|
|
LH3(-1)
|
0.024097
|
|
|
|
|
|
|
|
(0.00217)
|
|
|
|
|
|
|
|
(11.1022)
|
|
|
|
|
|
|
|
C
|
25.57425
|
|
|
|
|
|
|
|
Error Correction:
|
D(LY3)
|
D(LL3)
|
D(LC3)
|
D(LD3)
|
D(LI3)
|
D(LV3)
|
D(LH3)
|
|
CointEq1
|
-0.430715
|
-0.580505
|
-1.418382
|
33.81925
|
16.59082
|
-90.44913
|
6.130396
|
|
(0.57113)
|
(1.18338)
|
(2.92584)
|
(10.3096)
|
(3.50635)
|
(32.4437)
|
(3.29331)
|
|
(-2.75415)
|
(-2.49055)
|
(-2.48478)
|
(3.28035)
|
(4.73165)
|
(-2.78788)
|
(1.86147)
|
|
D(LY3(-1))
|
1.128497
|
1.081714
|
3.898838
|
34.83750
|
22.10816
|
-33.25280
|
24.75070
|
|
(2.39546)
|
(4.96337)
|
(12.2717)
|
(43.2411)
|
(14.7065)
|
(136.077)
|
(13.8129)
|
|
(1.47110)
|
(1.21794)
|
(1.31771)
|
(1.80566)
|
(1.50329)
|
(-0.24437)
|
(1.79185)
|
|
D(LY3(-2))
|
-1.677219
|
-2.684125
|
-7.688464
|
104.4778
|
34.29288
|
-367.7833
|
2.516808
|
|
(2.14145)
|
(4.43707)
|
(10.9704)
|
(38.6560)
|
(13.1471)
|
(121.648)
|
(12.3482)
|
|
(-1.78322)
|
(-1.60493)
|
(-1.70083)
|
(2.70276)
|
(2.60841)
|
(-3.02335)
|
(0.20382)
|
|
D(LL3(-1))
|
-1.284150
|
-1.598436
|
-5.311541
|
78.68691
|
-0.942130
|
-232.0976
|
4.355496
|
|
(1.67451)
|
(3.46958)
|
(8.57837)
|
(30.2272)
|
(10.2804)
|
(95.1227)
|
(9.65575)
|
|
(-1.76688)
|
(-0.46070)
|
(-0.61918)
|
(2.60319)
|
(-0.09164)
|
(-2.43998)
|
(0.45108)
|
|
D(LL3(-2))
|
-2.190368
|
-4.362032
|
-10.97016
|
33.42845
|
11.18970
|
-91.53003
|
5.796280
|
|
(1.51369)
|
(3.13636)
|
(7.75449)
|
(27.3241)
|
(9.29304)
|
(85.9871)
|
(8.72840)
|
|
(-1.44704)
|
(-1.39080)
|
(-1.41468)
|
(1.22340)
|
(1.20409)
|
(-1.06446)
|
(0.66407)
|
|
D(LC3(-1))
|
0.234009
|
0.314965
|
1.125616
|
-33.11707
|
-1.052314
|
105.0301
|
-5.943697
|
|
(1.01616)
|
(2.10548)
|
(5.20569)
|
(18.3430)
|
(6.23854)
|
(57.7242)
|
(5.85949)
|
|
(1.23029)
|
(0.14959)
|
(0.21623)
|
(-1.80543)
|
(-0.16868)
|
(1.81951)
|
(-1.01437)
|
|
D(LC3(-2))
|
1.192081
|
2.263658
|
5.918494
|
-22.91446
|
-8.830030
|
88.81067
|
-2.193364
|
|
(0.90682)
|
(1.87893)
|
(4.64556)
|
(16.3693)
|
(5.56727)
|
(51.5131)
|
(5.22900)
|
|
(1.31457)
|
(1.20476)
|
(1.27401)
|
(-1.39984)
|
(-1.58606)
|
(1.72404)
|
(-0.41946)
|
|
D(LD3(-1))
|
-0.009276
|
-0.014194
|
-0.015241
|
1.177110
|
0.694806
|
6.053097
|
0.203100
|
|
(0.03107)
|
(0.06437)
|
(0.15916)
|
(0.56084)
|
(0.19074)
|
(1.76491)
|
(0.17915)
|
|
(-1.29857)
|
(-0.22048)
|
(-0.09575)
|
(2.09885)
|
(3.64263)
|
(3.42968)
|
(1.13366)
|
|
D(LD3(-2))
|
0.008055
|
0.024226
|
0.076539
|
4.747023
|
1.085077
|
-5.610636
|
0.460794
|
|
(0.05112)
|
(0.10592)
|
(0.26188)
|
(0.92279)
|
(0.31384)
|
(2.90395)
|
(0.29478)
|
|
(1.15757)
|
(0.22872)
|
(0.29226)
|
(5.14421)
|
(3.45737)
|
(-1.93207)
|
(1.56320)
|
|
D(LI3(-1))
|
0.020320
|
0.042180
|
0.076905
|
-2.791466
|
-0.330022
|
6.800664
|
-0.233518
|
|
(0.05029)
|
(0.10421)
|
(0.25765)
|
(0.90787)
|
(0.30877)
|
(2.85700)
|
(0.29001)
|
|
(1.40402)
|
(0.40477)
|
(0.29849)
|
(-3.07475)
|
(-1.06883)
|
(2.38036)
|
(-0.80521)
|
|
D(LI3(-2)) -0.015018
|
-0.047471
|
-0.107140
|
-1.668803
|
-0.463985
|
4.041318
|
-0.111440
|
|
(0.02944)
|
(0.06099)
|
(0.15079)
|
(0.53135)
|
(0.18071)
|
(1.67211)
|
(0.16973)
|
|
(-1.51020)
|
(-0.77834)
|
(-0.71050)
|
(-3.14070)
|
(-2.56752)
|
(2.41689)
|
(-0.65656)
|
|
D(LV3(-1)) -0.001844
|
-0.003126
|
-0.011455
|
-0.427682
|
-0.146341
|
0.276840
|
-0.046336
|
|
(0.00524)
|
(0.01085)
|
(0.02683)
|
(0.09454)
|
(0.03215)
|
(0.29752)
|
(0.03020)
|
|
(-1.35199)
|
(-0.28802)
|
(-0.42694)
|
(-4.52363)
|
(-4.55113)
|
(0.93048)
|
(-1.53425)
|
|
D(LV3(-2)) -0.001427
|
-0.002837
|
-0.007876
|
-0.128724
|
-0.014954
|
0.296812
|
-0.000135
|
|
(0.00239)
|
(0.00495)
|
(0.01223)
|
(0.04310)
|
(0.01466)
|
(0.13562)
|
(0.01377)
|
|
(-1.59778)
|
(-0.57342)
|
(-0.64394)
|
(-2.98684)
|
(-1.02024)
|
(2.18850)
|
(-0.00978)
|
|
D(LH3(-1)) 0.018070
|
0.028494
|
0.083517
|
-0.172621
|
-0.322004
|
3.088715
|
0.311525
|
|
(0.05039)
|
(0.10440)
|
(0.25813)
|
(0.90958)
|
(0.30935)
|
(2.86237)
|
(0.29055)
|
|
(1.35861)
|
(0.27292)
|
(0.32354)
|
(-0.18978)
|
(-1.04090)
|
(1.07908)
|
(1.07218)
|
|
D(LH3(-2)) 0.081498
|
0.164966
|
0.400315
|
-0.642171
|
0.377409
|
0.273855
|
0.049255
|
|
(0.04051)
|
(0.08394)
|
(0.20755)
|
(0.73133)
|
(0.24873)
|
(2.30145)
|
(0.23362)
|
|
(2.01160)
|
(1.96518)
|
(1.92877)
|
(-0.87809)
|
(1.51735)
|
(0.11899)
|
(0.21084)
|
|
C -3.479734
|
-7.167479
|
-18.20827
|
54.37015
|
11.44097
|
-1041.779
|
4.755857
|
|
(3.73536)
|
(7.73964)
|
(19.1359)
|
(67.4281)
|
(22.9326)
|
(212.192)
|
(21.5392)
|
|
(-0.93157)
|
(-0.92607)
|
(-0.95152)
|
(0.80634)
|
(0.49890)
|
(-4.90962)
|
(0.22080)
|
|
R-squared 0.594193
|
0.457167
|
0.513991
|
0.762676
|
0.921324
|
0.978836
|
0.712030
|
|
Adj. R-squared 0.213750
|
-0.051740
|
0.058357
|
0.540185
|
0.847565
|
0.958995
|
0.442058
|
|
Sum sq. resids 481.1805
|
2065.783
|
12628.18
|
156792.7
|
18136.33
|
1552744.
|
15999.38
|
|
S.E. equation 5.483957
|
11.36272
|
28.09379
|
98.99266
|
33.66779
|
311.5229
|
31.62216
|
|
F-statistic 1.561844
|
0.898332
|
1.128079
|
3.427890
|
12.49105
|
49.33315
|
2.637420
|
|
Log likelihood -88.77414
|
-112.0865
|
-141.0532
|
-181.3571
|
-146.8450
|
-218.0428
|
-144.8391
|
|
Akaike AIC 6.548384
|
8.005406
|
9.815827
|
12.33482
|
10.17781
|
14.62768
|
10.05245
|
|
Schwarz SC 7.281252
|
8.738274
|
10.54869
|
13.06769
|
10.91068
|
15.36054
|
10.78531
|
|
Mean dependent 2.456250
|
2.759375
|
8.778125
|
55.48438
|
108.6562
|
24.09375
|
43.17531
|
|
S.D. dependent 6.184629
|
11.07971
|
28.95125
|
145.9860
|
86.23284
|
1538.400
|
42.33474
|
|
Determinant Residual
|
6.70E+13
|
|
|
|
|
|
|
Covariance
|
|
|
|
|
|
|
|
Log Likelihood
|
-827.2228
|
|
|
|
|
|
|
Akaike Information Criteria
|
59.13893
|
|
|
|
|
|
|
Schwarz Criteria
|
64.58963
|
|
|
|
|
|
|
Année
|
Y1
|
BASE DE DONNEES
|
I1
|
V1
|
H1
|
|
L1
|
C1
|
D1
|
|
1970
|
2,48
|
1,955409145
|
0,17398024
|
0,08897383
|
6,76
|
0,23516362
|
0,027147143
|
|
1971
|
3,481254782
|
2,502147671
|
0,220153986
|
0,087986008
|
7,060540873
|
0,227584215
|
0,040903234
|
|
1972
|
4,436229205
|
2,861922267
|
0,261725209
|
0,091450845
|
7,323286688
|
0,224831944
|
0,046417827
|
|
1973
|
9,663716814
|
3,011920577
|
0,292980454
|
0,097273632
|
9,986292668
|
0,249916815
|
0,049117273
|
|
1974
|
10,5551969
|
1,713643873
|
0,177371978
|
0,10350574
|
17,83999027
|
0,233424625
|
0,000593449
|
|
1975
|
6,452554745
|
1,831257877
|
0,184592288
|
0,100800816
|
13,89068022
|
0,237098656
|
0,001328434
|
|
1976
|
7,240811849
|
1,798412274
|
0,179517387
|
0,09981993
|
17,14984599
|
0,017800344
|
0,000438279
|
|
1977
|
7,723785166
|
1,126671261
|
0,383334929
|
0,340236715
|
20,6751218
|
0,23318289
|
0,019927083
|
|
1978
|
7,668566002
|
1,18476262
|
0,403430463
|
0,34051586
|
20,5389471
|
0,255542645
|
0,017813568
|
|
1979
|
8,55567806
|
1,099004315
|
0,380281423
|
0,346023594
|
30,45402589
|
0,273523532
|
0,01563175
|
|
1980
|
9,343895998
|
1,336269229
|
0,455837381
|
0,341126901
|
53,53180304
|
0,280958501
|
0,03128371
|
|
1981
|
7,133568642
|
1,445270617
|
0,524352909
|
0,36280604
|
76,66580399
|
0,297226217
|
0,055243315
|
|
1982
|
6,866655107
|
1,618651053
|
0,555542417
|
0,343213206
|
80,75786089
|
0,286161698
|
0,070000349
|
|
1983
|
7,480123317
|
1,886426191
|
0,582842815
|
0,308966668
|
126,5704388
|
0,239807531
|
0,022345745
|
|
1984
|
7,321859903
|
2,021009838
|
0,526566246
|
0,260546107
|
186,4067688
|
0,188921453
|
-0,029133303
|
|
1985
|
7,61007174
|
1,450552511
|
0,597979239
|
0,412242393
|
222,4780662
|
0,248069967
|
0,041178274
|
|
1986
|
12,16993464
|
1,521538604
|
0,630994899
|
0,414708439
|
144,0878649
|
0,215282146
|
0,03776615
|
|
1987
|
5,803519403
|
1,500274956
|
0,490813131
|
0,327148786
|
229,1573175
|
0,199310767
|
0,030990519
|
|
1988
|
8,293864963
|
2,327566424
|
0,338527256
|
0,145442576
|
678,8782337
|
0,072882172
|
0,019334538
|
|
1989
|
4,841334418
|
1,901861416
|
0,436199278
|
0,229353871
|
38,0891526
|
0,052586425
|
0,030363585
|
|
1990
|
-8,129608071
|
1,675576176
|
0,423214066
|
0,252578231
|
-99,97580324
|
0,239609702
|
0,039084633
|
|
1991
|
-2,249208025
|
1,714613166
|
0,47479353
|
0,276909999
|
-1,234356819
|
0,248593393
|
0,042384295
|
|
1992
|
-1,382737388
|
3,446308062
|
0,751511435
|
0,218062756
|
4,645213411
|
0,232439437
|
0,020477582
|
|
1993
|
-17,19027276
|
8,440273589
|
3,516272394
|
0,416606447
|
-70,76042203
|
0,359893252
|
0,02738534
|
|
1994
|
2,738203897
|
10,47812479
|
1,973581796
|
0,188352576
|
12,38409555
|
0,286916264
|
0,011326924
|
|
1995
|
3,003849769
|
10,30667625
|
1,499170862
|
0,145456287
|
11,87246539
|
0,276024789
|
0,000642525
|
|
1996
|
3,9225
|
8,064016709
|
1,313183987
|
0,162844899
|
8,525
|
0,258814208
|
0,017407908
|
|
1997
|
3,542303159
|
10,2292127
|
1,735094379
|
0,169621498
|
5,920294863
|
0,266000226
|
0,028946935
|
|
1998
|
-0,055760138
|
10,5359761
|
1,869397624
|
0,177429942
|
5,339277947
|
0,223990512
|
0,034611099
|
|
1999
|
3,034811414
|
8,950226727
|
1,794723609
|
0,200522698
|
4,717662847
|
0,208730711
|
0,044224722
|
|
2000
|
-9,753401169
|
2,142479388
|
2,050016231
|
0,956842918
|
-21,13564669
|
0,228933999
|
0,27148131
|
|
2001
|
2,5
|
2,029399989
|
2,007506513
|
0,989211848
|
2,9
|
0,223508948
|
0,157146193
|
|
2002
|
3,87804878
|
2,145618696
|
2,051514238
|
0,956141108
|
2,830417881
|
0,20644482
|
0,205237528
|
|
2003
|
4,555059873
|
2,137216077
|
1,947181635
|
0,911083187
|
3,780271707
|
0,201296192
|
0,116251384
|
|
2004
|
4,536267685
|
2,143033463
|
1,852184015
|
0,864281425
|
3,11895276
|
0,215845202
|
0,00368972
|
|
Année
|
Y2
|
L2
|
|
D2
|
I2
|
V2
|
H2
|
|
1970
|
7,2
|
1,831471146
|
0,644967138
|
0,352157968
|
5,05
|
0,220786308
|
0,02453357
|
|
1971
|
7,20180045
|
1,811227506
|
0,671001048
|
0,370467568
|
5,641845592
|
0,220967302
|
0,032213478
|
|
1972
|
5,878236529
|
1,806357873
|
0,701015616
|
0,388082354
|
5,275675676
|
0,223588294
|
0,033955703
|
|
1973
|
6,807666887
|
1,84531989
|
0,701593349
|
0,380201478
|
7,202026426
|
0,229176769
|
0,036098603
|
|
1974
|
9,777227723
|
1,861177544
|
0,703998661
|
0,378254436
|
10,77974328
|
0,220104163
|
0,034150984
|
|
1975
|
11,78128523
|
1,803803755
|
0,71209817
|
0,394775855
|
11,01631406
|
0,191216417
|
0,031675323
|
|
1976
|
7,917297025
|
1,83311916
|
0,714757955
|
0,389913526
|
8,033025236
|
0,207236835
|
0,029303174
|
|
1977
|
7,61682243
|
1,856246521
|
0,727619503
|
0,391984305
|
8,02211007
|
0,208825303
|
0,030849323
|
|
1978
|
7,642205818
|
2,216100313
|
0,847380791
|
0,382374745
|
6,438551215
|
0,209885147
|
0,032011601
|
|
1979
|
8,793868495
|
2,182931615
|
0,851611491
|
0,390122844
|
9,397600435
|
0,214930249
|
0,036329733
|
|
1980
|
10,71560994
|
2,433104682
|
0,850198632
|
0,349429533
|
12,06389239
|
0,208996308
|
0,04133405
|
|
1981
|
8,774279973
|
2,399908799
|
0,846727292
|
0,352816446
|
10,23665007
|
0,194077389
|
0,040777029
|
|
1982
|
7,358374384
|
2,441349215
|
0,86245915
|
0,353271521
|
7,767260579
|
0,18528957
|
0,043334104
|
|
1983
|
5,448809865
|
2,477440653
|
0,884293156
|
0,356938179
|
5,051809753
|
0,181076417
|
0,031346844
|
|
1984
|
4,460157737
|
2,455864978
|
0,89595907
|
0,364824238
|
4,715975846
|
0,188328411
|
0,030793848
|
|
1985
|
4,139546993
|
2,45476463
|
0,910879468
|
0,371065908
|
4,370515329
|
0,179966721
|
0,036996123
|
|
1986
|
3,6
|
2,441568517
|
0,929165807
|
0,380561021
|
1,925
|
0,181100235
|
0,042493091
|
|
1987
|
3,257722008
|
2,440334965
|
0,966124122
|
0,39589816
|
2,877115526
|
0,182350262
|
0,040818863
|
|
1988
|
3,7391914
|
2,437405213
|
0,985522807
|
0,404332772
|
3,249648332
|
0,187876668
|
0,040190667
|
|
1989
|
4,235188105
|
2,438934084
|
0,986399882
|
0,404438926
|
4,791483859
|
0,090488995
|
0,034791198
|
|
1990
|
3,976658742
|
2,405857264
|
1,002120607
|
0,416533691
|
5,372292369
|
0,191545476
|
0,030764042
|
|
1991
|
3,949282893
|
1,970779677
|
1,000256084
|
0,507543332
|
-13,13076392
|
0,18839506
|
0,00579438
|
|
1992
|
3,039392122
|
1,991394325
|
0,985407738
|
0,494833055
|
4,188733751
|
0,17754598
|
0,003051534
|
|
1993
|
-26,39239278
|
1,906236204
|
0,953804522
|
0,500360092
|
-11,59889094
|
0,174368543
|
0,003572745
|
|
1994
|
3,137358292
|
1,933415729
|
0,957157262
|
0,495060243
|
2,273915316
|
0,183646884
|
-0,002987866
|
|
1995
|
2,249488753
|
1,901997219
|
0,97693991
|
0,513638979
|
2,223358037
|
0,18312048
|
0,005507464
|
|
1996
|
2
|
1,898249144
|
0,990730685
|
0,521918152
|
2,175
|
0,179029069
|
0,013398736
|
|
1997
|
2,794117647
|
1,901776965
|
1,002823038
|
0,527308437
|
1,712747737
|
0,180178668
|
0,029925539
|
|
1998
|
3,147353362
|
1,883657406
|
1,017726787
|
0,540292934
|
1,154678855
|
0,181398918
|
0,040143803
|
|
1999
|
2,727693019
|
0,924094606
|
0,972957281
|
1,052876269
|
1,165279429
|
0,166900818
|
0,030976899
|
|
2000
|
-9,9909991
|
2,126227044
|
0,977203373
|
0,559595026
|
-5,970850974
|
0,20675219
|
0,001581844
|
|
2001
|
1,9
|
2,063695077
|
1,302716632
|
0,585884103
|
1,76
|
0,802397224
|
-0,022716414
|
|
2002
|
2,183513248
|
2,067838438
|
1,119035398
|
0,592802232
|
1,547911558
|
0,181767902
|
-0,00883467
|
|
2003
|
1,944777911
|
2,018077439
|
1,123322014
|
0,707077674
|
1,717880484
|
0,18176283
|
6,00285E-05
|
|
2004
|
1,789919925
|
1,994301809
|
1,223154473
|
0,613038934
|
2,04567089
|
0,191084768
|
0,006275155
|
|
Année
|
Y3
|
L3
|
C3
|
D3
|
I3
|
V3
|
H3
|
|
1970
|
1,51
|
1,957313209
|
0,272155205
|
0,087954113
|
8,17
|
0,233219341
|
0,28257271
|
|
1971
|
-0,390320063
|
2,512817689
|
0,318510684
|
0,086956485
|
8,605194604
|
0,227608433
|
0,042934907
|
|
1972
|
2,821316615
|
2,877020243
|
0,112602625
|
0,091463249
|
9,453340479
|
0,224836185
|
0,047459323
|
|
1973
|
12,95731708
|
3,035276453
|
0,392793712
|
0,109745292
|
12,84375327
|
0,259977151
|
0,049255083
|
|
1974
|
11,50350878
|
1,721387928
|
0,217519169
|
0,102368253
|
24,35314693
|
0,233479773
|
0,001454517
|
|
1975
|
0,8245832224
|
1,852366242
|
0,192629118
|
0,099706756
|
16,21848739
|
0,237269412
|
0,001215494
|
|
1976
|
6,445155141
|
1,797952016
|
0,177718021
|
0,098844697
|
24,20261911
|
0,017163499
|
0,002341242
|
|
1977
|
7,853107345
|
1,005653287
|
0,334828158
|
0,562945919
|
29,18918171
|
0,236614667
|
0,018388232
|
|
1978
|
7,710366684
|
1,229321071
|
0,355811021
|
0,335988791
|
28,477636131
|
0,261571286
|
0,015938852
|
|
1979
|
8,346848249
|
0,965598924
|
0,325413162
|
0,341889932
|
40,26930647
|
0,280344467
|
0,013222266
|
|
1980
|
7,698940701
|
1,2431891405
|
0,415789808
|
0,340283765
|
68,60742964
|
0,288266296
|
0,030263093
|
|
1981
|
5,239695454
|
1,3872298737
|
0,495469503
|
0,363701066
|
92,71713069
|
0,306467924
|
0,056539434
|
|
1982
|
6,232631997
|
1,559420509
|
0,534118849
|
0,34251111
|
90,84631993
|
0,293202829
|
0,071861721
|
|
1983
|
10,12705521
|
1,855157675
|
0,569135056
|
0,306785274
|
136,0547068
|
0,242478193
|
0,021936441
|
|
1984
|
10,89243299
|
2,0084159
|
0,518988745
|
0,258407009
|
192,7175736
|
0,188933618
|
-0,030362612
|
|
1985
|
11,68910649
|
1,373067646
|
0,570925116
|
0,415802614
|
225,1881747
|
0,253958341
|
0,041539873
|
|
1986
|
21,56164384
|
1,459147632
|
0,608825478
|
0,417247347
|
144,6548156
|
0,217823619
|
0,037414695
|
|
1987
|
8,181203517
|
1,451173184
|
0,470482081
|
0,324208087
|
229,5332696
|
0,200036239
|
0,030570119
|
|
1988
|
12,35416669
|
2,320311087
|
0,323778156
|
0,139540839
|
679,2286736
|
0,070260724
|
0,018859096
|
|
1989
|
5,340255898
|
1,879326033
|
0,423340845
|
0,225262055
|
38,09144106
|
0,051700625
|
0,030260109
|
|
1990
|
-17,98979054
|
1,65373272
|
0,41283634
|
0,249639095
|
-99,98129757
|
0,240471322
|
0,039233791
|
|
1991
|
-8,749924877
|
1,807634522
|
0,567078943
|
0,278523952
|
2,264331236
|
0,249478196
|
0,042921491
|
|
1992
|
-6,578947368
|
3,477213161
|
0,749347672
|
0,215502369
|
4,759157773
|
0,232947254
|
0,02063879
|
|
1993
|
-5,264084607
|
9,184284793
|
3,75476861
|
0,408814624
|
-85,44764134
|
0,377153328
|
0,029600717
|
|
1994
|
2,336362512
|
11,28318743
|
2,008103475
|
0,177965782
|
27,63116031
|
0,290413528
|
0,011811701
|
|
1995
|
3,769424339
|
11,00392338
|
1,51075105
|
0,137292036
|
23,53304509
|
0,278084891
|
0,000534647
|
|
1996
|
5,855
|
8,463243455
|
1,319420529
|
0,155900114
|
14,885
|
0,260357334
|
0,017495449
|
|
1997
|
4,263309576
|
10,71570157
|
1,748330842
|
0,163155985
|
9,662676823
|
0,267551528
|
0,028929245
|
|
1998
|
-3,099019097
|
11,03402843
|
1,884897873
|
0,170825903
|
8,79142687
|
0,224765671
|
0,034510405
|
|
1999
|
3,34541208
|
9,418445946
|
1,803442011
|
0,191479786
|
7,442539219
|
0,209174499
|
0,044365273
|
|
2000
|
-9,514545537
|
2,142555592
|
2,060542047
|
0,961721626
|
-32,08828523
|
0,229151634
|
0,274129407
|
|
2001
|
3,3
|
2,129840013
|
2,017095206
|
0,994015096
|
4,05
|
0,217984628
|
0,158862619
|
|
2002
|
5,5528615
|
2,145981776
|
2,060646776
|
0,960239458
|
4,084574724
|
0,206663095
|
0,207131051
|
|
2003
|
7,052607398
|
2,13776848
|
1,954625978
|
0,914338612
|
5,747922438
|
0,201453598
|
0,117187639
|
|
2004
|
7,038626609
|
2,143694947
|
1,858414217
|
0,866921032
|
4,103907444
|
0,216031286
|
0,00367029
|
| 
