|

Scientia et Lux
B.P.155
Ruhengeri
Rwanda
T: +250788 90 30 30
: +250788 90 30 32
E:inesruhengeri@yahoo.fr
W: www.ines.ac.rw
AAAAAAAAAAAAAAAAAAAAAAAAAAAAAAAAAAAAAAAAAAAAAAAA
INSTITUT D'ENSEIGNEMENT SUPÉRIEUR DE RUHENGERI
Accredited by Ministerial Order NO
005/2010/Mineduc of 16 June 2010
______________________________________________________________
INSTITUT D'ENSEIGNEMENT SUPÉRIEUR DE RUHENGERI
FACULTY OF APPLIED FUNDAMANTAL SCIENCES
DEPARTMENT OF STATISTICS APPLIED TO
ECONOMY
THE ROLE OF THE USE OF IMPROVED AGRICULTURAL PRACTICES
IN ENSURING FOOD SECURITY IN RWANDA
Case study: BURERA District, CYANIKA sector
Period 2012-2013
.
Dissertation Submitted to the Faculty of statistics applied to
economy as a partial fulfilment of the award of a Degree of Engineering in
Statistics Applied to Economy
Submitted by
Mr. Emmanuel NSENGIYUMVA
Supervisor: NGABO Valence (M.sc.)
Musanze, 2014
DEDICATION
With love and gratitude, I dedicate this work to:
My family
My brothers and sister;
All beloved friends
And
All relatives
DECLARATION
I, Emmanuel NSENGIYUMVA, hereby declare that
this dissertation entitled «The role of the use of improved
agricultural practice in ensuring food security in Rwanda, case study: CYANIKA
sector, BURERA District» is submitted as a partial Fulfilment for
the award of a Degree of Engineering in Applied Fundamental sciences
The work is the result of my own investigations. All sections
of the text and results that have been obtained from other sources were fully
referenced. I understand that cheating and plagiarism constitute a breach of
the Institute regulations and will be dealt with accordingly
Candidate's Signature.....................
Date....../....../2014
APPROVAL
This is to affirm that this Research work entitled
«The role of the use of improved agricultural practice in ensuring
food security in Rwanda, case study: CYANIKA sector, BURERA District»
was carried out under my supervision.
Date......./....../2014
Signature: --------------------------------
Supervisor: NGABO Valence (M.sc.)
ACKNOWLEDGEMENT
The success of this research paper is attributed to
encouragement, kindness and guidance of many individuals, relatives and
friends.
My first gratitude is given to God, without whose love and
will, the journey towards this work would not have been completed.
I'm deeply indebted to my Supervisor Mr. Valence NGABO whose
guidance; correction and encouragement at all stages of his study were
indispensable for its completion
I also extend my special thanks to my Father NAHIMANA Gervais
and my late Mother Cecille MUKAKALISA who departed when we needed her most and
who left before enjoying the benefits of her sweat in bringing me up and
educating me.
It is also dedicated to my sister DUSABE Sarah and my all
young brothers who sacrificed a lot for me. Their love, advices and financial
support as well as prayers have been my encouragement during my studies in INES
RUHENGERI.
Sincere thanks are extended to the staff of the Department of
Statistics Applied tom economy, Faculty of applied statistics at INES-RUHENGERI
for their motivation and commitment to train future bright Statisticians
I also owe gratitude to all other people who rendered their
moral and intellectual support during my studies
Last but not least, I wish to extend my sincere thanks to my
classmates, work team, all friends and my relatives far and near for their
generous efforts without which this dissertation would not have been completed.
I will always recognize your support
To you all I just say thank you.
Mr. Emmanuel NSENGIYUMA
TABLE OF CONTENT
DEDICATION
2
DECLARATION
3
APPROVAL
4
ACKNOWLEDGEMENT
5
TABLE OF CONTENT
6
LIST OF ACRONYMS
11
RESUME
12
CHAPTER ONE: GENERAL INTRODUCTION
13
1.1 Introduction
13
1.2 Background of the study
14
1.3 Situation of the use of agricultural inputs in
Rwanda
17
1.3.1 Effect of the use of inputs on food
security
17
1.4.Fertilizer access has been improved through
financial assistance
18
1.5 Access to improved seeds-partnerships between
private & public sectors
18
1.6 Problem statement
19
1.6.1 Objective of study
20
1.6.2 General objective
20
1.6.3 Specific objective
20
1.6.4.Research questions
20
1.6.5 Hypothesis of the study
21
1.6.6 Scope of the study
21
1.6.7 Research delimitation in time
21
1.6.8 Research delimitation in space
21
1.6.9 Research delimitation in domain/field
21
1.7. Significance of the study
22
1.8. Choice of interest
22
1.8.1 Self interest
22
1.8.2 Academic interest
22
1.8.3 Social interest
22
1.8.4 Political interest
23
CHAPTER TWO: LITERATURE REVIEW
23
2.1 Introduction
23
2.2 Definition of key concepts
23
2.2.1. Improved agricultural practices
23
2.2.2 Fertilizer
23
2.2.1 Effect of the use of fertilizers on food
security
25
2.2.3. Pesticides
25
2.2.3.1 Integrated Pest and Disease Management
26
2.2.4 Food security
26
2.2.4.1. Nutritional security & income have
improved
27
2.2.4.2 One cow per poor family
27
2.2.4.3 Small Ruminants
27
2.2.4.4 School feeding and kitchen gardens in the
most vulnerable
27
2.2.5 Improved Seeds
27
CHAPTER THREE: RESEARCH METHODOLOGY
28
3.1 Introduction
28
3.2 Sources of data
29
3.3 Primary data
29
3.4 Secondary data
29
3.5 Study population
29
3.7 Population determination
30
3.8 Sample size and selection techniques
30
3.8.1 Stratified sampling
30
3.9 Allocation of sample (quantitative survey) per
cell
31
3.10 Elaboration of the Questionnaire
32
3.11 Interview Schedule
32
3.12.Method of Data Analysis
32
3.13.Qualitative analysis
32
3.14.Quantitative analysis
32
3.15.Data processing and analysis
33
CHAPTER ROUR: PRESENTATION OF THE FINDINGS
33
4.1. Introduction
33
4.2. Demographic perspective
33
Table 1: Respondents' demographics per gender, Head
of Household, Livelihood activity and level of education
33
4.3.: Proportion (%) of respondents views on the
cause of low productivity, who decide to harvest the production, who decide to
sell/consume the production and whether they are allowed to choose a buyer they
want (in the period of 2012-2013)
34
4.4. Respondents view on the use of improved seeds,
pesticides and fertilizers
35
4.5. Respondent's view on the crops grown before
and after the use of fertilizers
36
4.6. Observations on the crop production before and
after the use of Improved agricultural practices
37
4.7. Observations on food security
39
4.8 Situation of Food security in Cyanika
Sector
39
4.9. Challenges faced by farmers in the process of
applying agricultural inputs and Suggestions of farmers to improve the use of
agricultural inputs
41
4.9.1. Challenges faced by farmers in the process
of applying agricultural inputs
41
4.9.2. Suggestions of farmers to improve the use of
agricultural inputs
42
CHAPTER FIVE: CONCLUSION AND RECOMMENDATIONS.
42
5.1 Conclusion
42
5.2 Recommendations
44
5.2.1 Based on the findings of this study, the
following recommendation can be formulated:
44
5.3 Future research
45
5.4 References
46
APPENDICES
47
LIST OF TABLES
Table 1: Respondents' demographics per gender, Head
of Household, Livelihood activity and level of education
33
Table 2: respondents' views
34
Table 3: Food security situation in Cyanika
Sector
40
Table
4: Challenges faced by HH surveyed and suggestions
40
LIST OF FIGURES
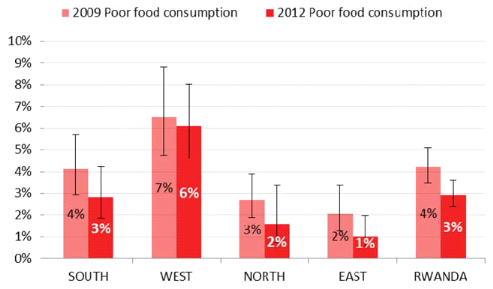
Figure 1: Food insecurity by province 2012 vs 2009
Confidence interval: 95%
16
Figure 2: Snapshot of the use of improved seeds,
pesticides and fertilizers
35
Figure
3: The proportions of crops grow before and after the use of fertilizers
36
Figure
4: The percentages of production before and after the use of agricultural
inputs
37
Figure
5: The proportion of the overall production before and after each agricultural
input
38
LIST OF ACRONYMS
MINAGRI - Ministere de l'Agriculture
MINICOM - Ministere de Commerce
CFCVA - Comprehensive Food Security
Vulnerability Analysis
NISR - National Institute of Statistics of
Rwanda
IFDC - International Fertilizer Division
Center
RAB - Rwanda Agricultural Board
EDPRS - Economic Development and Poverty
Reduction
EICV - Enquete Integrale sur la Codition de
Vie
NAS - National Agricultural Survey
SPSS - Statistical Package for Social
Sciences
GDP - Gross Domestic Product
CIP - Crop Intensification Program
HH - Household
FC - Food Consumption
GoR - Government of Rwanda
RESUME
L'agriculture est la colonne vertébrale de
l'économie de Rwanda et la majorité de maisons dans le pays prend
part à récolte ou activités de la production du
bétail. Le secteur de l'agriculture est considéré par
conséquent largement comme le catalyseur majeur pour croissance
économique et réduction de la pauvreté. En 2010-2011,
l'augmentation agricole était 3.2%, d'après l'Institut National
de Statistiques de Rwanda (NISR). Comme une part de produit intérieur
brut (PIB)
Le secteur de l'agriculture compose 31% du PIB de Rwanda, 70%
d'exportations,; emploi -80% de population et aussi l'agriculture fournit 90%
besoins de la nourriture nationaux. En mars 2013, 24% de maisons avait la
consommation de la nourriture ou pauvre ou limite comparée à mars
2012 quand ces catégories de maisons représentaient 23%. Cette
différence de l'insignifiance montre que la situation de la
sécurité de la nourriture totale est comparable à il y a
une année. (CFSVA 2013, Initiatives Nationales pour
sécurité de la nourriture et Nutrition) Il a été
trouvé que la productivité basse au Rwanda est principalement
attribuée pour mugir usage d'entrées. Dans un cycle violent, la
productivité basse continue à empêcher des fermiers
d'utiliser des entrées, comme beaucoup de fermiers à peine
produisez de la nourriture suffisante pour nourrir leur famille, et par
conséquent n'ayez pas de revenu avec lequel acheter cèdent
rehausser des entrées. Donc la solution s'allonge dans casser ce cycle
à travers intervention appropriée.
Révolution Verte en Asie (Les initiatives,
menées par Borlaug normand,) et ailleurs a été servi de
médiateur par la facilitation d'entrées modernes tel que les
graines améliorées, les engrais et les pesticides aux fermiers.
(CIP) Augmenter par conséquent productivité agricole et
sécurité de la nourriture au Rwanda exige de la reproduction de
telle adoption d'entrées modernes par les fermiers du petit cultivateur
à Augmenter productivité agricole et sécurité de la
nourriture. Mettre ceci comme le but, le Ministère d'Agriculture et
Ressources de l'Animal (MINAGRI) a développé le Programme de
l'Intensification de la Récolte (CIP) en 2007 (saison 2008A). Depuis
que la plupart des entrées ont être importé, le coût
de transport à régions éloignées combinées
avec la demande pauvre naturelle pour la nourriture des entrées les prix
des entrées haut. Le gouvernement avec l'aide de partenaires du
développement a vaincu cet obstacle à travers acquisition du
volume de graines améliorées et engrais de pays du neighbouring
et a distribué les entrées aux fermiers à travers un
réseau de public et associations privées.
CHAPTER ONE: GENERAL INTRODUCTION
1.1 Introduction
This chapter is about the introduction of the study,
background of the study, research problem statement, research questions,
hypotheses of the research, and objectives of the study scope of the research
study choice interest, methodology and the subdivision of the research.
The interest of this research came up when I was conducting my
fourth year internship in the Ministry of Agriculture and Animal Resources
(MINAGRI) in 2013. By getting to know what is all about, I found that it
undertakes a survey called Comprehensive food security vulnerability analysis
(CFSVA) aiming to gain a better understanding of the nature and degree of food
insecurity and malnutrition in the country. I went through CFSVA 2012; I found
that BURERA District is among 13 districts with highest share of households
with poor food consumption or borderline food consumption. I was interested and
motivated to find out whether food security has improved through the use of
inputs by consulting different reports, documents, dissertations related to
food security and input use, providing also a questionnaire to local people and
leaders for getting primary data.
1.2 Background of the
study
Agriculture is the backbone of
Rwanda's economy and the
majority of households in the country are engaged in crop or livestock
production activities. The agriculture sector is therefore widely regarded as
the major catalyst for economic growth and poverty reduction. In 2010-2011,
agricultural growth was 32%, according to the National Institute of Statistics
of Rwanda (NISR). As a share of gross domestic product (GDP)
The agriculture sector makes up 33% of Rwanda's GDP, 70% of
exports; employment 72% of population and also agriculture provides 90%
national food needs. In March 2013, 24% of households had either poor or
borderline food consumption compared to March 2012 when these categories of
households were representing 23%. This insignificance difference shows that the
overall food security situation is comparable to one year ago1(*).
It was found that low productivity in Rwanda is mainly
attributed to low use of improved agricultural practices. In a violent cycle,
the low productivity continues to prevent farmers from using improved
agricultural practices, as many farmers barely produce sufficient food to feed
their family, and therefore have no income with which to purchase yield
enhancing improved agricultural practices. Thus the solution lies in breaking
this cycle through appropriate intervention.
Green revolution in Asia (The initiatives, led by
Norman
Borlaug,) and elsewhere was mediated by the facilitation of modern
inputs such as improved seeds, fertilizers and pesticides to
farmers. In Rwanda CIP has increased agricultural productivity
and food security by a replication of such adoption of modern inputs by the
smallholder farmers to Increasing agricultural productivity and food security.
Setting this as the goal, the Ministry of Agriculture and Animal Resources
(MINAGRI) developed the Crop Intensification Program (CIP) in 2007 season
2008A.
Since most of the improved agricultural practices have to be
imported, the cost of transportation to remote areas combined with the natural
poor demand for inputs keep their prices high. The government with the help of
development partners overcame this obstacle through volume procurement of
improved seeds and fertilizers from neighbouring countries and distribute them
to farmers through a network of public and private partnerships.
a) A snapshot of Food
Security Situation in Rwanda
According to CFSVA 2012 report, it is clear that food
consumption score used as a preferred single indicator of current
household food security. So Households with poor or borderline food consumption
was considered to be food insecure while those with acceptable food consumption
on are food secure.
In March/April 2012, one in five Rwandan households (21%) had
unacceptable food consumption and could be considered to be food insecure. Out
of the total population, 4% had poor food consumption (82,000 households),
which represents an extremely insufficient and unbalanced diet, and 17%
borderline food consumption (378,000 households). These figures show clear
improvement since the 2006 CFSVA and seem to indicate a small, although not
confirmed, improvement in household food consumption since the last CFSVA and
Nutrition Survey was conducted in February/March 2009.
Household with Food Security was better in March 2012 than in
September (seasonality, and Household with food stocks) Food Security stable
since March 2012. Households with acceptable didn't change Food Consumption
between September 2012 and September 2013
Who are vulnerable / Food insecure2(*)
§ Vulnerable HHs are those Headed by women and elderly
headed by Divorced, widows, never married
§ HHs with little land (The less land households have the
more likely they are to be food insecure, and the more they need to cope with
lack of food)
§ HH having only 1 activity are worse off than those who
practice a combination of activities and HHs surviving with uncertain activity
(aid/gifts, Gathering, Daily labor) are more food insecure
§ The less the head of HH has formal education, the more
the households is food insecure
Where do the Food insecure / Vulnerable
live?
§ South & Western Provinces have a higher share of
food insecure HHS along all 7 rounds of FNSMS
§ Congo Nile Crest and surrounding areas seem to be more
food insecure
Why are they Food insecure / Vulnerable?
§ Diet in Rwanda is mainly based on Starches and pulses,
very little meat, poultry Milk and milk mainly consume in households with
acceptable FC HH with poor food consumption eat pulses and oil only 1 day per.
They do not consume sugar, milk, meat and fruit. HH with acceptable FC eat
starch and pulses 7 d/w, Vegetables and fat 5 d/w (oil, butter, ghee)
§ The less households spend the more likely they are to
be food insecure, this may be related to low income
§ More people are affected by shocks, more they are
vulnerable
§ More vulnerable HHs are affected by High food prices,
human illness or accident, loss or reduced HH income and death of a HH working
member
Figure 1: Food insecurity by
province 2012 vs 2009 Confidence interval: 95%

Food insecurity situation by District
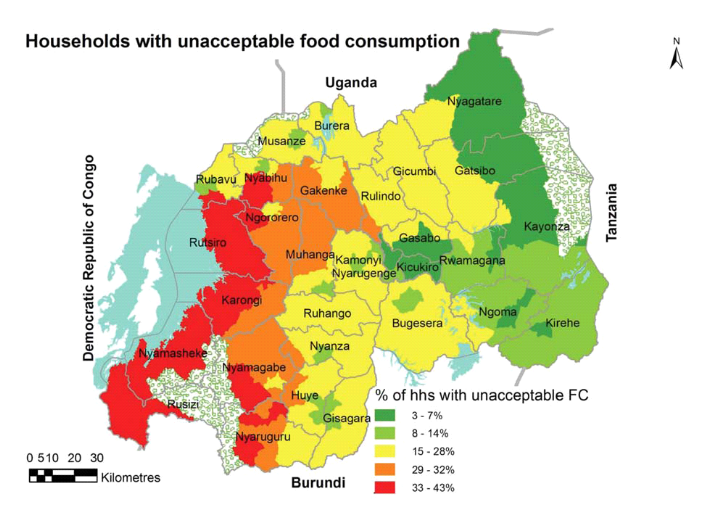
At district level, Rutsiro (53%), Ngororero (44%), Rusizi
(49%), Nyamasheke (37%) and Karongi (37%) have the highest percentages of
households with unacceptable consumption. The poorer districts tend to have the
highest share of households with poor food consumption and are located in the
western and southern provinces. Almost three in four (70%) households with poor
or borderline food consumption are in 13 districts Ngororero, Rutsiro, Karongi,
Rusizi, Gatsibo,Nyamasheke, Nyamagabe, Bugesera, Nyanza,Burera, Gakenke, Rubavu
and Rulindo.
Source: CFSVA and Nutrition Survey, 2009 and
2012
In the latest CFSVA report released in December 2012, it
pointed out that out
Source: CFSVA and Nutrition Survey, 2009 and
2012
In the latest CFSVA report released in December 2012, it
pointed out that out of the total population, 4 percent of Rwandan household's
equivalent to 82,000 homes, had poor food consumption, which represents an
extremely insufficient and unbalanced diet
«It is said that in March/April 2012, one in five
Rwandan households had unacceptable food consumption and could be considered to
be food insecure3(*)
This research has tackled the subject under the title
«the role of the use improved agricultural practice use
in ensuring food security in rural areas» a case study CYANIKA Sector,
BURERA District, Period 2012-2013
1.3 Situation of the use of
agricultural inputs in Rwanda
1.3.1 Effect of the use of inputs on food security
Access to agricultural inputs has long been slowing down the
farmers from raising productivity levels. The access was reduced by the low
demand and costs which are further amplified by the difficulties in
transportation to rural areas. To overcome these constraints, CIP took a
`supply-push' approach whereby the government initially supplies the inputs and
the farmers are convinced to use them to raising productivity
1.4.Fertilizer access has been improved through financial
assistance4(*)
Government has been purchasing fertilizers in bulk and selling
them to distribution companies at a subsidized price; the distributors then
sell them to smallholder farmers who are usually grouped in cooperatives. We
are now preparing to transfer the importing responsibilities to private
companies," Murekezi said.5(*)
The following measures has been taken
§ GoR bulk imports & smart transport subsidies ensure
availability
§ Private sector capacity-building: auction and
distribution network
§ Voucher system to ensure access
§ Land consolidation to maximize effect
§ Fertilizer use in target districts increased from 4 kg
to 19.9 kg /ha
§ Households using fertilizer increased from 25 to 44%
1.5 Access to improved
seeds-partnerships between private & public sectors
The government Rwanda has put in place different measures to
facilitate farmer's access improved seed in partnership with different
institutions. The following were set as priorities:
§ Creating demand, even among the poorest farmers
§ Drought resistance and Hybrid seed access
§ Conditional upon fertilizer purchases
§ Conditional upon fertilizer purchases
§ Maximizing effect of fertilizer subsidies
§ Developing local seed production
§ Ensuring sanitary & phyto-sanitary standards
§ Providing incentives, e.g. subsidized loans
§ Making research & technology
Due to the growing demographic pressure on land, the
agricultural lands in Rwanda are highly fragmented. Since the use of inputs
such as the improved seeds and fertilizer can be translated into profitability
for smallholder farmers only if the land fragmentation is overcome, the land
use patterns need to be organized. With the help of recent government's policy
reforms, the crop intensification program advocated consolidation of land use
by farmers. Under the land consolidation policy, farmers in a given area need
to grow specific food crops in a synchronized fashion that will improve the
productivity and environmental sustainability. It also required resettlement of
family housing in an administrative area (Umudugudu) from the agriculturally
productive lands.
At least 37.5 percent of the land in Rwanda needs to be
managed before being cultivated, and overall an estimated 39.1 percent of the
land has a high erosion risk. "We estimate that erosion affects [our]
ability to feed 40,000 persons per year," So far, measures against
erosion have been implemented and losses from erosion per year average close to
14 million tones of soil, according to the ministry (MINAGRI)6(*) Stable farming
system that has been used for several generations and has been able to supply
the nutritional and material needs so the Traditional farming is being replaced
by modern intensive farming systems hoping that An integration of farming
systems, combining the productivity of modern systems and the sustainability of
traditional systems, could help to preserve biological diversity and feed a
growing population without excessive damage to the environment. To improve
productivity and ensure food security
1.6 Problem statement
In Rwanda majority of the population depends on agricultural
activities being labor intensive, where in 2005/2006, the agricultural
population was estimated to be 89.6% of the total population and accounts for a
third of Rwanda's GDP agriculture is able to absorb a large pool of people,
especially the less educated that would find it difficult to get employment in
the industrial or service sectors7(*)
However, this large pool of people engaged in agricultural
sector does not prevent a large portion of the country's population to be
affected by chronic and transitory food insecurity. Due to traditional method
of agriculture, weather condition and soil erosion Food security situation in
Rwanda is highly linked up to severe recurring food shortage and famine. The
Rwandan Government has recently adopted new agriculture and land policies that
strive to increase the productivity in agricultural sector through the land use
consolidation and the use of improved agricultural practice
such as improved seeds, pesticides and fertilizers.
Thus the present research was conducted to find out the role
of the use of improved agricultural practice in ensuring food
security in rural areas especially Cyanika Sector Burera District.
1.6.1 Objective of
study
The objectives of this research are subdivided into general
and specific objectives
1.6.2 General objective
The general objective of this study is to analyze the role of
the use of improved agricultural practice in ensuring food security in rural
areas. Case study in CYANIKA Sector, BURERA District
1.6.3 Specific
objective
The specific objectives of study are:
1. To find out how the use of fertilizers has improved food
production in rural area of CYANIKA Sector
2. To analyze the contribution of the use of improved seeds in
promoting food security trough the increase in food production in rural area of
CYANIKA Sector
3. To find out how the use of pesticides has helped to
increase production in rural area CYANIKA sector
1.6.4. Research
questions
This research deals with the role of the use of agricultural
input in ensuring food security in rural areas. So research questions of this
study will be:
1. Does the use of fertilizers promoting food production in
CYANIKA Sector?
2. What is the effect of pesticides on food production in
CYANIKA Sector?
3. Does the use of improved seeds promote food security trough
the increase in food production in CYANIKA Sector?
1.6.5 Hypothesis of the
study
This is the proposal for an answer to the questions which one
puts in connection with the object of research, formulated in terms such that
the observation and the analysis can provide an answer
To answer my problem questions, the following hypotheses have
been proposed:
1. The use of fertilizers has significantly contribute to
improve food production in rural area of CYANIKA Sector
2. The utilization of improved seeds has promoting food
security trough the increase in food production in rural area CYANIKA Sector
3. The use of insect killer (pesticide) in agricultural
activity helped to raise up crop production in rural area CYANIKA sector
1.6.6 Scope of the
study
The subject is delimitated at three levels: Research
delimitation in time, research delimitation in space and research delimitation
in domain
1.6.7 Research delimitation
in time
The data used in the study was collected within the limited
period of two years, which is 2012 to 2013.
1.6.8 Research delimitation
in space
The study has been conducted within administrative boundaries
in Burera District especially in CYANIKA sector.
1.6.9 Research delimitation
in domain/field
The research had been conducted in order to underline the role
of the use of input in ensuring food security in rural area. The use of
improved agricultural practice and food security is being the one of important
economic activities; the domain of this research is consequently economic.
1.7. Significance of the
study
The result of the study will be to show how the use of
improved inputs contributed much on ensuring food security in CYANIKA sector.
It will help the researcher to acquire skills in the problem solving process
and using these skills in the forthcoming researches if conducted.
It will help the researcher to know how theories applied in
class are put in practical. The study will guide the interested future
researchers; since it indicated reality related to the role of the use of
improved agricultural practice in ensuring food security in rural area of
CYANIKA Sector
1.8. Choice of interest
The choice of this study was three fold: personal, social and
academic interest
1.8.1 Self interest
This research will help me to master the theoretical knowledge
acquired from the institution and also to get a general picture on the positive
impact of the use of input in promoting food consumption when it is used.
Having established the role of the use improved agricultural practice in
ensuring food security in rural areas especially CYANIKA sector, BURERA
District
1.8.2 Academic interest
This work was serving as a reference for other researcher's
wishing to conduct advanced research in these areas. Our subjects meet the
academic requirements that recommend that scientific work at the end of fifth
level of high education. This research helps future researchers to the
documentation according to the role of the use of input in ensuring food
security in rural areas.
1.8.3 Social interest
This study has a great importance to Rwandan society as it
provides information on the role of the use of input in rural areas and the
role of appropriate and proper use of inputs so as to increase agricultural
productivity and improve food security. This research also helps the society to
find out the problems related to the food insecure and has eventually release
useful recommendation to society of a country as a whole
1.8.4 Political interest
Politically, this study will help local leaders to find out
the driving factor that can lead especially CYANIKA Sector to be food secure
through the identification of the use of inputs in increasing their food
production
CHAPTER TWO: LITERATURE
REVIEW
2.1 Introduction
This chapter provides the ground framework of this research.
The contribution of the use of improved agricultural practice in ensuring food
security in Rwanda is evident. It is from this point of view that the present
chapter tries to put forward the relevant literature relating to this study by
different authors in books, reports and any published documents which were
available to the researcher.
2.2 Definition of key concepts
2.2.1.
Improved agricultural practices
Improved agricultural practices are the specific method which,
when applied to agriculture create food for consumers or further processing
that is safe and healthy
In this study, we emphasized it the most common used to help
farmers to increase their food production such as fertilizers, improved
seeds and pesticides
2.2.2 Fertilizer
Fertilizer is any organic or inorganic material of natural or
synthetic origin that is added to soil to supply one or more plant nutrients
essential to the growth of plants. Mined inorganic fertilizers have been used
for many centuries, whereas chemically synthesized inorganic fertilizers were
only widely developed during the
industrial
revolution.
Fertilizers are broadly divided into
organic
fertilizers (composed of organic plant or animal matter), or
inorganic
or commercial fertilizers. Plants can only absorb their required
nutrients if they
are present in easily dissolved chemical compounds. Both organic and inorganic
fertilizers provide the same needed chemical compounds. Organic fertilizers
provided other macro and micro plant nutrients and are released as the organic
matter decays--this may take months or years. Organic fertilizers nearly always
have much lower concentrations of plant nutrients and have the usual problems
of economical collection, treatment, transportation and distribution.
It should be acknowledged that organic resources are not the
substitutes for mineral fertilizers because they have low or rather
inaccessible nutrient content and are usually not abundantly available. They
however condition the soil and improve mineral fertilizer use efficiency. The
CIP should enhance the capacities of farmers and local entrepreneurs to
anticipate and adopt integrated soil fertility management practices. It is
important to note that women play an important role in such initiatives as they
are more receptive to environmentally sound practices.
Through largeness orders, CIP imported fertilizers and
distributed to farmers through various service providers. About 83% of
fertilizers were used by farmers growing maize, wheat, rice and potato. In
2009, CIP imported 14,427 tons and distributed to maize and wheat growers at
subsidized rates (50%) the overhead costs (transportation and administrative
costs) from Mumbasa to rural areas were covered by the government. CIP
continued to import and distribute in 2010 (33,500 t) and 2011 (22,000 t).
Through an auction process, the CIP auctions the imported fertilizers to
private distributors. To access these fertilizers at subsidized prices, CIP
distributes vouchers to farmers through service providers. The farmers buy
fertilizers from the distributor/dealer by presenting the vouchers. The
distributor transacts the vouchers at the financial bank outlets which in turn
collect from MINAGRI/MINICOM. Estimates suggest that as a result of these
efforts, the national average fertilizer use per year has increased from 8
Kg/Ha to 23 Kg/Ha in 20108(*)
2.2.1 Effect of the use of
fertilizers on food security
Rwanda has implemented several programs to increase
productivity in the agriculture sector, including working closely with IFDC on
projects to promote
ISFM
and increase fertilizer use. IFDC and the Ministry of Agriculture and Animal
Resources (MINAGRI) have collaborated to improve agricultural production and
increase agribusiness activity and farm wage employment. Increasing fertilizer
use in Rwanda has contributed to poverty reduction and improved the livelihoods
of many Rwandan smallholder farmers. Fertilizer use more than doubled, from 18
percent to 38.3 percent. (In one province the use of fertilizer was nearly 54
percent9(*).
Through bulk orders, CIP imported fertilizers and distributed
to farmers through various service providers. About 83% of fertilizers were
used by farmers growing maize, wheat, rice and potato. In 2009, CIP imported
14,427 tons and distributed to maize and wheat Growers at subsidized rates
(50%) the overhead costs (transportation and administrative Costs) from Mombasa
to rural
Areas were covered by the government. CIP continued to import
and distribute in 2010 (33,500 t) and 2011 (22,000 t).
Through an auction process, the CIP auctions imported
fertilizers to private distributors. To access these fertilizers at subsidized
prices, CIP distributes vouchers to farmers through service providers. The
farmers buy fertilizers from the distributor/dealer by presenting the vouchers.
The distributor transacts the vouchers at the financial bank outlets which in
turn collect from MINAGRI/ MINICOM. Estimates suggest that as a result of these
efforts, the national average fertilizer use per year has increased from 8
Kg/Ha to 23 Kg/Ha in 2010
2.2.3. Pesticides
Pesticides are substances meant for attracting, seducing,
destroying or diminish any
pest they are a
class of
biocide. The most common use
of pesticides is as plant protection products (also known as crop
protection products), which in general protect plants
from damaging influences such as weeds, diseases or insects.
2.2.3.1 Integrated Pest and
Disease Management
With the sudden growth in density of cropping under
intensification program, the pressure from pests and diseases has started to
influence yield levels. In rice for example, epidemics of blast disease and
hoppers occur frequently in different marshlands. To combat the pests and
diseases, smallholder farmer needs appropriate pesticides that can reduce the
impact on yields. The CIP shall take initiatives to ensure delivery of
pesticides in rural areas through the same delivery route of fertilizers. The
extension service shall focus more on creating the awareness of the type of
combat measures that the farmers need to take. Wherever possible, integration
of biological controls and other pest management practices that can provide the
sustainability under intensification process should be explored.
«Pesticides are important for crops and without them
it is hard to get good harvest, but they can also be dangerous for human life
once not well used because they are poisonous, that is why we urge farmers to
handle them cautiously,»10(*)
2.2.4 Food security
The Rome Declaration on World Food Security
and the World Food Summit Plan of Action, convened by the
United Nations Food and Agriculture Organization, resolved that
«food security exists when all people, at
all times, have physical and economic access to sufficient, safe and nutritious
food to meet their provisions needs and food preferences for an active
and healthy life Broadly, the concept of food security is built on
three pillars:
1. Food availability
Sufficient quantities of food are available to people on a
regular basis; Food availability to the people can be through
own production, purchases, Food Aid or gifts
2. Food accessibility
People have sufficient resources to obtain appropriate foods
for a nutritious diet;
Unfortunately, attainment of self sufficiency does not
automatically imply that household food security is achieved. Empirical
evidence shows that solving the food security issue from production (Supply
side) point of view, while overlooking the purchasing power (demand side) of
the people, does not solve the food security problem, with regard to
accessibility of sufficient food by vulnerable groups (KIPPRA, 2007)
3. Food utilization/Nutrition
People have sufficient knowledge of nutrition and care
practices and access to adequate water and sanitation to derive sustenance
food. There is a direct and cyclical relationship between poverty and food
insecurity, whereby poverty contributes to food insecurity, which contributes
to poor nutrition, health, and cognitive development, which in turn contribute
to poverty
2.2.4.1. Nutritional
security & income have improved
Through livestock ownership and productivity initiatives led
by the government of Rwanda currently revealed that Nutritional security &
income have improved through the following points:
2.2.4.2 One cow per poor
family
The One Cow per Poor Family initiative was introduced by
President Paul KAGAME, to increase income of the poor. The goal of this program
was in twofold:
1. Reducing poverty
2. Increasing productivity of land
As of 15 April 2008, the program has distributed more than
16,700 cows since 2006. This program contributed to the increase in
agricultural production that leads to better farm income and improved food
security and human health
2.2.4.3 Small Ruminants
o Goats, Sheep, Piggery
o Poultry Extensive vaccination campaign
o Control of major disease
2.2.4.4 School feeding and
kitchen gardens in the most vulnerable
o One cup of milk
o Cows at schools and school gardens
o Kitchen Gardens
2.2.5 Improved Seeds
The use of improved seeds was not previously measured;
however, nearly 19 percent of households use them now to augment increases in
productivity of these crops, CIP imported improved seeds from neighboring
countries such as Kenya and Tanzania. In 2008, 765 tons of seeds of maize and
wheat were imported for cultivation in season A. The amount gradually increased
from 1200 t in 2009 A to 3512 t in 2011 A.
In addition, improved planting materials (cuttings) of cassava
and potato were also distributed to farmers. Under CIP, the use of improved
seeds by farmers has risen from 3% to 40%. By encouraging farmers to use
improved seeds, CIP has substantially increased the local demand and the
capacity for seed production. With the exception of hybrid seeds, the open
pollinated varieties of maize and self pollinated varieties of wheat, rice and
beans are multiplied by public (RAB) and entrepreneurial farmers in the
country11(*)
CHAPTER THREE: RESEARCH METHODOLOGY
3.1 Introduction
This chapter gives a detailed presentation of the tools and
techniques that were used to investigate the research issues in the field. It
includes spelling out the area of the study and study population. It further
describes the methods and techniques used in the choosing the sample size and
selection instruments like questionnaire, interviews and documentation were
used. It also includes data processing, analysis finally this chapter provides
the back ground against which the findings and conclusions of the study were
examined and appreciated regarding their reliability and validity.
This study was conducted on two categories of the citizens.
They include local leaders and farmers. The questionnaire was the core tool
used to collect data. However, interviews for local leaders were used to
complement quantitative data. More specifically, a questionnaire were used to
measure the use of agricultural inputs in their agricultural activities and
local leaders were interviewed in their respective office as they have relevant
knowledge on the use of agricultural inputs in the areas of concern
3.2 Sources of data
The study is based on both primary and secondary data sources
of information. Primary data for this research were collected through
interview guide for local leaders and distribution of questionnaire to
local farmers and secondary data were obtained trough different reports,
journals and distinctive official websites and other documents considered
necessary for this study were also consulted
3.3 Primary data
Most of data required to answer and validate the research
questions were collected from Primary source to generate the required data from
the primary source, different methodological approach such as interview
questions and questionnaire were employed to local farmers and local leaders of
CYANIKA Sector
3.4 Secondary data
Secondary data were obtained through reading and review of
published and unpublished documents, reports journals, newspapers and policy
reports relevant to the study referred to. Secondary data sources for this
research work were drawn from the official reports such as EDPRS I, EICV3,
CFSVA, and FNSMS, NAS 2008 among the others.Other documents considered
necessary for this study were also consulted
3.5 Study population12(*)
The population under study is the total population of CYANIKA
Sector of BUREREA District. CYANIKA Sector is among the 17 sectors of BURERA
District and this is one of 5 Districts of the Northern Province created by the
organic law n°29/2005 dated on 12/23/2005 related to administrative
entities of the Republic of Rwanda. The district is divided into 17 sectors. It
has 69 cells, 571 villages, 339,200 habitants grouped in 64.5 square
kilometers
CYANIKA Sector is located between RUGARAMA Sector and Republic
of Uganda it touches Virunga national park. It is divided into 6 cells such as
GASIZA, KABYINIRO, GISOVU, KAGITEGA, KAMANYANA, and NYAGAHINGA, 52 villages,
27,907 habitants with 52.6% are women and 47.4% are men all grouped in 64.5
square kilometers
3.7 Population determination
As it has been indicated above, given the width of this topic
under study, the population is also wide as it is located in rural areas where
agriculture dominates. Despite the fact that the population under this study is
derived from a selected farmers and local leaders
3.8 Sample size and
selection techniques
While selecting the sample size of the study; the researcher
purposively consulted 7 respondents particularly as local leaders and 89 local
farmers. Data was collected from the study population due to the reasons of
necessary and convenience.
To determine the sample size of the study, we have used the
technique of corrected sample proposed by Alain Bouchard and
since the population under study does not constitute homogeneous group then
stratified sampling techniques was applied so as to obtain a representative
sample
3.8.1 Stratified sampling
The study population was stratified into two strata; one
stratum was comprised of local leaders and local farmers around the sector.
From these two strata, the researcher used both simple random and purposive
sampling techniques as these enabled us to select respondents who could provide
the information needed for the study. In this study Local farmer's selection was done using simple
random sampling from the list of households available at the cell level. While
purposive sampling in this study was used to select local leaders
From the
official website of BURERA District, the total number of population of CYANIKA
sector is 29,907. From this number, we have calculated our
sample size using Alain Bouchard formula. For the sample size,
we have used the technique of corrected sample proposed by Alain
Bouchard quoted by MBONYINKEBE, 2011. In this formula, the author
suggest that if the population is greater than ten thousand, the corrected
sample is ninety six (96) individuals whereas for the population less than one
hundred thousand, the sample will be calculated by the following formula:

Where nc = corrected sample size
N=Total population of the sector n=corrected
sample
In our case, N= 29.907, n=96
Then, as  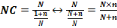 NC= NC=  = =   = 95.692 = 95.692  96 persons 96 persons
Therefore, the study will focus on 96 respondents including 7
local leaders and the rest will be local farmers the sample provides an
adequate figure for undertaking statistical analysis that falls within the
defined confidence levels in the limited boundaries of CYANIKA Sector in BURERA
District
3.9 Allocation of sample
(quantitative survey) per cell
As our study concerns people from CYANIKA sector, made up of 6
cells, we have calculated the sample size by cell using Javeau Formula as
follows
ni=????*????/??
With ni =sample size by cell
Ni=population by cell nc =corrected sample
N=population of CYANIKA sector. Then from the number of
population per cell, we have calculated the sample size per cell
Table1: Allocation of sample (quantitative survey) per
cell
|
No
|
Cells
|
Population
|
Sampling by Population
|
Household
|
Sampling by HH
|
|
1
|
GASIZA
|
5176
|
13
|
1089
|
13
|
|
2
|
KABYINIRO
|
6128
|
15
|
1279
|
16
|
|
3
|
GISOVU
|
5412
|
17
|
1485
|
18
|
|
4
|
KAGITEGA
|
6697
|
17
|
1372
|
17
|
|
5
|
KAMANYANA
|
6812
|
20
|
1722
|
21
|
|
6
|
NYAGAHINGA
|
7841
|
14
|
814
|
10
|
|
TOTAL
|
33,217
|
96
|
7,761
|
96
|
3.10 Elaboration of the
Questionnaire
We first contacted the local authorities to provide
information on the environment of the study and technical agronomists for pre
survey to gather information, before developing a survey questionnaire. The
field visit to the study area was made for better adapt the questionnaire to
the reality and achieve our objective. An interview with local farmers was used
to collect information for the study. The questionnaire was written in English
translated into Kinyarwanda to facilitate communication between interviewer and
the respondent. 89 respondents filled the questionnaire.
Source:
Office of the executive secretary of CYANIKA sector, 2014
3.11 Interview Schedule
In this study 7 respondent were interviewed. The questions
were prepared and read to the respondents then the answers recorded. This was
done face to face between the interviewer and the respondents conducted for the
purpose of obtaining the information related to the topic.
3.12.Method of Data
Analysis
Analysis of data provides sense for the Data collected during
the field work. The research strategies employed for this study combine both
qualitative and quantitative methods.
3.13. Qualitative
analysis
Most of answers asked to farmers were qualitative. But through
this method, I obtained the information that related to the feelings and
personal experience of farmer to the way that the use of agricultural inputs
has promoted food production in the area.
3.14. Quantitative
analysis
I used methods to measure the phenomena that can be expressed
in quantity. I also used mathematical and statistical symbol to summarize the
economic information through this method, I was able to analyze various
variables to get searched information.
3.15. Data processing and
analysis
After collecting all information, data were processed and
analyzed using Statistical Package for Social Sciences (SPSS) and Microsoft
Excel. After the data entry,
and data cleaning, graphs and tables were generated based on the tabulation
plan that include views of the respondents on the role of fertilizers,
pesticides and improved seeds in increasing food production and therefore,
insuring food security
The Data analysis were done in the context of the problem
studied, the objectives and the research questions that were formulated at the
beginning of the study and literature reviewed
CHAPTER ROUR: PRESENTATION OF THE FINDINGS
4.1. Introduction
This
chapter presents findings of the field study and their interpretation. The
findings are presented and analyzed in the context of the problem studied, the
objectives and the research questions that were formulated at the beginning of
the study and literature reviewed. The study was intended to establish the
«The role of the use of improved agricultural practices in
ensuring food security in Rwanda», with the particular case study
on CYANIKA sector, BURERA District
4.2. Demographic
perspective
For purposes of objectivity, the researcher focused on both
female and male respondents Socio-demographic characteristics. This section
presents some socio-demographic characteristics of respondents with a focus on
their gender, Head of Household, Livelihood activity and level of education.
Table 1: Respondents' demographics per gender, Head of
Household, Livelihood activity and level of education
|
Gender
|
Head of Household
|
Livelihood activity
|
Level of education
|
|
Male
|
46.87%
|
Man
|
32.29%
|
Agriculture
|
55.20%
|
Primary
|
37.50%
|
|
Female
|
53.12%
|
Women
|
41.66%
|
Livestock
|
17.70%
|
Secondary
|
10.41%
|
|
Total
|
100%
|
Elder
|
13.54%
|
Both
|
12.50%
|
University
|
7.29%
|
|
|
Non married
|
9.37%
|
State agent
|
10.41%
|
Vocation
|
9.37%
|
|
Children
|
3.12%
|
Other
|
4.16%
|
None
|
35.41%
|
|
Total
|
100%
|
Total
|
100%
|
Total
|
100%
|
Source: Results of field study,
2014
With regard to the head of household, the majority of them
were headed by women, man, elder, non married and children under 18years with
41.66%, 32.29%, 13.54%, 9.37%, and 3.12% respectively
As far as the education level is concerned, 35.41% of the
respondents do not have a primary school certificate while 37.50% have it.
Almost 10.41% of respondents in this category have attended secondary schools
and 7.29% have a higher learning education degree. Only 9.37% of respondents
in this category are holders of a vocation training certificates.
4.3.: Proportion (%) of
respondents views on the cause of low productivity, who decide to harvest the
production, who decide to sell/consume the production and whether they are
allowed to choose a buyer they want (in the period of 2012-2013)
Table 2: respondents' views
|
Cause of low production
|
Decision to consume or sell
|
Member of cooperative
|
|
low level of using fertilizers
|
14.58%
|
head of cooperative
|
46.87%
|
yes
|
76.04%
|
|
small land
|
44.79%
|
public authorities
|
26.04%
|
no
|
23.95%
|
|
use of traditional methods
|
20.83%
|
head of household
|
27.08%
|
Free to harvest
|
|
low level of using improved seeds
|
12.50%
|
|
yes
|
66.66%
|
|
low level of using insect killer
|
7.29%
|
no
|
33.33%
|
Source: Results of field study,
2014
The majority of the respondents (44.7%) said that the
productivity in CYANIKA sector is affiliated to the small land of cultivation
and the use of traditional tools in their agricultural activities (20.83%).
However, few respondents (7.29%) revealed that it is attributed to the low use
of pesticides.
66.66% of participants in this study reflect that they decide
for themselves to harvest their production while 33.33% said that someone else
decide for themselves. The majority (76.04%) of the sample size surveyed
reflects by the fact that are the members of farmers cooperatives on the other
side, 66.66% of them said that the Head of cooperative decide for themselves
when and how to harvest while 26.04% reported their administrative authorities
and lastly, 77.08% reported a problem of not allowed to choose the buyer when
they want to sell or to consume their production
4.4. Respondents view on
the use of improved seeds, pesticides and fertilizers
The information about the use of agricultural inputs was very
important in this study because it helps us to figure out how the use of
fertilizers has helped farmers to improve food production, improved seeds in
this study was to help us find out their contribution in promoting food
security and it was also very important in this study to examine the role of
the use of pesticides to increase production in rural area of CYANI sector
Figure 2: Snapshot of the
use of improved seeds, pesticides and fertilizers
Source: Results of field study,
2014
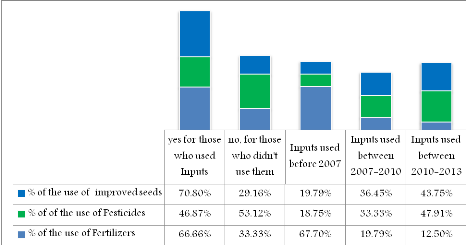
This study shows that around 71% of the household surveyed had
used improved seeds in last two years while 29% they didn't. From those who
reported to use improved seeds, 19.7% start to use them before 2007, 36.4% and
43.7% started to use them between 2007- 2010 and between 2010 -2013
respectively
Again referring to the above figure, it is clear that 46.8% of
the sample surveyed have used pesticides in last two years while 53.1% they
didn't. From those who reported to use pesticides, almost 19% start to use them
before 2007 where 33% started to use the between 2007 and 2010 while about 48%
started between 2010 to 2013
Finally, approximately 67% of the household surveyed use
fertilizers while 33% they didn't. from those who reported to use fertilizers,
68% start to use them before 2007 (the year by which MINAGRI developed the Crop
Intensification Program (CIP) with the aim of increasing agricultural
productivity and food security in Rwanda), 20% started to use the between 2007
and 2010 while 12% started between 2010 to 2013 This shows that there is an
increasing trend in the use of agricultural inputs well done to the Ministry of
Agriculture and Animal Resources through the Crop Intensification Program (CIP)
established in 2007
4.5. Respondent's view on
the crops grown before and after the use of fertilizers
In this aspect we would like to analyze role of the use of
fertilizers based on the crop grown before and after they start to use this
agricultural input. The table below examines the respondent's views about this
information
Figure 3: The proportions of
crops grow before and after the use of fertilizers
Source: Results of field study,
2014
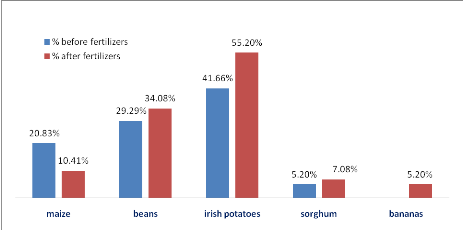
The results of the current study highlighted the perceptions
of the use of fertilizers. It revealed that 41.6%%, 29.2% reported that Irish
potatoes and beans respectively were their favorite crops before the use of
fertilizers and after, Irish potatoes and beans continue to be the major crops
and the rates has increased whether for Irish potatoes, beans and sorghum but
also an introduction of a new crop namely banana that was at the rate of 5.2%
of cultivation
4.6. Observations on the
crop production before and after the use of Improved agricultural practices
The observation on these variables (inputs) will help us to
examine the impact of agricultural inputs on the availability of food
production based on the perception of the respondent on each of the three
inputs namely Fertilizers, improved seeds and insecticides around CYANIKA
Sector
Figure 4: The percentages of
production before and after the use of agricultural inputs
Source: Results of field study,
2014
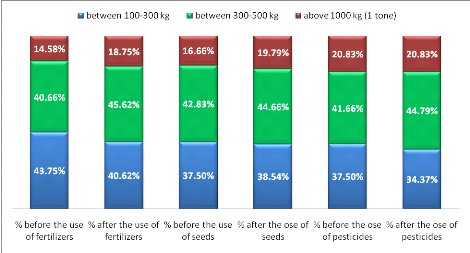
Looking at the graph above, we note the following:
§ There was no significant improvement observed on the HH
that were producing between 100-300kg before and after the use of fertilizers
(40.76% to 40.62% respectively)
§ Due to the use of fertilizers, HH that their harvest
was in the range of 300-500kg, were raised from 40.66% to 45.62% before and
after the use of fertilizers
§ It is also shown by looking at the above graph, HH that
were producing above 1000Kh (Tone) before and after the use of fertilizers, was
significantly increased from 14.5% to 18.7% respectively
§ On the use of improved seeds, the above table shows
that HH that were producing between 100-300kg before and after the use of
improved seeds shifted from 37.5% to 38.5% respectively which indicate an
tremendous increment in the production because more HH shifted from this group
to the next (100-300kg to 300-500kg respectively)
§ Due to the use of improved seeds, HH that harvested
between 300-500g and above tones of production, the proportions indicate that
there is a considerable increase in the farmer's production (seen the above
graph)
§ By comparing before and after the use of pesticides,
there is an increase in production among HH that were producing between
100-300kg and 300-500kg but on the third group (above 100kg/1 tone) was not
improved
Figure 5: The proportion of
the overall production before and after each agricultural input
Source: Results of field study,
2014
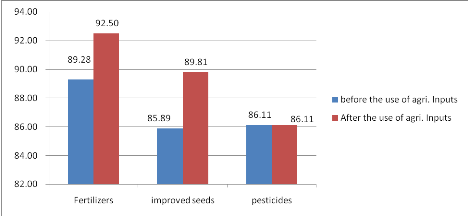
Looking at the graph above, it shows a remarkable improvement
on the food production based on use of fertilizers and improved seeds where the
rates was shifted from 89.28% to 92.50% for fertilizers and
from 85.89% to 89.81% for improved seeds respectively in the
year 2002-2013 while looking at the pesticides, there was no improvement
Once we were interest to find out the role of the use
fertilizers and improved seeds and pesticides in increasing food production, it
is clear that they have helped much the farmers to raise their agricultural
production
4.7. Observations on food
security
Food security is considered as major component of welfare of
individual or family. As far as the Food security level is concerned, we
considered the number of meals taken per day, Satisfaction of a HH in food,
market price of food crops around CYANIKA, % of Food production harvested
before and after the use of agricultural input. This indicator was considered
to see how the situation of food security before and after the use of
agricultural input was looking
4.8 Situation of Food security in
Cyanika Sector
Based on the Rome Declaration on World Food
Security and the World Food Summit Plan of Action,
convened by the United Nations Food and Agriculture Organization, resolved that
«food security exists when all people, at
all times, have physical and economic access to sufficient, safe and nutritious
food to meet their provisions needs and food preferences for an active
and healthy life Broadly, food security is built on 3
pillars: Availability, accessibility, utilization
Table 3: Food security
situation in Cyanika Sector
|
Satisfaction of a HH in food?
|
Number of times a household get food per
day
|
market price of food crops around cyanika
Sector
|
% of Food production harvested before and after the use
of agricultural input
|
|
|
%
|
Number
|
%
|
Level
|
%
|
|
Before
|
After
|
|
yes
|
69.79%
|
1 time
|
36.45%
|
high price
|
25%
|
Fertilizers
|
The production was low
(see Figs.)
|
the production has increased
(see Figs.)
|
|
no
|
30.20%
|
2 times
|
56.25%
|
medium price
|
75%
|
Improved inputs
|
|
Total
|
100%
|
3 times
|
7.29%
|
Total
|
100%
|
Pesticides
|
|
|
Total
|
100%
|
|
Source: Results of field study,
2014
As it is indicated in the table above, 36.45% of respondents
took one meal per day. Apparently, number of people who took one meal per day
seems to be poor, 56.25% took two meals while only 7.29% took three meals per
day. Again 25% reported that the market prices are high around CYANIKA market
which impedes them to purchase food while 75% reported to be satisfied with the
market price.
Looking at HH food satisfaction, almost 70% said that they are
satisfies themselves in food while 30% are not which means there is a
significant availability and accessibility of food and evenly its use. This
shows a very important improvement on people's living conditions.
Great number of respondents affirmed that number of the crop
production has increased because of the use of agricultural inputs. Food is one
of physiological needs and then if there is food security, it is considered as
mirror of improvement of living conditions of the population.
4.9. Challenges faced by
farmers in the process of applying agricultural inputs and Suggestions of
farmers to improve the use of agricultural inputs
Among the HH selected in this survey, the respondent addressed
different challenges that prevent them in increasing their own production and
improves their food security and also the proposed Suggestions to improve the
use of agricultural inputs
Table 4: Challenges faced by
HH surveyed and suggestions
On the bellow graph, there are a proportion of the respondents
on challenges and suggestions
Source: Results of field study,
2014
|
Challenges faced by farmers
|
|
%
|
|
Climate change
|
|
43.75%
|
|
Conservation of production
|
|
11.45%
|
|
Price change
|
|
12.50%
|
|
High cost of inputs
|
|
32.29%
|
|
Suggestions Proposed
|
|
%
|
|
Increasing loan to farmers
|
|
21.87%
|
|
BDF funds and others( MINAGRI price project) should pass
their funds through UMURENGE SACCO for easy access
|
|
14.58%
|
|
Increase the quantity of inputs (fertilizers, selected
seeds, pestcides)
|
|
33.33%
|
Source: Results of field study,
2014
Strengthening of the land consolidation
program
4.9.1. Challenges faced by
farmers in the process of applying agricultural inputs
Referring to the above graph, 43.75% reported that the main
problem they have faced is the climate change followed by the agricultural
inputs that are not easily accessible (32.29%), 12.5% said that they are not
happy with the changes of the market price of crop production, 11.45% showed
that the conservation of crop harvested is the major challenge and finally, the
big number of HH surveyed reported that climate change is the driving factor
that prevent them to improve their crop production.
4.9.2. Suggestions of
farmers to improve the use of agricultural inputs
The above graph indicates clearly the needs/suggestion that can
help them to improve their crop production accessibility trough market price
(purchasing power of the HH), and finally the food utilizations. Based on this
a HH will get a better living condition
From the above table we note the followings:
- 30.20% suggested that government should put more efforts to
strengthen the land use consolidation program to facilitate farmers increase
their production
- 33.33% reported that, they wish the increase of quantity of
agricultural inputs will sustain the production and solve the food security
problem
- 14.58% the funds that the government provide for farmers
such as BDF, MINAGRI PRICE PROJECT among the others should pass through the
UMURENGE SACCO for easy access
- 21.87% of the total HH surveyed reported that loans for
farmers are still low that government should emphasize in how to increase them
to facilitate farmers in purchasing agricultural inputs
CHAPTER FIVE: CONCLUSION AND
RECOMMENDATIONS.
5.1 Conclusion
The research entitled «The role of the use of improved
agricultural practices in ensuring food security in Rwanda» the research
was conducted under three objectives:
4. To find out how the use of
fertilizers has improved food production in rural area of CYANIKA Sector
5. To analyze the contribution of the use of improved seeds in
promoting food security trough the increase in food production in rural area of
CYANIKA Sector
6. To find out how the use of pesticides has helped to
increase production in rural area CYANIKA sector
In collecting data, the researcher used a qualitative method
and these techniques were useful: documentary sources, observation, and
interview. After analyzing and interpreting data from different interviewees,
we note the following:
In general, all inputs that emphasized in this study have
played a big role in increasing food production and food security situation in
CYANIKA Sector in the period of 2012-2013
There was a remarkable improvement on the food production
based on use of fertilizers and improved seeds where the rates was shifted from
89.28% to 92.50% for fertilizers and from
85.89% to 89.81% for the use of improved
seeds respectively in the year 2012-2013 while looking at the pesticides, the
rate kept constant that means there was no considerable effect on food
production made by farmers in the same period
It was revealed that 56.25% took two meals (lunch and supper).
Apparently, number of people who took one meal per day seems to be poor
(36.45% of respondents) while only 7.29% took
three meals per day. Again 25% reported that the market prices
are high around CYANIKA market which impedes them to purchase food while
75% reported to be satisfied with the market price.
Looking at HH food satisfaction, almost 70% said that they are
satisfies themselves in food while 30% are not which means there is a
significant availability and accessibility of food and evenly its use. This
shows a very important improvement on people's living conditions So, the
researcher found out that agricultural inputs played a big role in reducing
food shortage and food security problems faced by CYANIKA Sector
Food insecurity in Rwanda is still affected by seasonal
patterns where food consumption of households is better in March than in
September due to the availability of food stocks from the season A harvest
compared to September as it was indicated by FNSMS round 3, 2011. In this
study, out of the sample selected, 30.2% of households living in CYANIKA could
be considered to be food insecure because they reported to be not satisfied in
food that affiliated to small land and relying only on one activity and this
contribute much to low food consumption.
Compared to other areas of CYANIKA sector, Kagitega cell
followed by Kabyiniro cell, reported a higher percentage of households that are
not satisfied in food (82.35% and 81.2% respectively) and out of the HH
reported to be not satisfied in food, 63.2% said that it is due to small land
and 45.3% rely only on one activity
5.2 Recommendations
After analyzing and interpreting the findings, some
recommendations were suggested to all people who work in the field of
agriculture, stakeholders, NGOs and both public and private institutions should
work hand in hand to reduce food shortage and food security problems due to the
low production through strengthening the use of agricultural input
5.2.1 Based on the findings
of this study, the following recommendation can be formulated:
- CYANIKA sector authorities need to strengthen but keeps
improving the use of fertilizers among farmers because it helped them to
increase their production
- CYANIKA sector authorities should increase the awareness
campaign among the farmers to also use pesticides since 53.12% of the
respondents said that they don't have access to pesticides and this impacted
negatively the production
- CYANIKA sector authorities should ensure the good
organization and quantity distribution of improved seeds among farmers of
CYANIKA Sector since it is among the major driving factor that increase the HH
food production
- CYANIKA sector authorities should increase the awareness
campaign among the farmers on the land use consolidation program since 63.2%
said that food shortage is due to landless and also HH with little land
(<1ha or even none)
- Scaling up the livelihoods activities to avoid household
living only on one activity rather practice a combination of activities. since
this is among the major component that cause a HH food shortage especially in
case of changes of weather condition
- CYANIKA sector authorities should increase the awareness
campaign among the farmers on the land use consolidation program since 63.2%
said that food shortage is due to landless and also HH with little land
(<1ha or even none)
5.3 Future research
This research has concentrated on «the role of the
use of improved agricultural practices in ensuring food security in
Rwanda» but did not manage to cover the entire Rwandan agricultural
sector
This has therefore paved away for future researchers to
investigate the opportunities, constraints, challenges and government's role in
straightening the Land consolidation program, agricultural input distribution
and different measures that put in place for climate change protection
It is hoped that the information generated in this study can
be of further help for researchers, investors, planners and government
authorities of CYANIKA sector in particular
5.4 References
International Center for Soil Fertility and Agricultural
Development, 2010, EVALUATION REPORT ON CROP INTENSIFICATION PROGRAM
REPORTS, Kigali, Rwanda
MINAGRI," 2010, AGRICULTURE SECTOR INVESTMENT PLAN 2009-2012,
Kigali
MINAGRI; 2004, 34p, NATIONAL AGRICULTURE
POLICY Kigali, Rwanda
MINAGRI, 2008, p 2, STRATEGY FOR RAPID AND SUSTAINABLE GROWTH
OF FERTILIZERS USE IN RWANDA, (PASTA), Kigali
Ministry of Agriculture and Animal Resources and National
Institute of Statistics of Rwanda, (2008), NATIONAL AGRICULTURAL SURVEY,
Kigali, Rwanda
National Institute of Statistics of Rwanda, 2012,
COMPREHENSIVE FOOD SECURITY VULNERABILITY ANALYSIS Kigali, Rwanda
National Institute of Statistics of Rwanda, 2013,
COMPREHENSIVE FOOD SECURITY VULNERABILITY ANALYSIS (CFCVA) Kigali, Rwanda
APPENDICES
INTRODUCTION
My name is Emmanuel NSENGIYUMVA I am a
student at INES RUHENGERI in year five, faculty of Applied Sciences, department
of Statistics Applied to Economy
I am doing a research on «the role of the use
of agricultural inputs in ensuring food security» this
research is for Academic purpose and it will only be conducted in CYANIKA
sector. Your household has been selected randomly and I wish to interview only
one member of the household. What we are going to discus shall never be
published on your name instead, it will be mixed we others with a high level of
confidentiality for all participant of this survey.
So don't hesitate to provide the true information on what you
wish to say and in case you feel there is any question you don't want to reply,
feel free there is no direct consequence to be applied
Instructions
ü Please provide information according to the
question asked
ü If it Yes or No,
put a signal (X) in the box provided
This booklet is made up by four sections
1. Section one: This section contains the
information about Bio-data of Respondent
2. Section two: This section contains the
information about agriculture productivity in rural areas of CYANIKA Sector
3. Section four: This section is for
suggestions of farmers to the use of improved inputs in rural areas of CYANIKA
Sector
For more information and details on this study, please
contact
Mr. Emmanuel NSENGIYUMVA
Tel: (+250)783392621
(Researcher)
SECTION A: This Section is intended to get
information about Bio-data of Respondent
....................
Number of questionnaire
a) Place of residence
District.......................................Sector.......................................
Cell...........................................Village........................................
b) Sex
o Male
o Female
c) Level of education
o Primary School
o Secondary School
o University
o Other
o No education
d) Age group
o Between 18-25
o Between 26-35
o Between 36-50
o Beyond 50
e) Head of household
o Men
o Women
o Elder (over 60 years)
o Non married
o Child under 18
g) Livelihood Activities
o Agricultural activity
o Livestok activity
o Both activities ( Agricultural & Livestok)
o Daily labour
o Other
SECTION B: Information about agriculture production in
last two years
1. Did you use Fertilizers in the last two years in your
agricultural activities?
a) Yes No
b) In which year did you start using Fertilizers?
2. Which of the following crops did you grow before using
Fertilizers?
a) Maize Beans Wheat Irish potatoes Sorghum Bananas
b) What was your harvest (in kilograms) before using
Fertilizers?
Between 0-100 kg Between 100-300kg Between 300-500kg
Between 500-1000kg (1tone) Above 1000kg (1tone)
3. State the crops grown after the use of Fertilizers
a) Maize Beans Wheat Irish potatoes Sorghum Bananas
b) What harvest do you get (in kilograms) after using this
Fertilizer?
Between 0-100 kg Between 100-300kg Between 300-500kg
Between 500-1000kg (1tone) Above 1000kg (1tone)
4. Do you market your output?
a) Yes No
b) What is the amount in kilograms of output do you
sell?
c) What is the amount of output do remain with? (In
kilograms)
d) How long is this output you have remained with, last? (In
months)
5. Where does your household get food to consume?
a. Own production
b. from market
c. Aid
d. Other (specify)
6. Generally, what is the market price of food crops in the
market around you?
a) At low price At high price Medium price
7. By introducing the use of Fertilizers, what was the size of
your land (plot)?
a) Between 0 -1 ha Between 1 -2 ha Between 2
-3 ha Other specify
8. Does your family satisfy themselves in food?
a. Yes No
9. How many times do you get food per day?
i. 1Times/day
ii. 2Times/day
iii. 3Times/day
10. Did you use improved seeds in the last two years in your
agricultural activities?
a. Yes No
b. In which year did you start using improved seeds?
c. What was your harvest (in kilograms) before using improved
seeds?
Between 0-100 kg Between 100-300kg Between 300-500kg
Between 500-1000kg (1tone) Above 1000kg (1tone)
d. What harvest do you get (in kilograms) after using this
improved seeds?
Between 0-100 kg Between 100-300kg Between 300-500kg
Between 500-1000kg (1tone) Above 1000kg (1tone)
11. Did you use insect killer in the last two years in your
agricultural activities?
a. Yes No
b. In which year did you start using insect killer?
c. What was your harvest (in kilograms) before using insect
killer?
Between 0-100 kg Between 100-300kg Between 300-500kg
Between 500-1000kg (1tone) Above 1000kg (1tone)
d. What harvest do you get (in kilograms) after using this insect
killer?
Between 0-100 kg Between 100-300kg Between 300-500kg
Between 500-1000kg (1tone) Above 1000kg (1tone)
12. What was the main cause of low productivity for you
output?
a. Low level of using Fertilizers
b. Small land
c. The use of traditional tools
d. Low level of using improved seeds
e. No use of Pestsides (insect killer)
13. Are you a member of any farmer cooperative?
a. Yes No
b. Are you allowed to harvest at any time you want
c. Who decide to sell or to consume your production?
- Head of cooperative
- Public authorities( Village, cell, sector, etc)
- Head of household
d. Is it possible to choose the buyers you want other than
selling it to cooperative?
- Yes No
SECTION C: This section is for suggestions of farmers on
the use of agricultural inputs
14. What would you think the government can do
to help farmers of this area of CYANIKA sector so as to increase agriculture
production and become food secure?
a)
.............................................................................................
b)
.............................................................................................
c)
.............................................................................................
15. Which challenges did you meet in the process of applying
agricultural inputs in your agricultural activities?
a)
.............................................................................................
b)
.............................................................................................
c)
..........................................................................................
***thank you for your kind collaboration
***
* 1 CFSVA 2013,
National Initiatives for food security and Nutrition
* 2 Comprehensive Food
Security Vulnerability Analysis (CFCVA) report, 2013
* 3 Comprehensive
Food Security Vulnerability Analysis (CFCVA) report, released in December
2012
* 4 Evaluation
Report on Crop Intensification Program (2010) International Center for Soil
Fertility and Agricultural Development, Kigali
* 5 Coordinator of the
Fertilizer Program at the ministry, Dr. Charles MUREKEZI
* 6 IRIN Africa
report published in September 2008
* 7 National
Agricultural Survey, NAS 2008
* 8 Evaluation
Report on Crop Intensification Program and International Center for Soil
Fertility and Agricultural Development reports, Kigali, 2010
* 9 Printed in IFDC
Report Volume 37, No. 2 (2012)
* 10 Mbonigaba
(DG/RAB) said in a three-day agricultural workshop in Musanze District, 30
September 2013)
* 11 (MINAGRI, National
Agricultural Survey, 2008)
* 12 Official
Wesite of Burera District, www.bureradistrict.gov.rw
| 

