
UNIVERSITY OF RWANDA
COLLEGE OF
BUSINESS AND ECONOMICS
SCHOOL OF ECONOMICS
DEPARTMENT
OF APPLIED STATISTICS
IMPACT OF ONE CUP OF MILK PER CHILD PROGRAM ON SCHOOL
DROPOUT IN HUYE DISTRICT
Dissertation submitted to the College of
Business and Economics In partial fulfillment of the Requirements for the award
of bachelor's Degree in Applied statistics.
Presented by: FABRICE Birasa
Registration Number: 12114403
SUPERVISOR: Dr DIEUDONNE Muhoza
Done at Huye on 8th May,
2015
DECLARATION
I, FABRICE Birasa, a student at University of Rwanda, COLLEGE OF
BUSINESS AND ECONOMICS, School of Economics, Department of applied statistics
hereby declare that the presented dissertation: «The Impact of one cup of
milk per child program on school dropout level». A case study of Huye
district primary schools» is my own presentation which has not been
presented for any other academic purpose at any University or higher learning
institution.
Date: ........June, 2015
Signature ............................
FABRICE Birasa
CERTIFICATION
I certify that this research on «The Impact of one cup of
milk per child on children dropout; A case study of Huye district primary
schools» presented by FABRICE Birasa. The research was done towards
partial fulfillment of Bachelor's Degree submitted to College of Business and
Economics, School of Economics, department of applied statistics is based on
the original research and the study under the supervision of Dr DIEUDONNE
Muhoza
Date......June, 2015
Superior's Signature:..........................
Supervisor: Dr DIEUDONNE Muhoza
DEDICATION
To Almighty God
To all my lectures
To all my family members
To all my colleagues and friends


DEDICATION
I dedicate this dissertation:
MAY GOD BLESS YOU
ALL!!!!!!!!!!!!!!!!!!!
ACKNOWLEDGEMENT
The following work is not only an individual work .I could never
have accomplished it without help, support, guidance and efforts of a lot of
people to whom I owe my thanks. I would like to gratefully and sincerely thank
all individuals who helped me during my education career, financial support,
encouragement, moral support, all my family, friends all kinds of your advice,
moral, love have contributed towards the successful accomplishment of this
work.
I would like to extend my sincere gratitude and heart-felt
appreciation firstly, to my Almighty God in Christ Jesus name, to whom I owe my
life, wisdom, and good faith in my whole life. I praise him for enabling me
throughout my academic journey and carry out this academic research in
particular.
Special thanks go to Dr DIEUDONNE Muhoza my Supervisor, whose
guidance, encouragement and correction for this study has inconsiderably
contributed towards its achievement.
I would like also to acknowledge my beloved sister and brothers:
BIRASA (Claire, Germain, Benoit, Tresor, Eric, Bruno and last born of my family
Genau); your support towards my academic performance is immeasurable.
Institutionally, I would also like to thank the Government of
Rwanda for its scholarship granted to me to the extent that I am completing my
bachelor degree courses. I am grateful for the opportunity to study in the
University of Rwanda.
My gratitude also goes to all classmates with whom we shared
academic ideas for whole these four years of undergraduate.
Acknowledgement again is attributed to UR-Christian communities'
members, specifically CEP-UR HUYE CAMPUS, ELAYO CHOIR, SGM, etc.
Finally, thanks goes to my relatives whose names did not appear
above and friends in one way or another towards the successful completion of
this work.
LIST OF ACRONYMS ND
ABBREVIATIONS
MDGs: the Millennium Development Goals
EFA: Education for all
UNESCO: United Nations Educational, Scientific and Cultural
Organization
WHO: World Health Organization
MoH: Ministry of Health
CJM: Center des Jeunes muet
MINEDUC: Ministry of Education
MINAGRI: ministry of agriculture
WHO: World Health Organization
UNICEF: United Nations Children's Fund
MINALOC: Ministry of Local government
TABLE OF CONTENTS
Contents
DECLARATION
I
CERTIFICATION
II
DEDICATION
III
ACKNOWLEDGEMENT
IV
LIST OF ACRONYMS ND ABBREVIATIONS
V
TABLE OF CONTENTS
VI
LIST OF TABLES
IX
LIST OF FIGURES
X
ABSTRACT
XI
CHAPTER I : GENERAL INTRODUCTION
1
1.1 Background of the study
1
1.2 Statement of the Problem
2
1.3 Research Objective
3
1.3.1 General Objective
3
1.3.2 Specific Objective
4
1.4 Research Question
4
1.5 Research Hypothesis
4
1.6 Significance of the study
4
1.7 Scope of the study
5
1.8 Organization of the study
5
CHAPTER TWO: LITERATURE REVIEW
6
2.1. Introduction
6
2.1.1 Definition of key terms
6
2.1.2 Dropout
9
2.2 The literature related to causes of Dropout
9
2.2.1 School level factors
10
2.2.2 Household (family) level factors
11
2.3 The relating to consequences of school dropout
and strategies to be taken
13
School and Community Perspective
15
2.4 Summary of the literature review
19
CHAPTER THREE: RESEARCH METHODOLOGY
20
3.1. Introduction
20
3.2. General Description of the study
20
3.2.1. Research design
20
3.2.2. Purpose of the study
21
3.2.3. Study process
21
3.2.5. Outcome of the study
21
2 .3 Conceptual framework
21
3.4 Geographical location of huye
district
23
3.5 Population study, Sample size and Sampling
techniques
24
3.5.2 Sampling design
24
3.5.3 Sample size determination
25
3.6. Description of the instruments of data
collection
25
3.6.1. Questionnaire
25
3.6.2. Interview schedule
25
3.6.3. Documentation
26
3.7. Data Processing and Analysis
26
3.7.1. Coding
26
3.7.2. Editing
26
3.7.3. Tabulation
26
3.8 Methods of data analysis
27
3.8.1 Descriptive statistics
27
3.8.2 Multivariable analysis
27
3.9. Limitation of the Study
30
CHAPTER FOUR: DATA ANALYSIS AND INTERPRETATION
31
4.1 Introduction
31
4.2. Profile of respondents:
31
4.2 Results from the percentage distribution of
respondents by the level of dropout
32
4.3 Descriptive statistics of causes of dropouts by
the level of dropout
34
4.3.1 Distance from school
35
4.3.2 Parents' illiteracy
35
4.3.3 Child's Family poverty
35
4.3.4 One cup of milk per child
35
4.3.5 Failure or repetition of children
36
Source: primary data
39
4.4 Results from bivariate analysis using
chi-square test
39
REFERENCE
46
APPENDIX
49
LIST OF TABLES
Table 1 Table showing the current distribution of
milk among children of primary schools of Huye.
7
Table 2 Cost and Funding mechanism of one cup of
milk per child countrywide
8
Table 3 Sample selection
25
Table 4 Percentage distribution of respondents by
the level of dropout
32
Table 5 Percentage distribution of respondents by
factors affecting dropout
33
Table 6 Percentage distribution of factors
affecting dropout by the level of dropout
34
Table 7 Chi- square test table illustrating
association between level of dropout and its factors
40
Table 8 Parameter estimates for multinomial
logistic model
42
LIST OF FIGURES
Figure 1 Figure showing children having milk at
their disposal in Nyanza district
8
Figure 2 Conceptual Framework between Level of
dropout and factors affecting it
22
Figure 3 Geographical location of Huye district
23
Figure 4 Distribution of respondents by their
education level and Gender
32
Figure 5 Distribution of respondents to whether the
school has the program or no by the level of dropout.
36
Figure 6 Figure showing the distribution of
consequences to child's family by the level of dropout
37
Figure7 Distribution of respondents to the
consequences to school against the level of dropout.
38
Figure 8 Distribution of respondents regards
consequences of dropout to a country by the level of dropout.
39
ABSTRACT
To study the Impact of one cup of milk per child on children
dropout, the following objectives were set: To identify the causes associated
with children drop out of primary schools in Huye district. To examine the
relationship between one cup per child and dropout in Huye district, to find
out the challenges associated with children dropout in Huye district, to find
out strategies to be taken in order to solve challenges of Children dropout in
primary school in Huye district. Questionnaire, interview and observation were
used to collect data from survey of population consist of 98 primary schools
out of which 4 primary schools were selected namely Butare Catholic primary
school, Cyarwa primary school, Rango primary school, and CJM whereby a sample
of 60 respondents were selected by using purposive sampling technique as well
as simple random sampling, the researcher used secondary.
All The data were analyzed by using SPSS 16 (as a statistical
package for analysis) and interpreted by using tables, figures and charts as
well as excel was used during the graphical presentation of results. The
findings revealed that the one cup of milk per child contributed towards the
reduction of dropout within primary schools.
After analyzing and interpreting the data, recommendation and
suggestions on what measures are to be taken by policy makers, specifically
leaders in charge of education system as well as researchers were highlighted
for the reduction of dropout.
CHAPTER I : GENERAL
INTRODUCTION
1.1 Background of the
study
Education is as important and very essential to man as life
itself on this world, in fact it is a very important means of developing any
nation (Haki Elimu, 2009).
«It is through education that the daughter of a peasant
can become a doctor; that a son of a mineworker can become the head of the
mine; that a child of farm workers can become the president of a great
nation» (Nelson Mandela)
The term education has not lent itself to any strict
consensual definition as it depends on the perspective from which one views it,
it can be considered as the process of acquiring knowledge, skills, factors,
interest, abilities, competence and the cultural norms of a society by people
to transmit this life to the coming generations so as to enhance perpetual
development of the society (Okoro, 1998)
In spite of the importance attached to education both
nationally and internationally, Education sector in the world still is facing a
lot of problems that varies from one country to another such as poor Academic
performance, School dropout, Truancy, Poor environment of learning and other
social and economic problems relating to education (Rumberger, 2001).
School dropout in its simplest meaning is the untimely
withdrawal from school, these students who withdraw from school prematurely end
up not obtaining any certificate of graduation (Wotherspoon2004; Bridge land et
al., 2006; Oghuvbu, 2008).
The prevalence of drop out varies between and within countries
and occurs more frequently in certain age ranges and grades (depending on the
educational structure and patterns of participation in that country).
The student's decision to drop out of schools has a long
term consequences that can contribute to juvenile delinquency, welfare
dependency or in the worst cases. There is general consensus that the school
dropout problem has reached epidemic proportions internationally and has become
a global problem confronting the education industry around the world (Patrick
2008; Wotherspoon2004; Bridge land et al., 2006; Oghuvbu, 2008).
In African countries, dropout is a significant problem and is
associated with socio-economic and socio-cultural background and geographical
factors, Studies in Nigeria reveal that financial constraints are among other
things the main reasons for school dropout (Okoje, et al-1996) as fathers and
mothers are mainly responsible for costs of children's education.
1.2 Statement of the
Problem
Education plays a vital role in human resources development.
Schooling, according to the human capital theory, is an investment that
generates higher future income for individuals. It elevates the productivity
and competence of individuals and thus produces skilled manpower that is
capable of leading the economy towards the path of sustainable economic
development.
Strengthening the quality of education has become a global
agenda at all educational levels and more so at the primary level. Quality
primary education also ensures increased access and equality and it is mainly
due to these reasons that various international Forums and Declarations have
pledged improvements in quality of primary education. It was stated in a
report of Educational Scientific and Cultural Organization (UNESCO, 1991) that
dropout phenomenon is a world-wide problem associated with the process of
development in any society whether such society is a developing or developed
nations. For instance, in the United States, a federal study group known as the
National Commission on Excellence in Education observed critically that high
school dropout rate rose to almost 30% by the late 1980s. In the light of the
Annual Education for All Global Monitoring Report, published by UNESCO, it has
been revealed that Nigeria, Pakistan, India, and Ethiopia, account for 23
million out of the world`s 77 million out off-school children. There are many
differences between the education systems of developed and developing
countries.
According to the World Food Programme, 66 million primary
school children go hungry every day, with 23 million hungry children in Africa
alone. Furthermore, 80 per cent of these 66 million children are concentrated
within just 20 countries. Additionally, 75 million school-age children (55 per
cent of them girls) do not attend school, with 47 per cent of them living in
sub-Saharan Africa. Thus, the need to reduce hunger while increasing
school enrollment in these children is evident, and school feeding programmes
have been developed to target this multi-faceted problem.
Although Rwanda has sustained a strong political commitment to
improve education access and quality, placing the country on a planned
trajectory towards achieving quality basic education for all, the country is
far from reaching the goal of universal primary education, with only half the
children completing primary school. (EFA country profile 2012)
Drop out is an under-researched area, even though the problem
is prevalent. With EFA and MDGs targeting access to education, knowledge around
dropouts and studies such as this, can help illuminate some of the complexities
around dropping out and bring new insights to policy makers and educational
practitioners. By understanding dropout further there will be greater potential
to move towards a more meaningful notion of access. (Frances Hunt, May 2008)
The government of Rwanda has started, around 2010, the program
entitled one cup of milk per child dedicated to decrease malnutrition, as well
as dropout, among children in Rwandan primary schools.
The «One Cup of Milk Per Child programme has been
introduced in around 100 schools in Rwanda and is being expanded in
collaboration with MINAGRI.
This study is important because it brings together a range of
literature on dropout causes and its effects in a way that has not happened
before and discusses the possible influence that one cup of milk per child can
bring on children dropout.
1.3 Research Objective
1.3.1 General Objective
The main objective of this study will be to examine the Impact
of one cup of milk per child on children dropout in Huye district.
1.3.2 Specific Objective
The specific objectives of the research will be the
following:
1. To identify the causes influencing primary school dropout
in Huye district.
2. To examine the relationship between one cup of milk per
child and school dropout level in primary schools of Huye district.
3. To find out the consequences associated with school dropout
in Huye district.
1.4 Research Question
1. What are the causes of children dropout in primary schools
of Huye district?
2. Is there any relationship between one cup of milk per child
and dropout in Huye district?
3. What are the consequences associated with children dropout
in Huye district?
1.5 Research Hypothesis
In this study, the following hypothesis will be tested:
H0: There is no relationship
between one cup of milk per child and school dropout
H1: There is a relationship
between one cup of milk per child and school dropout
Assumptions
1. Children that are likely to dropout are those without
access to one cup of milk per child program.
2. One cup of milk per child can help to reduce children
dropout.
3. The increase in milk supplied is associated with the
decline in numbers of children who dropout.
1.6 Significance of the
study
The study will help the government to grasp the overall
performance of one cup of milk per child program in the selected schools as a
way of reducing children dropout level in general. The study will also identify
challenges that face the program and will attempt to suggest adequate
solutions. Besides family poverty, the study will shade light on other
contributing factors to dropout, especially in Rwandan community. The findings
of this study may serve for further researchers in the aim of improving the
program of one cup of milk per child.
1.7 Scope of the study
This study will be carried out in selected primary schools of
Huye district with or without the program of one cup of milk per child.
1.8 Organization of the
study
This study was presented in five chapters:
The first chapter was the general introduction: it gives
background of the study, the statement of the problem, objective of the study,
hypothesis testing, the scope and significance of the study
Second was the literature review, major concepts of the study
and other related work.
The third chapter is the methodology; it presents methods and
techniques employed in data Collection, the sample size and how it is selected.
Chapter four was on data interpretation and analysis.
Chapter five was about summary of the study, findings and
policy implications.
CHAPTER TWO: LITERATURE
REVIEW
2.1. Introduction
This chapter presents a review of literature on the factors
that define student's dropouts in global level, regional level and Rwandan
local level, especially Huye district. The chapter consists of the theoretical
framework and summary of reviewed literature identification of research gaps
and conceptual framework.
2.1.1 Definition of key
terms
· Students
According to Cambridge dictionary, a student is defined as a
person who is learning at a college or university, or sometimes at a school.
The free online dictionary by FARLEX defines school as
an institution for the instruction of children or people under college age.
· School
Cambridge advanced learner's dictionary defines school as a
place where children go to be educated. It can also be defined as the period of
your life during which you go to school, or the teaching and learning
activities which happen at school.
· One cup of milk per child program
Rwanda Agriculture Board started One Cup of Milk per Child
Program in May 2010 as an implementation of the outcomes of the IDP (Integrated
Development Program) meeting held at MINALOC on 23/04/2010, the resolution that
authorized MINAGRI to start the implementation of «One Cup of Milk per
Child Program». At first, the program started being piloted in 6 Districts
of Bugesera, Kamonyi, Nyanza, Karongi, Gakenke and Ngororero districts. After a
trial period of one year and half that showed that it is possible to run a
school milk program in our country, the scaling up was approved in the meeting
chaired by Right Honourable Prime Minister on 22/07/2011 and started being
implemented in October 2011.
In the up said meeting, MINAGRI was recommended to scale up
the program to other Districts and Schools and to increase the number of
children beneficiaries from 21,300 to 100,000. MINEDUC and MINISANTE were also
requested to assist to identify the needy Districts and Schools. After
different concertration meetings of the three concerned Ministries plus
MINALOC, eight (8) new Districts of Nyamagabe, Nyaruguru, Gisagara, Huye,
Nyamasheke, Rubavu, Rutsiro, Ngoma and Ngororero was retained to enter in the
scaling up of the program. Ngororero District was in the pilot phase with 5
schools and 5 new schools were retained in the scaling up of the program. A
part from the new districts which were scaled up to be in the program, some
other new schools from existing Districts were also added by the year 2013 and
among them six schools were from Nyanza, two from Ruhango and four new schools
from Gisagara. Currently, the program is being implemented in 112 schools from
fifteen Districts and eighty three thousand and five hundred and seventh five
(83,575) pupils are on the program.
The selection criterion of those districts was based on the
2010 report on malnutrition status in our Country especially among children.
The number of schools retained by District was also based on the malnutrition
rate in each District as the priority is given to the neediest as compared to
the allocated budget.
The pupils are given milk of standard quality from Rwandan
recognized dairies namely
INYANGE INDUSTRIES and AGRO PROCESSING INDUSTRIES (API) and
they take half liter twice a week which makes whole liter per week. (MINAGRI
2013)
Table 1 Table showing the
current distribution of milk among children of primary schools of
Huye.
|
N0
|
Province & District
|
School Name
|
Number of pupils as per 3rd term 2013
|
|
SOUTH
|
|
1
|
HUYE
|
Butare Catholique
|
479
|
|
2
|
CJM
|
151
|
|
3
|
Cyendajuru
|
590
|
|
4
|
EP Buremera
|
583
|
|
5
|
EP Busheshi
|
433
|
|
Total
|
2236
|
Source: MINAGRI 2013
Figure 1 Figure showing children
having milk at their disposal in Nyanza district

Source: MINAGRI 2013
Nyanza District: Pupils aligning when they are approaching their
classes after being served milk by their class teachers. (Nyanza serves
fermented milk)
Table 2 Cost and Funding
mechanism of one cup of milk per child countrywide
|
Number of children
|
Milk consumed by each pupil per week
|
Total quantity of milk consumed per week
|
Cost of milk per week
|
Number of weeks per year
|
Cost per year
|
Funds
|
|
83,375
|
One liter
|
83375 liters
|
800 Frw
|
36 weeks
|
2,401,200,000 Frw
|
Government
|
Source: MINAGRI 2013
According to MINAGRI, in charge of distributing milk among
schools, government is the only funder of the program having to spend
2,401,200,000 frw per year. Each child is supposed to consume one litre per
week and the children who are currently covered by this program are estimated
to be 83,375 children. Within Huye district only 5 schools have the program
with 2236 children currently covered with the program.
2.1.2 Dropout
By definition, dropout is a person who has abandoned a course
of study or who has rejected conventional society to pursue an alternative
lifestyle.
School dropout, also, in its simplest meaning is the untimely
withdrawal from school. These students who withdraw from school prematurely end
up not obtaining any certificate of graduation (Ajaja. 2012). However in this
study student dropout refers to the situation in which students fail to
complete a course of study within the usual time.
School dropout can be defined in different manner according to
the field in which the study is based on. In such way CALD3
dictionary defines it as a person who leaves school,
college or university before finishing a course, or a person who leaves in an
unusual way.
2.1.1.2 Drop-out Rate (DR)
The percentage of pupils who leave the school without
completing the grade they were enrolled in during the school year. Dropout rate
can also be obtained by subtracting the sum of promotion rate and repetition
rate from 100 in a given school year. (MINEDUC 2013)
DRt-1
2.2 The literature related
to causes of Dropout
It is clear that the number of children enrolled in school has
increased over time.
Nevertheless, a significant proportion of children who start
primary school are not completing this cycle.
There are many factors associated with this dropout, some of
which belong to the individual, such as poor health or malnutrition and
motivation. Others emerge from children's household situations such as child
labour and poverty.
2.2.1 School level factors
School level factors also play a role in increasing pressures
to drop out such as teacher's absenteeism, school location and poor quality
educational provision. The system of educational provision at the community
level generates conditions that can ultimately impact on the likelihood of
children to drop out from school. Therefore, both demand and supply driven
factors, are embedded in cultural and contextual realities, which make each
circumstance different. Nevertheless, it is possible to make general points
about the causes of drop out.
First, there is not one single cause of drop out. Drop out is
often a process rather than the result of one single event, and therefore has
more than one proximate cause (Hunt, 2008).
Second, distance to schools, poor quality of education,
inadequate facilities, overcrowded classrooms, inappropriate language of
instruction, teacher absenteeism and, in the case of girls school safety, are
common causes for school dropout (Colclough, et al. 2000).
These are seen as supply side causes of drop out, mainly
driven at the school level.
Within gendered social practices, school safety seems to be an
important factor for retaining girls at school, whereas availability of income
generating opportunities and flexible seasonal schooling could promote school
retention for boys (Colclough et al., 2000; Leach et al., 2003). Additional
factors affecting motivations and decision-making relating to educational
access are also keys to understanding of dropping out.
Perceptions of how education will influence lifestyle and
career possibilities/probabilities, life chances in the labor market are shown
to be factors in both early withdrawal and sustained access in different
contexts. The availability of options to access secondary school and beyond,
shape decision-making of parents regarding the continuation of children in
primary level.
Perceived quality of education and the ability of children to
make progress through the schooling system can affect the priority placed on
schooling within the household. It is also evident that children whose parents
have received some sort of schooling are more likely themselves to attend
school for longer. In particular, a mother's education level often influences
length of access for girls. For example in rural Pakistan, girls whose mothers
have some sort of formal schooling are less likely to drop out from school
(Lloyd, Mete and Grant, 2009).
2.2.2 Household (family) level
factors
Poverty also interacts with other points of social
disadvantage, with the interaction of factors putting further pressure on
vulnerable and marginalized children to drop out (Hunt, 2008:52).
In addition, poverty appears to influence the demand for
schooling, not only because it affects the inability of households to pay
school fees and other costs associated with education, but also because it is
associated with a high opportunity cost of schooling for children. As children
grow older, the opportunity cost of education is even larger, hence increasing
the pressure for children to work and earn income for the household as opposed
to spending time in education.
For example, orphans, migrants, lower caste/scheduled tribe
children and children from minority language groups in many, but not all,
contexts have disrupted access, and are more prone to drop out.
For example, around 15 to 20 percent of Roma children in
Bulgaria and 30 percent in Romania do not continue in school post Grade 4 in
primary school (UNESCO, 2010). Poor indigenous girls in Guatemala are far more
likely to drop out than non-poor, non-indigenous girls (UNESCO, 2010). Gendered
social practices within households, communities and schools, influence
differing patterns of access for girls and boys. In most contexts girls have
less access and are more prone to dropping out, but increasingly, often in poor
and urban environments, the pressure seems to be on boys to withdraw.
The study by Holmes (2003) found out that overall; females
receive less education than males, and they tend to dropout, or are withdrawn
earlier for both economic and social-cultural reasons. The study furthers
argues that the opportunity cost of sending female children to school in rural
areas, where girls are married quite early, is high because benefits of their
schooling will not accrue to their parental household. Similarly Kasente,
(2004), Kakuru, (2003) explain how early marriages influence children's
dropping out of school especially as regards the girl child as it is perceived
by parents that marrying off the girl child is an escape route from poverty.
Uganda Participatory Poverty Assessment (UPPAP, 2000) indicates that marrying
off girls would benefit her family in terms of attaining bride price.
Odaga and Heneveld (1995), further note that parents worry
about wasting money on the education of girls because there are most likely to
get pregnant or married before completing their schooling and that once
married, girls become part of another family and the parental investment in
them is lost this therefore perpetuates parents discouraging the girl child
from continuing with school.
Findings with regard to the impact of parent's education on
schooling of children show that the children of more educated parents are more
likely to be enrolled and more likely to progress further through school.
Holmes, (2003) shows that this impact differs by gender, the education of the
father increases the expected level of school retention of boys, and that of
the mother's enhances the educational attainment of girls. Similarly other
studies by Behrman et al. (1999) and Swada and Lokshin (2001) reported a
consistently positive and significant coefficient of father's and mother's
education at all levels of education except at secondary school level.
United Nations Children Education Fund (UNICEF, 1999); MOES,
(1995); Government of Uganda (GOU, 1999) Horn (1992); all demonstrate that
Parental decisions do affect children retention. Students whose parents monitor
and regulate their activities, provide emotional support, encourage independent
decision making and are generally more involved in their schooling are less
likely to drop out of school (Astone and McLanalan, 1991; Rumberge et al.,
1990; Rumber 1995; Odaga and Heneveld, 1995; and Russel, 2001).
Taking into account of the gender dimension of dropouts,
UNICEF, (2005) notes that girls are more likely to drop out of school than boys
and that pupils whose mother's have not attained any level of education will
most likely dropout of school.
Russel, (2001); Bickel and Pagaiannis, (1988); Clark, (1992);
and Rumberger, (1983) demonstrate that communities can influence dropout rates
by providing employment opportunities during school.
While some researchers have found out that work can contribute
to a student dropping out, others have showed that student employment begins to
correlate with dropping out when the student regularly works over 14 hours per
week (Mann 1986, 1989). Other research place the critical level for employment
higher, at 20 hours per week (Winters 1986), with the likelihood of dropping
out increasing with the number of hours worked.
In an account for the gender disparity in primary school
dropout, Nyanzi (2001) put forward that marriage, pregnancy and sickness are
major causes of drop out among girl children while amongst the boys, they
include; jobs, lack of interest dismissal and fees.
2.3 The relating to
consequences of school dropout and strategies to be taken
Personal and societal consequences of dropping out of school
are costly. Dropouts experience Dropouts are also more likely than graduates to
become dependent on welfare, engage in illegal activities, and experience
health and affective problems (Rumberger , 1987). Finally, high rates of
dropping out of school create a negative momentum for youth in a society,
particularly during difficult economic periods when even a high school diploma
does not guarantee a job. Such momentum may foster even higher dropout rate s
in the future.
Most studies that investigated the predictive variable s of
school dropout focused on personal (i.e... behavioral, academic, intellectual)
and familial factors. These studies found that an early disruptive profile
(Ensminge r & Slusarcick, 1992), low achievement in elementary school
(Garnie r et al., 1997), and parental support and supervision
(Howel l & Frese, 1982; Rumberger et al., 1990) predict
early withdrawal from school even after controlling for socioeconomic factors.
However, as underlined by Hymel et al. (1996), far less attention has been
given to the role of peers in contributing to school dropout. More than a
decade ago, Parker & Asher (1987) suggested that social factors may be
better estimates of leaving school without graduating for the majority of
dropouts with average or above intelligence than cognitive or parental factors.
The few studies that investigated the role of peers did so without considering
academic and familial factor s (e.g . Elliott & Voss,1974; Cairns et al.,
1989), however. Consequently, no study (to our knowledge) has considered the
contribution or the role of peer-related variables above and beyond personal
and familial variables in a comprehensive model intended to predict early
withdrawal from school.
Two peer variable s have been linked with dropping out of
school: rejection from conventional peers and association with deviant peers.
For instance, many children with disruptive behaviors experience peer rejection
(Coie , 1990). This is important in that peer rejection has been predictively
linked, in some, but not in all studies, to dropping out of school (se e Hymel
et al., 1996). In addition, many rejected children have no friends in the
classroom tha t might buffe r th e impact of negative social experiences at the
group level. Actually, lack of friend s may increase the risk for school
disengagement. Kupersmidt et al. (1990 ) suggested that rejection from peers
and lack of friend s exacerbated th e frustration s of low grades and
punishment fo r low achievement and increased adolescents ' motivation to leave
school prior to graduation . In support to this position, Kupersmidt (1983)
showed that peer status significantly predicted late r academic adjustment even
after controlling for sex, race, grade point average and child' s reputation
among peers for starting fights. However, in this study, academic maladjustment
included grade retention and truancy and no t jus t dropping out of school.
Ollendick et al. (1992) also reported that 9-year-old rejected children failed
more grades and were more likely to drop out of school 5 years late r than
non-rejected children. Consequently, these negative social experiences may
contribute to or mediate the link between disruptiveness and dropping out.
In addition to their independent or mediating role, peer
acceptance may also condition (i.e. moderate) the propensity of disruptive or
learning disabled children to drop out of school and help explain why some, but
not all at risk children dropout of school.
In turn, peer rejection might be moderated by parental
factors. For example,
Steinberg et al. (1992), showed that parental support for
academic attainment buffered children who were unpopular with their peers from
dropping out of school. However, it is also possible that social acceptance has
no independent contribution to dropping out of school as indicated by finding s
from Kupersmidt & Coie (1990 ) and
School and Community
Perspective
· Systemic Renewal
General Definition: Systemic renewal calls
for a continuing process of evaluating goals and objectives related to school
policies, practices, and organizational structures as they impact a diverse
group of learners.
«To prevent and correct serious attendance problems,
schools need to change the way they are structured, improve the quality of
courses, and intensify interpersonal relationships between students and
teachers» (Epstein & Sheldon, 2002, p. 309).
«Research has identified a student's attitude towards the
school is the single most important factor in combating truancy. It is then the
responsibility of the school administrator to fashion a school where children
want to attend as opposed to having to attend» (Gullatt &
Lemoine,1997,p. 18).
«Systemic solutions to attendance problems will originate
from a system that is made up of teachers and administrators who understand the
connectedness of a supporting climate, significant relationships, engaging and
challenging content and instruction, rules, policies and procedures»
(Wagstaff, Combs, & Jarvis, 2000, p. 29)
· School-Community Collaboration
General Definition: When all groups in a
community provide collective support to the school, a strong infrastructure
sustains a caring environment where youth can thrive and achieve.
«Truancy is costly. . . . It costs businesses, which must
pay to train uneducated workers. It costs taxpayers, who must pay higher taxes
for law enforcement and welfare costs for dropouts who end up on welfare rolls
or underemployed» (Garry, 1996. p. 2).
Successful efforts to improve attendance view truancy as more
than just a «school» issue and involve the entire community (Gullatt,
& Lemoine, 1997).
· Safe Learning Environments
General Definition: A comprehensive violence
prevention plan, including conflict resolution, must deal with potential
violence as well as crisis management. A safe learning environment provides
daily experiences, at all grade levels, which enhance positive social attitudes
and effective interpersonal skills in all students.
One of the causes of truancy is school climate, including
feelings of physical safety (Heilbrunn & Seeley, 2003).
«Victims of bullying suffer consequences beyond
embarrassment. Some victims experience psychological and/or physical distress,
are frequently absent and cannot concentrate on school work» (Sampson,
2004, p. 12).
Bullies are more likely to be truant and drop out of school
(Children who bully, n.d.).
Early Childhood Education
General Definition: Birth-to-five
interventions demonstrate that providing a child additional enrichment can
enhance brain development. The most effective way to reduce the number of
children who will ultimately drop out is to provide the best possible classroom
instruction from the beginning of their school experience through the primary
grades.
«Early absenteeism is an important predictor of dropping
out of high school» (Epstein & Sheldon, 2002, p. 309).
· Early Literacy Development
General Definition: Early interventions to
help low-achieving students improve their reading and writing skills establish
the necessary foundation for effective learning in all subjects.
«The National Council of Teachers of Mathematics and the
National Association for the Education of Young Children affirm that
high-quality, challenging, and accessible mathematics education for 3- to
6-year-old children is a vital foundation for future mathematics learning»
(National Council of Teachers of Mathematics, 2005).
«Chronic truancy is often the first step on the road to
illiteracy, and all its attendant ills» (American Bar Association, 2001,
p. v).
Basic Core Strategies
· Mentoring/Tutoring
General Definition: Mentoring is a one-to-one
caring, supportive relationship between a mentor and a mentee that is based on
trust. Tutoring, also a one-to-one activity, focuses on academics and is an
effective practice when addressing specific needs such as reading, writing, or
math competencies.
«Students report that having a person at school who is
checking up on them, gives the sense that someone cares and motivates them to
come to school» (Gonzales, Richards, & Seeley, 2002,p.12).
Two major national studies have reported positive results from
mentoring programs. Tierney and Grossman (1995) report a 37% decrease in
truancy among participants in the Big Brother/Big Sister programs. The
Commonwealth Fund's Survey found a 52% decrease in skipping school among
participants of mentoring programs (McLearn, Colasanto, & Schoen, 1998).
· Service-Learning
General Definition: Service-learning connects
meaningful community service experiences with academic learning. This
teaching/learning method promotes personal and social growth, career
development, and civic responsibility and can be a powerful vehicle for
effective school reform at all grade levels.
Service-learning helps students to see the value of education
through direct experiences in the community, and the process develops more
positive attitudes toward school and education in general (Garman, 1995).
«Studies of the effects of service-learning on grades,
attendance, and dropout reduction indicate the value of this strategy for
students who have significant risk factors» (Shumer & Duckenfield),
2004, p. 156.
· Alternative Schooling
General Definition: Alternative schooling
provides potential dropouts a variety of options that can lead to graduation,
with programs paying special attention to the student's individual social needs
and academic requirements for a high school diploma.
«Among the advantages of alternative schools for students
at risk of dropping out are reductions in truancy and drop-out rates, ... and
re-engagement with learning and the community that can occur when students are
in a more responsive and flexible environment» (Paglin & Fager, 1997,
p. 3).
«Graduates of alternative schools report that alternative
school experiences made all the difference in helping them to become productive
citizens» (Morley, 2002, p. 40).
· After-School Opportunities
General Definition: Many schools provide
after-school and summer enhancement programs that eliminate information loss
and inspire interest in a variety of areas. Such experiences are especially
important for students at risk of school failure because they fill the
afternoon «gap time» with constructive and engaging activities.
«After school sports or other programs at the school site
give students a chance to make new friends, experience a positive atmosphere,
and feel a sense of accomplishment, which, in turn, may reduce their likelihood
of skipping school» (DeKalb, 1999, p. 3).
«Well-designed and effectively implemented after-school
programs add to the chances that at-risk students will stay out of trouble,
stay in school, and stay engaged with their education» ( Peterson &
Fox, 2004, p.183).
2.4 Summary of the
literature review
Considering the opinions and ideas from the literature review,
it can be noticed that although countries committed their efforts to strengthen
their education systems, such as increase in enrolment rate, there still are
difficulties that their systems facing, more specifically dropout that cause
certain children to lose benefit from education due to various factors as
mentioned in the literature above. This situation exposes those countries to
taking certain measures or reactions in response to avoid the impact of those
factors, mainly dropout from schools as well as consequences associated with
them. As it was shown above dropping out of school have serious consequences
for students, their families. Students who decided to drop out of school face
social stigma, fewer job opportunities, lower salaries, and higher probability
of involvement with the criminal justice system.
CHAPTER THREE: RESEARCH
METHODOLOGY
3.1. Introduction
Swetnam (2004) defined research methodology as the way to
tackle the question of «how am I going to find out the answers?».The
purpose of this chapter is identifying the appropriate methodology that is
undertaken for this study. This methodology demonstrates the entire process of
this study, as well as an analysis of the various research methods employed
during the conduct of the research. This section describes the practical
procedures for carrying out the study.
It gives the details of the research design that were
adopted, population study, sampling procedures, data collection procedures, and
the final data analysis techniques that will apply. It gives the framework
within which data are collected and analyzed.
Additionally, this chapter examines the research methodology
suitable for analyzing the «Impact of one cup of milk per child on
children dropout». The methodology demonstrates
the entire research process as well as an analysis of the various research
techniques that have been administered. Besides, this chapter considers the
research design and methodology on which the memoire is based.
3.2. General Description of
the study
In this section, the following items are described: population
study, sample size determination and sampling techniques, description of the
instruments of data collection, data processing, data analysis, and limitation
of the study.
3.2.1. Research design
Christensen (1991); defines research design as an outline, a
plan or a strategy specifying the procedures to be used in investigating the
research problem. It is simply the framework or plan a study used as a guide in
collecting and analyzing data. For the purpose of the current study the survey
method will be adopted.
The research Design of this study is exploratory means and
descriptive, that it will involve testing a hypothesis and deriving that
hypothesis from available theories. To gather the needed data, fieldwork will
be conducted in Huye primary schools using double data collection methods.
Questionnaire and interview sheets will be used to
get perception and clear profile of the impact of one cup of milk per child on
dropout of schools. The data was analyzed and presented in comparative
format.
This study will involve both qualitative and quantitative
data. The qualitative data collection technique is subjective in nature since
it involves examining the perception of teachers. Numerical data analysis and
statistical tests are objective in nature and deal with measuring phenomena.
For this study, regression analysis will be conducted; frequencies and
hypotheses testing will be used.
3.2.2. Purpose of the study
The purpose of this study was to analyze the impact of one cup
of milk per child program on children dropout within Huye primary schools.
3.2.3. Study process
The study is fully described and understood. It was important
to analyze in the process through which the study is conducted. This study
holds both quantitative and qualitative study because during the study
numerical data was collected and analyzed. In this research qualitative
hypothesis testing was used because during the study theoretical elements in
depth interviews were considered.
3.2.5. Outcome of the study
The outcome of the study will be used by proceeding
researchers in the related field, decision makers, public sectors and others
with interest of promoting standards of living through the promotion of primary
school learning.
2 .3 Conceptual
framework
A conceptual framework represents the relationship between
variables in the study diagrammatically. The factors that influence the school
dropout within Huye district are illustrated in Figure 2.1 below.
· Dependent variables
The dependent variable is the school level of dropout which is
affected positively or negatively by different variables including school
level, household level, and community level factors.
· Independent variables
The independent variables that can affect positively or
negatively the levels of dropout are: the illiteracy of child's parents,
child's family poverty, long distance from school, failure or repetition,
etc.
Figure 2 Conceptual Framework
between Level of dropout and factors affecting it
The Illiteracy of child's parents
Corporal punishment of children at schools
Primary School dropout level.
Child's family poverty
Child employment
Distance of child's household from the school
![]()
Repetition of failure of children
Source: Author
3.4 Geographical
location of huye district
HUYE district is located in southern province of
Rwanda.
Figure 3 Geographical
location of Huye district

Source: Arc GIS
The district of Huye is located in the southern province of
the Republic of Rwanda, whereby it is known as one of advanced regions in
education industry of Rwanda. This district is the one which recognized the
existence of the first University to be in Rwanda since 1963. Besides this Huye
district has known famous schools in secondary studies as well as in primary
learning. Basing on the intention the researcher in conducting this research,
Huye district currently is employing 1100 teachers within primary schools who
are counted within only 98 primary schools which are under the supervision of
the director in charge of education within the district.
Certain schools are located in urban areas whereas others are
found in rural areas of Huye district.
3.5 Population study,
Sample size and Sampling techniques
3.5.1 Target
population.
Grinnell et al (1990) defined population as the totality of
persons or objects concerned with the study. Manheim & Rich (1995) define
population as a set cases about which one wishes to draw some conclusions. In
this research the populations are all primary schools of Huye.
The sample survey will be applied on selected schools with and
without the program of one cup of milk per child in HUYE district. The
population sample which will be used in the research was 60 teachers as well as
headmasters from selected schools in Huye district. The researcher will collect
data from the sample by using questionnaires and interviews.
3.5.2 Sampling design
Sampling is concerned with the selection of a subset of
individuals from within a statistical population to estimate characteristics of
the whole population.
MARK .L. and David (1990) state that it is usually too time
consuming, costly cumbersome and insufficient to motivate, do or obtain a
complete census or count of the target population. Thus, the researcher decides
it is his goal to make inferences about the entire population inclusive in the
research study. However though a necessary evil, this is contrary to some
scholars as they ideally feel that the whole population should be used to get
the information for the researcher.
A sample design is a definite plan for obtaining a sample from
a given population. It refers to the technique or the procedure the researcher
adopted in selecting items for the sample.
Berman (2006) provided the advantages of sampling population
are:
· The likelihood that it will cost less to sample than to
do a census, why ask all people within primary schools Huye, when you can
reliably get what you need to know by asking a few among them?
· The possibility of greater accuracy
· The greater speed of data collection
· The time management
3.5.3 Sample size determination
3.5.4 Sample selection
From the population of 98 primary schools of Huye, 4 schools
were selected.
To ensure that all people were equally represented, the
researcher used proportional stratified sampling as shown in table below as a
result 60 teachers in selected primary schools were selected at 95% of
confidence level.
Table 3.1:
Table 3 Sample
selection
|
Schools
|
With the program
|
Without the program
|
Total
|
|
1
|
2
|
3
|
4
|
|
Teachers
|
18
|
16
|
10
|
16
|
60
|
|
Headmaster/ head teacher
|
1
|
1
|
1
|
1
|
4
|
Source: Author
3.6. Description of the
instruments of data collection
The researcher will use the questionnaire, interview schedule
and documentation.
3.6.1. Questionnaire
As defined by Grinnell and Williams (1990) questionnaire is a
set of questions which calls for responses on the part of the client, may be
self administered or group administered. This method is used to collect data
from respondents hoping to get people's perceptions, feelings and views since
each respondent will be given time to fill the structured questionnaire and
justifications for the responses given whenever it was necessary.
3.6.2. Interview schedule
Unlike the questionnaire, the researcher himself will use a set
of structured questions where questions will be read to the respondents and
answers given will be recorded. Due to the importance of the information from
some respondents in the institutions of the study and due to the limited time
these people may have to fill the questionnaire, the interview schedule may be
found appropriate to save time and have this important information at the
research disposal.
3.6.3. Documentation
Documentation is another technique that will be used along
with interviews and questionnaires. This involves primary analysis of related
documents. By this instrument, literature was reviewed especially the writings
of other authors on the subject matter of the study.
3.7. Data Processing and
Analysis
Data processing is broadly, the collection and manipulation of
items of data to produce meaningful information. In this sense it can be
considered a subset of processing, the change of information in any manner
detectable by an observer. It is important to show the various tools at which
the data were obtained from the field.
Data analysis is the process of systematically applying
statistical and or logical techniques to describe and illustrate, condense and
recap, and evaluate data. According to Shamoo and Resnik (2003) various
analytic procedures provide a way of drawing inductive inferences from data and
distinguishing the signal(the phenomenon of interest) from the noise
(statistical fluctuations) present in the data.
3.7.1. Coding
Coding will be used to summarize data by classifying different
responses in categories that are easily understandable.
3.7.2. Editing
Editing refers to a process whereby errors are eliminated
whenever identified in interview schedules and the questionnaires. The
researcher followed this procedure in order to minimize errors and mistakes.
Unnecessary phrases, words and repetitions, and other sorts of such kind will
be minimized to facilitate accuracy, uniformity legibility and consistency of
data to the best of the researcher.
3.7.3. Tabulation
The tabulation process will involve determination of the
frequency of the responses for every variable and fixing data into statistical
tables. Kakinda (1990) says that after data is edited and coding frame
established, and data coded, it is often tabulated and may undergo other
statistical manipulation.
3.8 Methods of data
analysis
The researcher used two types of methodologies, namely:
descriptive statistics (frequency statistics and bivariate analysis) and
multivariate analysis using multinomial logistic regression which was used to
identify the direction of effect for each independent variable adjusting for
the others on the level of dropout existing in schools within whhich this
research was conducted.
3.8.1 Descriptive
statistics
The descriptive statistics of variables is important for
summarizing the characteristics of the sample. Bivariate analysis using
chi-square test was used to identify if there is a relationship between the
dependent variable and each independent variable.
The chi-square formula is 
Where O is the observed frequency in each category of
independent variable
E is the expected frequency in the corresponding category of
independent variable
 : is the chi-square value
3.8.2 Multivariable
analysis
Multivariable logistic regression analysis extends the
techniques of multiple regression analysis to research situations in which the
outcome variable is categorical (Dayton 1992). Generally, logistic regression
is well suited for describing and testing hypotheses about relationships
between a categorical outcome variable and more categorical predictor
variables. Multinomial logistic regression was typically used in this study
because the dependent variable has more than two categories (Bender and Grouven
1997)
3.8.3 Multivariable logistic regression
model
The conditional likelihood by a set of parameters ( ) given data (x and
  ) is
) is  . Intuitively,
  follows a probability distribution that is different for x, but x
itself is never unknown, so there is no need to have a probabilistic model of
it. For each x there is different distribution of
follows a probability distribution that is different for x, but x
itself is never unknown, so there is no need to have a probabilistic model of
it. For each x there is different distribution of , but all these distributions share the same parameters (
 ). Given data consisting of (
 ) pairs, the principle of maximum conditional likelihood says to choose
a parameter estimate
) pairs, the principle of maximum conditional likelihood says to choose
a parameter estimate  that maximizes the product
 . Note that we do not need to assume that
  are independent in order to justify the conditional likelihood being a
product; we just need to assume that
are independent in order to justify the conditional likelihood being a
product; we just need to assume that  are dependent when each is conditioned on its own
 . For any specific value of x,
  can then be used to predict values for y; we assume that we never want
to predict values of x. Suppose that y is a multinomial outcome and that x is a
real-valued vector. We can assume that the distribution of y is a fixed
nonlinear function of a linear function of x. Specifically. We assume the
conditional model:
can then be used to predict values for y; we assume that we never want
to predict values of x. Suppose that y is a multinomial outcome and that x is a
real-valued vector. We can assume that the distribution of y is a fixed
nonlinear function of a linear function of x. Specifically. We assume the
conditional model:
Responses ( 's) are categorical variables with more than two categories (coded 1 for
high level, code 2 for middle level, coded 3 for low level of dropout).
Predictor values (
's) are categorical variables with more than two categories (coded 1 for
high level, code 2 for middle level, coded 3 for low level of dropout).
Predictor values ( 's) can be categorical. We are interested in modeling
  in terms of
 :
: 
 is a multinomial random variable, whose proportion parameter
 depends on predictors' variable
 . The ratio
  is called the odds of the event y given and
  is called the log of odds. Since probabilities ranged between 0 and 1,
odds range between 0 and 1, odds range between 0 and
is called the log of odds. Since probabilities ranged between 0 and 1,
odds range between 0 and 1, odds range between 0 and  , log odds range unboundedly between
  . A linear expression of the form
  can also take unbounded values, so it is reasonable to use a linear
expression as a model for log odds, but not as a model for odds for odds or for
probabilities. Essentially, logistic regression is the simplest reasonable
model for a categorical outcome that depends linearly on predictors
can also take unbounded values, so it is reasonable to use a linear
expression as a model for log odds, but not as a model for odds for odds or for
probabilities. Essentially, logistic regression is the simplest reasonable
model for a categorical outcome that depends linearly on predictors . For each feature i,
  is a multiplicative scaling factor on the odds
 . If the predictor
  is real-valued, then
  is the extra odds of having the outcome y=1 when the value of
  increased by one unit.
In fact, the ratio is the probability of occurrence of an
event to the probability of its not occurrence. If there is a probability  for the level of dropout, then the odds can be considered the ratio of
the probability for the level of dropout over the probability for no
dropout.
for the level of dropout, then the odds can be considered the ratio of
the probability for the level of dropout over the probability for no
dropout.
An odds ratio (OR) is a measure of association between an
exposure and an outcome. The OR represents the odds that an outcome will occur
given a particular exposure, compared to the odds of the outcome occurring in
the absence of that exposure.
Multinomial logistic regression models make it possible to
estimate the probability for dropout level on the combination of independent
variables included in the model.
The model in terms of probability of outcome occurring is:
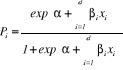
 = Odds ratio for a person having characteristics i versus not having
it
= Odds ratio for a person having characteristics i versus not having
it
 =Regression coefficients
  =constant
  = ith variable Where; i=1, 2, ...., k
 = probability of outcome occurring
3.9. Limitation of the
Study
In this study the researcher faced a number of problems:
· Time and financial resources.
· The refuse of some respondents during the data
collection process
· Limited access to secondary data concerning the records
relating to the program since the starting time of its implementation
CHAPTER FOUR: DATA ANALYSIS
AND INTERPRETATION
4.1 Introduction
As reviewed in chapter two, the level of dropout within
primary schools was influenced by various independent varibles either
positively or negatively. Therefore, this chapter showed whether those factors
including one cup of milk per child program, long distance from school, prent's
illiteracy, family poverty, etc. Influence the level of dropout within primary
schools of Huye.
Whithin this chapter the researcher dealt with the analysis
and interpretation of the data collected for the achievement of the objectives
as described in chapter one. It involved the presentation of data, discussion
of major findings of the study and their interpretation. Percentage,
frequencies were used as means of analyzing and interpreting the data, some
hypotheses were tested using statistical tests such as chi-square.To make data
analysis more understandable and clear, data collected was analyzed, tested and
interpreted before drawing conclusion. The analysis was made on sample of 60
primary school teachers as well as headmasters of the selected schools taken
from the whole population of the schools in Huye district. The statistical
analysis package used during the analysis was SPSS version 16.
4.2. Profile of
respondents:
The following results have been found by discussing with about
60 primary teachers from 4 selected primary schools of Huye. the aim was to
make the findings of the study more easily analyzed, presented and interpreted
. The aim was evaluating whether the milk provision into primary schools can
contribute to the reduction of school dropout and testing the impact that other
factors have on the dropout level.
Below is the Figure 4 showing the distribution of respondents
by both their level of education and gender whereby 33.3 percent were male
categorized into 30 percent having secondary level of education and technical
studies and 3.3 percent of those with university level and other higher
learning institutions. Females were counted to 66.7 percent divided into 55 of
those with secondary education leve and 11.7 percent of those with university
and other higher learning institutions.
Figure 4 Distribution of
respondents by their education level and Gender

Source: primary data
4.2 Results from the
percentage distribution of respondents by the level of dropout
Before describing the bivariate analysis and multinomial
logistic analysis, the study shows how the level to which students were
dropping out of schools by describing the percentages of each category as
mentioned in the table 4.1.
Table 4 Percentage
distribution of respondents by the level of dropout
|
Level of dropout
|
Percent
|
|
High
|
33.3
|
|
middle
|
23.3
|
|
low
|
43.3
|
|
Total
|
100.0
|
Source: primary
The table 4.1 illustrates that among all respondents to whom
the research was conducted, 33.3 percent of them reported that the level of
dropout within their schools was high while 23.3 percent reported that the
dropout within their schools was at the middle level. Finally, 43.3 percent
which represents the highest ratio reported that the dropout in their schools
was low.
Table 5 Percentage
distribution of respondents by factors affecting dropout
|
Variables
|
Percent
|
|
Distance from school
|
Yes
|
56.7
|
|
No
|
43.3
|
|
Total
|
100.0
|
|
Parents' illiteracy
|
Yes
|
76.7
|
|
No
|
23.3
|
|
Total
|
100.0
|
|
Child's Family poverty
|
Yes
|
81.7
|
|
No
|
18.3
|
|
Total
|
100.0
|
|
One cup of milk per child
|
Yes
|
55.0
|
|
No
|
45.0
|
|
Total
|
100.0
|
|
Failure or repetition
|
Yes
|
78.3
|
|
No
|
21.7
|
|
Total
|
98.3
|
|
Child employment
|
Yes
|
80.0
|
|
No
|
20.0
|
|
Total
|
100.0
|
Source: primary data
Table 4.2 shows that out of all respondents questioned whether
there is an influence of the distance from schools to the dropout decision of
children, 56.7 percent of respondents confirmed that it has an influence
whereas 43.3 percent neglected its influence on dropout. Concerning the
parents' illiteracy impact on dropout, 76.7 percent confirmed its impact
against 23.3 percent who denied its effect. Family poverty of children was
agreed to influence the dropout by 81.7 percent of respondents against 18.3 who
denied its effect. Out of respondents who were asked whether the program of one
cup of milk per child can help reducing the dropout level within schools 88.3
percent affirmed its effect against 11.7 percent who neglected it. Failure or
repetition of children was mentioned to be among the causes of dropout at 78.3
percent whereas 21.7 percent denied its effect. Finally, child employment was
considered among causes of dropout by 80 percent of respondents while 20
percent did not consider it.
4.3 Descriptive statistics
of causes of dropouts by the level of dropout
Table 6 Percentage
distribution of factors affecting dropout by the level of dropout
|
VARIABLES
|
LEVEL OF DROPOUT
|
TOTAL
|
|
HIGH
|
MIDDLE
|
LOW
|
|
Distance from school
|
Yes
|
26.5
|
32.4
|
41.2
|
100.0
|
|
No
|
42.3
|
11.5
|
46.2
|
100.0
|
|
Total
|
33.3
|
23.3
|
43.3
|
100.0
|
|
Parents' illiteracy
|
Yes
|
32.6
|
30.4
|
37.0
|
100.0
|
|
No
|
35.7
|
0.0
|
64.3
|
100.0
|
|
Total
|
33.3
|
23.3
|
43.3
|
100.0
|
|
Child's Family poverty
|
Yes
|
36.7
|
20.4
|
42.9
|
100.0
|
|
No
|
18.2
|
36.4
|
45.5
|
100. 0
|
|
Total
|
33.3
|
23.3
|
43.3
|
100.0
|
|
One cup of milk per child
|
Yes
|
12.1
|
18.2
|
69.7
|
100.0
|
|
No
|
59.3
|
29.6
|
11.1
|
100.0
|
|
Total
|
33.3
|
23.3
|
43.3
|
100.0
|
|
Failure or repetition
|
Yes
|
34.0
|
23.4
|
42.6
|
100.0
|
|
No
|
30.8
|
23.1
|
46.2
|
100.0
|
|
Total
|
33.3
|
23.3
|
43.3
|
100.0
|
|
Child employment
|
Yes
|
37.5
|
20.8
|
41.7
|
100.0
|
|
No
|
16.7
|
33.3
|
50.0
|
100.0
|
|
Total
|
33.3
|
23.3
|
43.3
|
100.0
|
|
Place of residence
|
Urban
|
27.6
|
20.7
|
51.7
|
100.0
|
|
Rural
|
38.7
|
25.8
|
35.5
|
100
|
|
Total
|
33.3
|
23.3
|
43.3
|
100.0
|
Source: primary data
The table 6 shows the percentage distribution of between
variables affecting the dropout and the level of dropout.
4.3.1 Distance from school
The table 6 illustrates that among the respondents who
affirmed the distance from school to be one of dropout causes, 26.5 percent
were from schools with high level of dropout while 32.4 percent were from
schools with middle level of dropout and 41.2 percent were from schools with
the low level of dropout. On the other side, respondents who denied the
influence of distance from school to the dropout level, 42.3 percent among them
were from schools with high level of dropout, while 11.5 percent were from
schools with middle level of dropout, and the other 46.2 were from schools with
the low level of dropout.
4.3.2 Parents' illiteracy
The table 6 shows that out of respondents who confirmed the
impact of parents' illiteracy on children's dropout decision, 37.0 percent
representing the highest percentage were from low level dropout schools against
30.4 percent representing the lowest percentage were from the middle level
dropout schools. While on the other, among those who underestimated the
influence of parents' illiteracy on children decision to dropout, 35.7 percent
were from high level of dropout schools against 64.3 percent who were from
schools with low level of dropout.
4.3.3 Child's Family
poverty
The highest percent of respondents, who were for the influence
of family poverty towards the dropout of a child, 42.9 percent were from the
low level of dropout schools against the lowest percentage which is 20.4. while
the highest percentage of those who were against its influence on dropout is
45.5 percent against 18.2 percent representing the smallest value.
4.3.4 One cup of milk per
child
Among the respondents upon who the study was conducted, the
highest percentage of those who confirmed the relationship between one cup of
milk per child and dropout was 69.7 from the schools with low level of dropout,
the lowest percent of them (26.4 percent) were from schools with high level of
dropout. For those who did not agree with its influence on dropout, the highest
percentage, which is 59.3, was from schools with high level of dropout against
11.1 percent representing the lowest.
4.3.5 Failure or repetition of
children
The figure 6 demonstrate that 42.6 percent representing the
highest percentage who agreed with that failure or repetition of children may
be a trigger to the decision of children to drop out were from the low level
of dropout schools against 23.4 percent representing the smallest who were from
the middle level ones. For those who against its influence, 46.2 percent
representing the highest value were from the low level of dropout schools
against 23.1 percent from the middle level ones.
Figure 5 Distribution of
respondents to whether the school has the program or no by the level of
dropout.
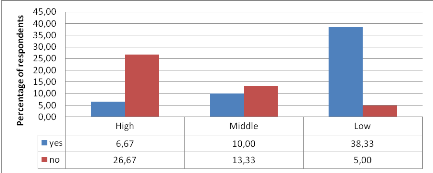
Source: primary data
According to the figure 5, illustration was made concerning
the level of dropout to whether the school has the program or does not. It is
shown that among schools with high level of dropout 26.67 percent were from
schools without the one cup of milk per child program against 6.67 percent from
schools with the program. Besides that, in the middle level of dropout schools
13.33 percent respondents were from schools with the program whereas other 10
percent were from schools without the program. Finally, among schools with the
low level of dropout 38.33 percent were from schools having the one cup of milk
per child program against 5 percent from schools without the program.
Figure 6 Figure showing the
distribution of consequences to child's family by the level of
dropout
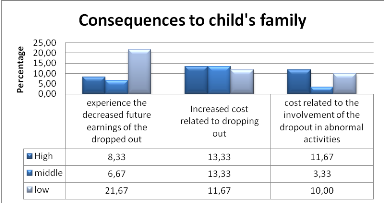
Source: primary data
As illustrated in figure 6 above, to all respondents
questioned about the consequences families of dropped out children, 13.33
percent representing the highest percentage among schools with high level of
education replied that families experience the increased cost related to
dropping out of their children whereas 8.33 percent representing the lowest
percentage among schools with high level of education replied that families
experience the decreased future earnings of their dropped out children.
Moreover, among schools with middle level of dropout, 13.33 percent mentioned
that families face the increased cost related to dropout whereas 3.33 percent
(the lowest ratio) considered the cost related to the involvement of the
dropout in abnormal activities. Finally, among schools with low level of
dropout, 21.67 percent, representing the biggest ratio, replied that families
will be exposed to the decreased earnings in future from their children who
dropped out while only 10 percent standing for the lowest percentage among low
level of dropout schools said that the consequences to families of the dropped
out children will be among others the cost related to the involvement of their
children in abnormal activities.
Figure7 Distribution of
respondents to the consequences to school against the level of
dropout.

Source: primary data
Figure 7 shows that out of all respondents among schools with
high level of education, 23.3 percent mentioned decrease in education
performance as a major consequence from school dropout against 1.7 percent
representing the lowest percentage who said that dropout causes burden to
teachers once children are resuming back to their previous classes as they
would have progressed to next class levels. In addition, 10 percent among
schools with the middle level of dropout considered the major consequence
associated with dropout to be the decrease in education performance against
only 1.7 percent in the sense that consequences of dropout are out the
mentioned ones. Eventually, the 16.67 percent of respondents from schools with
low level of dropout suggested that decrease in education performance can be a
major consequence of school dropout whereas 1.7 percent did not find any of
those mentioned consequences but said that consequences associated with dropout
are not in range of the mentioned ones.
Figure 8 Distribution of
respondents regards consequences of dropout to a country by the level of
dropout.

Source: primary data
Figure 8 shows that for all respondents categorized by level of
dropout, increase in illiteracy level was confirmed by 21.67 percent from high
level of dropout schools against 10 percent from middle level representing the
lowest percentage who considered it to be among major consequences of dropout
at the national level. Secondary, fail to achieve the expected level of
education for all was claimed by 15 percent from low level of dropout schools
against 6.67 percent representing the lowest percentage from middle level of
dropout schools. Increased future cost due to illiteracy was mentioned by 6.67
percent from high level of dropout schools whereas other levels have an equal 5
percent. Finally 1.67 percent for both middle and low level of mentioned other
consequences to the country due to dropout.
4.4 Results from bivariate
analysis using chi-square test
The relationship between independent variables, namely
distance from school, child's failure or repetition, child's family poverty,
parents' illiteracy of children, child employment, the place of residence, as
well as the one cup of milk per child program to the level of dropout within
schools is presented in table 4.4. A chi-square test at 0.05 significant level
was used to examine the association between all the above mentioned factors to
the dropout level.
Table 7 Chi- square test
table illustrating association between level of dropout and its
factors
|
Variables
|
Values ( ) )
|
Degree of freedom
|
P-values
|
Test of association
|
|
Distance from school
|
3.928
|
2
|
0.14
|
No association
|
|
Parents' illiteracy
|
6.142
|
2
|
0.046
|
Weak association
|
|
Child's Family poverty
|
1.922
|
2
|
0.383
|
No association
|
|
One cup of milk per child
|
22.495
|
2
|
0.000
|
Strong association
|
|
Failure or repetition
|
0.064
|
2
|
0.969
|
No association
|
|
Child employment
|
2.047
|
2
|
0.359
|
No association
|
|
Place of residence
|
1.636
|
2
|
0.441
|
No association
|
Source: primary data
Many studies reviewed in chapter two have illustrated various
types of factors affecting the primary school dropout. This study illustrates
that the link between the distance from school and the level of dropout;
Chi-square test shows that the distance from school is not statistically
associated with the level of dropout because it p-value is greater than the
level of significance (p> ; 0.14>0.05). Looking to the one cup of milk per child program has a
strong relationship with the dropout level within schools as its p-value is
less than the level of significance (p<
; 0.14>0.05). Looking to the one cup of milk per child program has a
strong relationship with the dropout level within schools as its p-value is
less than the level of significance (p< ; 0.000<0.05) and again parents' illiteracy was proved to have a weak
relationship the level of dropout within schools as long as its p-value found
is less than the level of significance (p<
; 0.000<0.05) and again parents' illiteracy was proved to have a weak
relationship the level of dropout within schools as long as its p-value found
is less than the level of significance (p< ; 0.046<0.05) while the factors family poverty, failure or repetition
of children, children employment, and place of residence of schools were all
demonstrated to have no significant relationship with the level of dropout as
their respective p-values were greater than the level of significance (0.383,
0.969, 0.359, 0.441>0.05).
; 0.046<0.05) while the factors family poverty, failure or repetition
of children, children employment, and place of residence of schools were all
demonstrated to have no significant relationship with the level of dropout as
their respective p-values were greater than the level of significance (0.383,
0.969, 0.359, 0.441>0.05).
4.5. Conclusion
The chi-square analysis shows the relationship between the
level of dropout and the factors affecting the dropout of children at primary
level. Only one cup of milk per child program was proved to have a strong
relationship with the dropout level. In addition to the one cup of milk per
child program, parents' illiteracy was illustrated to have a weak relationship
with the level of dropout against other factors family poverty, distance from
school, place of residence of schools, failure or repetition child employment
who had no significant relationship with the level of dropout.
4.6 Results from multivariable analysis
A bivariate analysis was used to examine the relationship
between each independent variable and dropout within primary schools,
especially for the level of dropout. The findings from bivariate analysis
illustrate whether there is an association among independent variables and the
level of dropout. A bivariate analysis among two variables does not necessarily
imply a significant causal relationship between them. The multinomial logistic
regression analysis method was preferred in this study, which allowed the
identification of the effect of each independent variable on the level of
dropout. Only one cup of milk per child program and parents' illiteracy were
considered up to this step as long as they are the only variables with
significant relationship with the level of dropout.
During this analysis, two models were displayed, the first
model was high level of dropout to low level of dropout and the second was
middle level of dropout against the low level of dropout. The table 4.5
illustrates the coefficients that were used to build those models.
The logistic regression model estimates a model of the
form:
 =
=
 : One cup of milk per child program
  : Parents' illiteracy
Table 8 Parameter estimates
for multinomial logistic model
|
At which level is the dropout within your school
?a
|
B
|
Std. Error
|
df
|
Sig.
|
|
High
|
Intercept
|
1.362
|
.881
|
1
|
.122
|
|
[one_cup_milk=1]
|
-3.420
|
.834
|
1
|
.000
|
|
[one_cup_milk=2]
|
0b
|
.
|
0
|
.
|
|
[illiteracy=1]
|
.441
|
.908
|
1
|
.627
|
|
[illiteracy=2]
|
0b
|
.
|
0
|
.
|
|
Middle
|
Intercept
|
-17.740
|
.744
|
1
|
.000
|
|
[one_cup_milk=1]
|
-2.314
|
.875
|
1
|
.008
|
|
[one_cup_milk=2]
|
0b
|
.
|
0
|
.
|
|
[illiteracy=1]
|
19.136
|
.000
|
1
|
.
|
|
[illiteracy=2]
|
0b
|
.
|
0
|
.
|
a. The reference category is: low.
b. This parameter is set to zero because it is redundant.
Source: primary data
The logistic regression model for the high level of dropout is
displayed here below:


The logistic regression model for middle level of dropout is
displayed as follows:
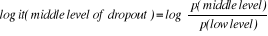

The logistic regression coefficients indicate the direction of
the relationship by showing which factors increase or decline the likelihood of
high level of dropout within schools. The odds ratios represent the change in
odds of being in one of the categories of outcome when the value of a predictor
increases by one unit. For categorical independent variables, the test provides
a separate coefficient for each category of the variable. In addition, a
positive logistic regression coefficient for any category of an independent
variable is associated with an odds ratio greater than one, which indicates
that this category has a greater likelihood of experiencing the event relative
to the reference category.
The one cup of milk per child program is associated with the
level of dropout within schools with a negative direction for both yes and no
coded values. The one cup of milk per child is 3.42 times likely to decrease
the high level of dropout, 2.314 times likely to decrease the middle level of
dropout within primary schools.
The parents' illiteracy of children has a positive influence
on the level of dropout within primary schools, the Yes coded value is 0.441
times likely to increase the high level of dropout within primary schools, and
is 19.136 times likely to increase the middle level of dropout within
schools.
The multinomial logistic regression was used for groups of
variables to predict the change of probabilities for the level of dropout based
on the combination of independent variables included in the model. The
probabilities that a school will have the dropout (high and middle level) are
presented below:

The probability for a school to have a high level of dropout
with the one cup of milk per child program and experiencing parents' illiteracy
of children is calculated as the following:


The probability for a school to have a middle level of dropout
having the program of one cup of milk per child and experiencing the illiteracy
of child's parents is forth below demonstrated:


The probability for a school having both one cup of milk per
child and experiencing the illiteracy of child's parents to be at a middle
level of dropout is higher, with about 29 percent, than the probability of
being at a high level of dropout, with almost 17 percent.
CHAPTER FIVE: CONCLUSION AND
RECOMMENDATIONS
5.1 INTRODUCTION
This chapter presents the summary of research work, the major
findings concerned the Impact of one cup of milk per child on dropout reduction
are also given, furthermore the chapter presents down conclusions and
recommendations concerning policies, measures and strategies that can be
undertaken for dropout eradication among primary schools of Rwanda. The study
was conducted in 4 selected Huye primary schools, two having one cup of milk
per child program and other two without the program.
5.2 Discussion concerning the findings
The main objective of the study was to analyze the impact of one
cup of milk per child program on school dropout. The study further had the
specific objectives which were:
To identify the causes influencing primary school dropout in
Huye district; To examine the relationship between one cup of milk per child
and school dropout level in primary schools of Huye district; To find out the
consequences associated with school dropout in Huye district.
Basing on the objectives of the study primary data was
collected with the use of questionnaire distributed among respondents; other
data collection methods that were used by researcher to obtain data were
documentation, interview, as well as observation.
The findings revealed that majority of selected respondents
accordingly their gender female occupied a higher percentage of respondents
with 67.7 percent. Accordingly their educational level, those with secondary
and technical education level occupied 85 percent this means that female in
education industry are abundant that is to say that empowering girl's education
is at the same time providing a sustainable education system.
For all respondents on whom the study was conducted, the
greater percentage was that of the low level of dropout schools reaching 43.3
percent, though a lot has been made towards the growth of education system in
Rwanda but there is still a need to keep on track improving the system for
other levels such as high and middle, counting 56.7 percent, to be totally
eradicated from primary schools within Rwanda.
Among all factors of dropout discussed about in the
literature, the respondents mentioned that distance from schools, parents'
illiteracy, child's family poverty, one cup of milk per child, failure or
repetition of children, and child's employment as well as the school location
are influencing the level of dropout within schools.
In order to determine relationship between level of
dropout and factors affecting it, chi-square test of relationship was used
where the level of significance was 5 percent; the findings of the study
indicate that there is a strong relationship between one cup of milk per child
with 0.000 (p-value) and the level of dropout within primary schools, while a
weak relationship was proved from the findings between the level of dropout and
parents' illiteracy with 0.046 (p-value). This indicates that as long as
parents' illiteracy persists it is hard for policy makers to eradicate the
dropout within primary schools and again for policy makers to ensure the
decreased level of dropout one cup of milk per child program can better serve
as a strategy for dropout reduction.
The most of respondents (38.33 percent) from schools with low
level of dropout reported that their schools had one cup of milk per child
program. The most of respondents (26.67 percent) who reported that their
schools had not one cup of milk per child were from schools with high level of
dropout schools. This is to mean that the reason behind this difference was due
to the existence of one cup of milk per child
The most of respondents (21.67 percent) from schools with low
level of dropout said that consequence families are facing due to dropout is
experiencing the decreased future earnings of the dropped out children. In
addition, the majority of respondents (23.3 percent) from schools with low
level of dropout reported that school will be facing a deacrease in education
performance. Finally, 21.67 percent presenting high number of percentage, from
schools with low level of dropout, considered the increase in illiteracy level
to be the major consequence that a country will be exposed to due to dropout.
Results from multiple logistic regression model have shown
that, the dropout within schools with high level of dropout is strongly
affected by the one cup of milk per child program with a coefficient of
relationship equates by -3.42; not only that but also it is affected by
parents' illiteracy with a negative coefficient 0.441. this indicate that the
increase in one repondent with yes response to one cup of milk per child factor
will result in the increase of 3.42 units of high level of dropout schools, and
the increase in one respondent with yes response to illiteracy of parents will
result in 0.441 units increase of high level of dropout within primary schools.
This can be illustrate with the use of some authors such as Lloyd and Grant who
said that perceived quality of education and the ability of children to make
progress through the schooling system can affect the priority placed on
schooling within the household. It is also evident that children whose parents
have received some sort of schooling are more likely themselves to attend
school for longer. In particular, a mother's education level often influences
length of access for girls. For example in rural Pakistan, girls whose mothers
have some sort of formal schooling are less likely to drop out from school
(Lloyd, Mete and Grant, 2009). Therefore it is clear that parents' education is
mainly affecting positively the dropout level. While on the other side, some
authors have shown that school feeding programs are contributing towards the
reduction of eradication of dropout.
In regards to one cup of milk per child program, it is shown in
table 8 that having one cup of milk per child of a given school will be
significantly associated with the level of dropout within schools with high
level of dropout[ p=0.000 with degree of freedom=1] and with a coefficient of
correlation equals -3.42. While the illiteracy of parents will statistically
affect the leve of dropout [p=0.627 df=1] with a coefficient of correlation
equals 0.441.
Besides, in the middle level of
dropout schools, one cup of milk per child program will affect it
REFERENCE
1. Action. The International Bank for Reconstruction / World
Bank, Washington DC.
2. Colclough, C., Rose, P. and Tembon, M. (2000). `Gender
Inequalities in Primary Schooling: The Roles of Poverty and Adverse Cultural
Practice.' International Journal of Educational Development, 20: 5-27.
3. Derek Sweetnam (2004) Writing Your Dissertation, 3rd
edition, How to Content, Oxford.
4. Dynarski, M., Gleason, P., Rangarajan, A., & Wood, R.
(1998). Impacts of school restructuring initiatives.
Retrieved March 17, 2005, from http://www.mathinc.com/
publications/redirect_PubsDB.asp?strSite=PDFs/restruct.pdf
5. Elliott , D.S., & Voss, H.L. (1974) . Delinquency an d
dropout . Lexington, MA: Lexington Books.
6. Ensminger , M.E., & Slusarcick, A.L. (1992) . Paths to hig
h school graduation or dropout: a longitudi-nal stud y of a é rst-grad e
cohort. Sociology of Education, 65, 95-113.
7. Ensminger , M.E., Lamkin, R.P., & Jacobson, N. (1996) .
School leaving: A longitudinal perspectiv e
8. Epp, J. R., & Epp, W. (2001). Easy exit: School policies
and student attrition. Journal of Education for Students Placed at
Risk, 6(3), 231-147.
9. Epstein, J. L., & Sheldon, S. B. (2002). Present and
accounted for: Improving student attendance through family and community
involvement. The Journal of Educational Research, 95(5),
308-318.
10. Garry, E. M. (1996, October). Truancy: First step to a
lifetime of problems. Juvenile Justice Bulletin. Washington,
DC: Office of Juvenile Justice and Delinquency Prevention.
11. Grinnell Williams & Margaret JR Williams (1990)
Research Methodology in social work, F.E Peacock Publishers Inc, Itasca,
Illinois.
12. Gullatt, D. E., & Lemoine, D. A. (1997). Assistance
for the school administrator concerned about student truancy.
(ERIC Document Reproduction Service No. ED409653).
13. Gullatt, D. E., & Lemoine, D. A. (1997). Assistance
for the school administrator concerned about student truancy.
(ERIC Document Reproduction Service No. ED409653).
14. Henderson, A. T., & Mapp, K. L. (2002). A new wave of
evidence: The impact of school, family, and community connections on student
achievement [Annual synthesis]. Austin, TX: Southwest Educational
Development Laboratory, National Center for Family & Community Connections
With Schools.
15. Holmes, J. (2003), «Measuring the Determinants of School
Completion in Pakistan: Analysis of Censoring and Selection Bias».
Economics of Education Review 22.
16. Horn, L., (1992). A Profile of Parents of Eighth Graders:
National Education Longitudinal Study of 1988. Statistical Analysis Report.
Washington, DC: National Center for Educational Statistics, Office of Education
Research and Improvement, U.S. Department of Education, July 1992
17. Hunt, F. (2008). `Dropping out from school: A cross-country
review of literature.' CREATE Pathways to Access No 16. Consortium for Research
on Educational Access, Transitions and Equity: University of Sussex.
18. including neighborhood effects. Child Development, 67 , 2400
-2416 .
19. Jordon, C., Orozco, E., & Averett, A. (2002).
Emerging issues in school, family, & community
connections. Austin, TX: Southwest Educational Development
Laboratory, National Center for Family & Community Connection With Schools.
http://www.sedl.org/connections/resources
20. Kakuru D. Muhwezi (2003). Gender Sensitive Educational Policy
and Practice: Uganda Case study. International Bureau of Education
21. Kasente D. (2003). Gender and Education in Uganda: A Case
Study for Monitoring Report. Makerere University.
22. Lee, V. E., & Burkam, D. T. (2003). Dropping out of high
school: The role of school organization and structure. American Educational
Research Journal, 40(2), 353-393.
23. Lloyd, C.B., Mete, C. and Grant, M.J. (2009). `The
implications of changing educational and family circumstances for children's
grade progression in rural Pakistan: 1997-2004.' Economics of Education Review,
28(1): 152-160.
24. Mark L.Bearenson,David M.Levine,1990 Basic Business
statistics,12th edition.
25. Nyanzi L (2002). Gendering Education Policy: The Uganda
Case. Women's Worlds 2002. Conference Paper.
26. Odaga O. and Heneveld W., (1995). Girls and schools in
Sub-Saharan African from Analysis to
27. Railsback, J. (2004). By request ... Increasing student
attendance: Strategies from research and practice. Portland, OR: Northwest
Regional Educational Laboratory. Retrieved March 15, 2005, from
http://www.nwrel.org/request/2004june/
28. Research Council, Committee on Educational Excellence and
Testing Equity Workshop.
29. Reva Berman Brown (2006) doing your dissertation in
business and management the reality of researching and writing, SAGE
Publications Ltd, London.
30. Rumberger W. R., 2001. Who Drops Out of Schooland Why? Paper
prepared for the National
31. Rumberger W. R., 2001. Who Drops Out of Schooland Why? Paper
prepared for the National Research Council, Committee on Educational Excellence
and Testing Equity Workshop. Washington DC.
32. UNESCO. (2010). EFA Global Monitoring Report 2010: Reaching
the Marginalized. Paris: UNESCO Publishing.
33. Wagstaff, M., Combs, L., & Jarvis, B. (2000,
Summer/Fall). Solving high school attendance problems: A case study. The
Journal of At-Risk Issues, 7(1), p. 21-30).
APPENDIX
Questionnaire to be filled by teachers in selected
schools.
I BIRASA Fabrice, am an undergraduate student at University of
Rwanda - Huye campus, School of Economics, Department of Applied Statistics
presently conducted an academic research entitled: «IMPACT OF ONE
CUP OF MILK PER CHILD ON SCHOOL DROPOUT» and am kindly asking you
to complete the attached questionnaire. Your Frank responses will be of a great
help towards this study. This study is purely for academic purpose and the
information provided will be confidentially treated. All questions asked are
completely for the assessment of the real situation. Please be as accurate as
possible to enable this research get valid information. For any additional
support or advice towards the achievement of this work, you are welcome.
Contact: 0787564662/0725114672
Thanks for your anticipated cooperation.
|
Section I : Identification of the
respondent
|
|
N0
|
Question
|
Coding categories
|
|
1
|
What is your gender?
|
1=male
2=female
|
|
2
|
What is your marital status?
|
1=single
2=married
3=Widowed
4=separated
|
|
3
|
What is your level of education?
|
1=primary
2=Secondary and technical school
3=University and above
|
|
4
|
What is your post in this school?
|
1=teacher
2=headmaster
3=secretary
4=Accountant
5=Subcontract
6=other, specify..........
|
|
5
|
How long have you been in education career?
|
1=below one year
2=between 1-3 years
3= between 3-5 years
4= 5 years and above
|
|
Section II: Information related to the causes of primary
school dropout in Huye district and strategies to be taken.
|
|
6
|
Do you use to observe children dropout case within your
school?
|
1=Yes
2=No
|
|
7
|
If yes, at which level is it happening?
|
1=high,
2=middle
3=low
|
|
8
|
If yes to question 6, what are the main causes of the same case
(dropout)?
|
1=child live afar from school
2= child's family poverty
3=repetition or failure of children
5= illiteracy of child's parents
6=child labour
8=others, specify................
|
|
9
|
If yes to question 6, what was the economic status of family of
the dropped out child?
|
3=rich
1=poor
2=slightly poor
|
|
10
|
If not to question 6, have you ever observed it in any other
school?
|
1=yes
2=No
|
|
11
|
What do you think were the main reasons of that dropout?
|
1=child live afar from school
2= child's family poverty
3=repetition or failure of children
4= child labour
5=corporal punishment
6=others, specify...............
|
|
12
|
What are the consequences have you identified faced by dropped
out children?
|
1=criminal involvement
2=premature sexual activity, early pregnancy and marriage
3=ignorance
4=violence, alcohol, drag abduction, and suicide.
5= other, specify.........
|
|
13
|
What are the consequences faced by the school out of which he
dropped?
|
1=decrease in education performance
2=fail to attain the education for all goal.
3= other, specify.......
|
|
14
|
What are the consequences to families from which the dropped out
children come?
|
1=experience the decreased earnings
2=increased cost related to dropping out
3=cost related to the involvement of their children in abnormal
activities
4= other, specify..............
|
|
15
|
What are the consequences to the state in general of children
dropout?
|
1= increase illiteracy level
2= fail to achieve the expected level of education for all
3= increased future cost due to illiteracy.
4= other, specify..........
|
|
16
|
In your suggestion, what are the main strategies that could be
undertaken to avoid the dropout of children in primary schools?
|
1=reinforcement of one cup of milk per child and other related
programs
2=abortion of severe punishment
3=abortion of children repetition
4=building schools nearby neighborhood of children
5= abortion of child labour
6= other, specify......
|
|
Section III: Information related to one cup of milk per
child in primary schools
|
|
17
|
Does this school have the one cup of milk per child program?
|
1=Yes
2=No
|
|
18
|
If yes to question 17, what do you see of
importance with the above mentioned program?
|
1= decrease malnutrition
2=reduce school dropout rate
3=increase school enrolment rate
4= increase pupils performance
5=others, specify.....
|
|
29
|
According to your point of view, can one cup of milk per child
program be taken as one of programs for dropout reduction strategy?
|
1=Yes
2=No
|
|
20
|
In your suggestion, would one cup of milk per child program
increase the primary enrollment rate within your school?
|
1=Yes
2=No
|


