|

PSB PARIS SCHOOL OF BUSINESS
Mémoire
Pour l'obtention du diplôme de
Master of Science
En Data Management
Présenté Par :
SHIN
Woohyun
THÈME
The impact of COVID-19 : To predict the
breaking
point of the disease from Big Data by Neural
Networks
Responsable du Mémoire : OMRANI
Nessrine
- 1 -
Année Scolaire : 2019-2020
- 2 -
Abstract
The weather data generated per second is BigData, which is
difficult to process with computers at home. In particular, supercomputers used
by the National Weather Service are more expensive than clusters that connect
multiple computers in parallel with a single machine. To address these
limitations of a single machine, the cluster environment was built using the
BigData framework Hadoop and Spark. Subsequently, a deep learning prediction
model was created using temperature data to predict the reduction point of
COVID-19. The model is designed to put the maximum temperature of the past
decade at each day at input value, and to predict the 2020 weather, hoping for
an early end to COVID-19. As a result, the predicted reduction point of
COVID-19 was consistent with the actual breaking point.
Keywords : BigData, Hadoop, Spark,
Deep-Learning
Les données météorologiques
générées par seconde sont BigData, qui est difficile
à traiter avec des ordinateurs à la maison. En particulier, les
superordinateurs utilisés par le National Weather Service sont plus
chers que les clusters qui connectent plusieurs ordinateurs en parallèle
avec une seule machine. Pour remédier à ces limitations d'une
seule machine, l'environnement de cluster a été
créé à l'aide du framework BigData Hadoop et Spark. Par la
suite, un modèle de prévision d'apprentissage en profondeur a
été créé en utilisant des données de
température pour prédire le point de réduction de
COVID-19. Le modèle est conçu pour mettre la température
maximale de la dernière décennie à chaque jour à la
valeur d'entrée, et pour prédire la météo 2020, en
espérant une fin précoce de COVID-19. Par conséquent, le
point de réduction prévu de COVID-19 était conforme au
point de rupture réel.
Mots clés : BigData, Hadoop, Spark,
Deep-Learning
- 3 -
Table of Contents
I. INTRODUCTION
II. LITERATURE REVIEW
1. Coronavirus
1.1. SARS and MERS
1.2. Seasonal Virus
1.3. 2019 Novel Coronavirus
2. Weather Prediction Model
2.1. Numerical Weather Prediction (NWP)
2.2. Deep Learning Model
3. Applied Technologies
3.1. Hadoop
3.1.1. HDFS
3.1.2. MapReduce
3.1.3. Yarn
3.2. Spark
3.2.1. Low-Level API
3.2.2. Structured API
3.2.3. Machine Learning on Spark
3.3. Docker
3.3.1. Micro-Service
3.3.2. Image and Container
3.3.3. Networks
3.3.4. Kubernetes
4. Conclusion
III. METHOD AND DATA
1. Development Environment
2. Data
2.1. Daily COVID-19 confirmed cases
2.2. Max Temperature Data
3. EDA, Exploratory data analysis
4. Prediction Modeling
4.1. Data Preprocessing
4.2. Multi-Layer Perceptron
IV. Result
V. Discussion
VI. Conclusion
- 4 -
I. INTRODUCTION
Coronavirus, which began to infect humans through bats, has
appeared in various shapes since 2003. The variety of Coronavirus, which
appeared in SARS in 2003, MERS in 2009 and COVID-19 in 2019, has social and
economic implications as well as human health. In particular, this COVID-19 is
a deadly situation, with the WHO issuing a "Pandemic" proclamation. Since the
first confirmed case of COVID19 appeared in Wuhan, China on December 8, 2019,
data from the World Health Organization (WHO) have shown that more than
2,314,621 confirmed cases have been reported worldwide by April 20, 2020. Among
them, 157,847 people died, with a fatality rate of around 7 percent[19].
Fortunately, in some countries with a well-respected COVID-19 medical system,
the number of confirmed cases remains double-digit every day, and the number of
confirmed cases continues to decline. However, the impact of COVID-19 has led
to a setback in global economic and social infrastructure, and a tentative
recovery period is expected, as is the result of the 2008 global financial
crisis. Economically, the U.S. stock market plunged due to the outbreak of the
new coronavirus infection, resulting in massive unemployment within a week. In
Europe, many countries that share borders from Italy to Spain, France and
Germany were closed by COVID-19. This has slowed the growth rate of many
countries tied to the euro this year.
Contrary to this disastrous reality, individual thinking predicts
that these negative effects will create many new opportunities from a long-term
perspective. Historically, many developments and advances are made by the
limited environment of the times. For example, during World War II, there were
many advances in communication and technology that we are currently using, and
the commercialization of penicillin, among medical technologies, was one of the
inventions that changed the world. We are now incorporating and developing
technologies that existed but were not frequently used to fit with the times.
Among them are remote education and telecommuting, grocery shopping using the
Internet, and ordering food. These technologies existed in the past, but did
not feel the need, and lacked the technology until commercialization. However,
it shows that it is growing and adapting to new environment according to the
current situation. Therefore, through temperature and humidity-based neural
network learning, we will predict when the end of COVID-19 proliferation will
come. Predicting the timing, we try to seize the economic opportunities that a
new social culture brought by COVID-19 will bring.
I conducted a search paper to answer the question of when we
would get freedom from the coronavirus - when would economic recovery begin?
First, I will talk about what is coronavirus ? and how we can
predict the weather. I will also talk about what technology is needed to make
climate predictions. The technology and data will then be used to predict the
climate and find a point in time when the corona virus will decrease.
- 5 -
II. LITERATURE REVIEW
Bill Gates, founder of Microsoft and CEO of the Bill &
Melinda Gates Foundation in 2015, predicted a number of infections and economic
declines through the virus during a TED lecture. The disease will kill more
than 10 million people within a few decades, and the route of infection can be
found anywhere, not just in plane and in markets. The World Bank estimates that
if we have a worldwide flu epidemic, global wealth will go down by over three
trillion dollars and we'd have millions and millions of deaths [1].
1. CORONAVIRUS
Coronavirus (CoV) is a virus that can be infected with humans
and various animals, meaning the RNA virus with a gene size of 27 to 32 kb [8].
There are four types of coronavirus (Alba, Beta, Gamma, Delta), and in the case
of Alpha and Beta, Gamma and Delta can infect humans and animals, meaning that
they can be infected by animals. So far, a total of six types of human-infected
coronavirus have been known. There are types that cause colds (229E, OC43,
NL43,HKU1) and types that can cause severe pneumonia (SARS-CoV, MERS-CoV)
[8].
1.1. SARS and MERS
The emergence of severe acute respiratory syndrome coronavirus 2
(SARS-CoV-2) in China at the end of 2019 is a one of kind of coronavirus from
the bat. Phylogenetic analysis revealed that SARS-CoV-2 is 79% similar to
SARS-CoV, which occurred in China in 2003, and 50% similar to MERS-CoV [4].
1.2. Seasonal Virus
Influenza is commonly known as the "flu" and is an acute
respiratory disease caused by the influenza virus. Influenza is a highly
contagious disease that causes large and small trends around the world every
year, and 10 to 20 percent of the population usually gets infected within two
to three weeks of its onset [9]. The most obvious symptoms are sudden high
fever of 38 to 40 degrees Celsius within 24 hours of infection, with systemic
symptoms such as headaches, muscle aches and fatigue, and respiratory symptoms
such as sore throat, cough, gabbing, and rhinitis. Dynamically, influenza
usually occurs in late fall and early spring when winter begins [10]. In the
case of influenza, mainly worldwide, it is seasonal influenza, with 5-15
percent of the population infected each year.
1.3. 2019 Novel Coronavirus

SARS-CoV-2 is spread by human-to-human transmission via droplets
or direct contact, and infection has been estimated to have mean incubation
period of 6.4 days and basic reproduction number of 2.24~3.58 person [9]. Many
highly infectious diseases, including COVID-19, exhibit seasonal patterns. For
example, for SARS-CoV, MERS-CoV and Influenza, humidity and temperature are
known as factors of virus survival. By mid-February 2020, the majority of
confirmed cases had occurred in cities between 30 and 50 degrees latitude.
These cities also have similar climatic characteristics with an average
temperature of 5 to 11 degrees and humidity of 47 to 79 percent [2].
2. WEATHER PREDICTION MODEL
In January 2020, Google succeeded in developing a model called
Nowcast, which uses artificial intelligence technology to predict weather
conditions such as precipitation. Nowcast will shorten the analysis work, which
used to take hours, by 5-10 minutes and forecast the
3. APPLIED TECHNOLOGIES
3.1. Hadoop
Apache Hadoop is a Java-based open source framework that can
store and process big data. The two large components of Hadoop were created to
better handle large amounts of data through parallel distributed storage(HDFS)
and distributed processing(MapReduce) [11]. Weather sensors that collect data
every hour across the globe collect large amounts of log data, which are joined
to data analysis using MapReduce because they are semi-structured and
record-oriented. Because there are tens of thousands of weather stations, the
entire dataset has a large number of relatively small files. Due to the nature
of Hadoop, a small number of large files are easy to process and efficient
[5].

- 6 -
weather up to six hours later. Google researchers compared the
new weather forecast model to the existing one based on past weather data from
2017 to 2019. The results showed that new and existing models showed similar
levels of performance in terms of accuracy [3].
2.1. Numerical Weather Prediction (NWP)
Synoptic weather predictions (computer models based on physical
equations) that predict weather from a minimum number of days to a maximum of
two weeks have been developed by the Numerical Weather Prediction. These models
remain the backbone of all weather forecasts. However, this approach has a
critical limitation that will take a considerable amount of time to process the
data [12].
2.2. Deep Learning Model
To define deep learning, a neural network must be defined first.
Neural network is a graph of nodes with weights and activation functions. Nodes
are stacked up one by one and consist of a layer. On the network, each layer is
partially or completely associated with the previous layer. These simple
functions can be learned to better recognize increasingly complex input signals
as layers are added one by one. The ultimate goal of this learning is to
properly adjust the connection between each node on the network, its weight,
and the value of each node so that it can be associated with a specific value
when a value is entered. Deep learning forms a variety of architectures and
builds up these layers countless times. Neural networks themselves are
algorithms that were created decades ago. However, attention has been focused
on various machine learning algorithms and has declined. However, the recent
use of large datasets (BigData), the development of powerful hardware (Cluster
and GPUs), and the advent of new learning algorithms have enabled us to learn a
large neural network that goes far beyond the performance of many traditional
machine learning methods.
For typical machine learning techniques, the limitations of
computational performance did not allow good results as data grew. However,
deep learning is advantageous as data and information grows, and rather
requires much larger datasets than conventional machine learning algorithms.
Deep Neural Network (DNN) has now become the standard for computer vision,
voice processing and some natural language processing operations, providing
better learning performance compared to models learned by existing users
manually adjusting parameters, and has been actively introduced in other areas
of machine learning.
The DNN model is very effective when a lot of data needs to be
processed and nonlinear, such as weather forecasting problems. According to the
papers on various DNN algorithm models, MPL models are used the most and are
considered to have high accuracy[13].
- 7 -
The difference between Hadoop and the traditional Relational
Database Management System (RDBMS) is that Hadoop can store structured,
semi-formal, unstructured and all-format data, but RDBMS can only store
structured data. In terms of speed, RDBMS also adopts the Schema On Write
function, which has the disadvantage of being very slow when data is recorded.
On the other hand, Hadoop adopts the Schema On Read function, which has the
advantage of being very fast when data is written. Hadoop also has the
advantage of being able to form a cluster using common hardware rather than
specific equipment, because it uses clusters by connecting equipment in
parallel. These advantages can be highly useful in economic terms. Because the
cost of upgrading a computer's memory or hard disk is exponentially increased
compared to the performance of the component. However, many companies are now
adopting the technology because parallel architectures can translate computer
performance improvements into an arithmetic growth. Hadoop also has an
advantage in terms of network efficiency because it has a philosophy of sending
light code to where data exists and processing it.
3.1.1. HDFS
Hadoop works with two important concepts. One of them, HDFS, is
an expanded, reliable, distributed file storage system created by Java, and
files are stored in block units and operate in a master-worker structure. Block
size is the maximum amount of data that can be read and written at a time.
There are some benefits of introducing the concept of block abstraction into a
distributed file system. The first benefit is that a single file can be larger
than the capacity of a single disk. Multiple blocks that make up a single file
need not be stored only on the same disk, so they can be stored on any disk in
the cluster. The second benefit is that abstracting into blocks rather than
file units can simplify Storage's subsystem. Furthermore, blocks are highly
suitable for implementing the necessary replication to provide fault tolerance
and availability. To cope with block damage and disk and machine failures, each
block replicates data to a number of physically separated machines. If one
block becomes unavailable, the client can be informed to read the copy on the
other machine. In the Hadoop 2 version, the block size is 128 Mbyte by default,
and you can adjust the cluster's block size in the hdfs-site.xml file. You can
also set the number of replications in the hdfs-site.xml file.
An HDFS cluster operates on two types of nodes operating in a
master-worker pattern. It consists of one Namenode, the master, and several
Datanodes, the walker. The Namenode manages the namespace of the file system.
The Namenode maintains metadata about the file system tree and all of the files
and directories contained in it. This information is stored permanently on the
local disk as two types of files, FSimage and Editlog. It also identifies which
Datanodes all the blocks in the file are on. The DataNode is a real worker in
the file system. A Datanode stores and navigates blocks at the request of a
client or a Namenode, and periodically reports a list of blocks it is storing
to the Namenode. In addition, the Datanode sends the disk-available spatial
data, data movement, and load carrying capacity to the Namenode every three
seconds through `heart beat'. Therefore, NameNode constructs metadata based on
that information.
3.1.2. MapReduce
MapReduce is a programming model for data processing. It is also
an action program for Hadoop clusters written in Java. To take advantage of the
parallel processing offered by Hadoop, we need to re-express client's
requirements in MapReduce Job. MapReduce operations are largely divided into
Map and Reduce phases, helping to process data faster
- 8 -
through a simple step called Shuffling between Map and Reduce.
Each step has a pair of key-value as input and output, and the type is chosen
by the programmer. The MapReduce program follows a series of development
procedures. First, write a unit test to implement the Map and Reduce functions
and verify that they work well. Next, write a driver program that runs the Job,
and run it on Integrated Development Environment (IDE) using part of the
dataset to verify that it works properly. The Map process converts the entered
data into a value of one pair of key-value values for each record (row).
Afterwards, several values are put into one list based on the common key value
through the process called Shuffling. Finally, the data organized by key-list
is returned through the Reduce step. For example, if a meteorological station
between 1950 and 1959 wants to write a programming that wants to know the
highest temperature each year, it first maps the conversion of daily weather
data records to a single key-value value. This results in a total of 3650 (365
days * 10 years) records, such as (1950, 0), (1950, 2) and ... Shuffling then
proceeds to reduce the role of reducing to one list as of each year
(1950,[0,2,...], (1951, [2,6,...], ...), ... (1959, [3,8,..., 32]).
Subsequently, if an algorithm is created and executed to find the maximum value
of each record through the Reduce process, results such as (1950,43),
(1951,46),... (1959,32) can be obtained.
Hadoop provides the MapReduce API, which allows you to write Map
and Reduce functions in other languages besides Java. Hadoop Streaming uses
UNIX standard streams as an interface between Hadoop and user programs. Thus,
users can write the MapReduce program using various languages, such as Python
and Ruby, which can read standard inputs and write them as standard outputs.
3.1.3. Yarn
Apache Yarn (Yet Another Resource Navigator) is Hadoop's cluster
resource management system. Yarn was first introduced in Hadoop version 2 to
enhance MapReduce's performance. Today, however, various distributed computing
frameworks such as Spark and Tez are used to manage resources within a cluster.
Yarn provides key services through two types of long-running daemon:
ResourceManager and NodeManager. The only ResourceManager in the cluster
manages the usage of the entire resources of the cluster and the NodeManager,
which runs on all machines, is responsible for running and monitoring the
Container. The client connects to the ResourceManager to run the application on
Yarn and requests the operation of the Application Master process. For example,
a spark job request was received while one Hadoop MapReduce job was running on
100 servers. If you don't have Yarn, you can configure a separate cluster on 50
servers for MapReduce and a spark cluster on the remaining 50. In this case, if
Hadoop's MapReduce finishes earlier than Spark's, it can be a waste of
resources because 50 servers do nothing. As a result, Yarn can minimize server
resource waste by allowing tasks working on different distributed computing
platforms to be managed by a single resource administrator. This is the purpose
of creating Yarn and is its greatest advantage.
3.2. Spark
Spark is an integrated computer engine that houses libraries that
process data in parallel in a cluster environment. Spark has the philosophy of
'Providing the Integrated Platform for Developing BigData Applications'. From
simple data reads to SparkSQL, Spark MLlib, and Spark Streaming, data analysis
is designed to be performed with the same computation engine and consistent
APIs. Spark does not store data internally for a long time and does not prefer
specific storage systems. Therefore, it is designed to focus on processing
regardless of where the data is stored. The fundamental background of Spark's
emergence is due to
- 9 -
changes in the economic factors underlying Computer Application
and Hardware. Historically, computers have accelerated year by year thanks to
improved processor performance. Unfortunately, the performance improvement of
hardware stopped around 2005 due to physical heat dissipation. This phenomenon
requires parallel processing to improve the performance of applications,
resulting in distributed computer platforms such as Spark and Hadoop. [6].
A computer cluster brings together resources from multiple
computers so that they can be used as a single computer. However, configuring a
cluster is not enough and requires a framework to coordinate operations in the
cluster. Spark is the framework that does that. The Spark Application consists
of a Driver process and a number of Executor processes. The Driver process runs
on one of the cluster nodes and is essential because it performs maintenance of
application information, response to user programs or inputs, analysis,
distribution, and scheduling roles associated with the work of the overall
Executor process. The Driver process is a heart-like existence that keeps all
relevant information in memory throughout the life cycle of the application.
The Executor, on the other hand, performs the tasks that the Driver process
assigns. That is, it performs two roles: executing code assigned by the driver
and reporting progress back to the Driver node. Spark splits data into chunk
units called partitions so that all executors can work in parallel. For
example, if there's only one Partition, even if there are thousands of
Executors in the Spark, parallelism is one. In addition, even with hundreds of
partitions, parallelism is one if there is only one Executor.
3.2.1. Low-Level API
Spark consists of a base element Low-level API, a Structured API,
and a set of standard libraries that provide additional functionality. In most
situations after Spark version 2, it is recommended to use the Structured API
and access to RDD will be lost after version 3. However, it is important
because RDD, the smallest units that run Spark, and distributed shared
variables, are in the Low-Level API. With the Low-Level API, there is a unique
concept of Spark called Resilient Distributed Dataset (RDD) for distributed
data processing. Simply put, a collection of partitioned records that are
immutable and can be processed in parallel. It is also mostly used to create a
physical execution plan optimized in the Dataframe API.
There are two types of distributed shared variables: Broadcast
Variable and Accumulator. The reason for the two shared variables is not to run
applications on a single machine, but to do the same thing on a cluster
containing multiple machines, you need to share certain values. Therefore,
these variables are used to act as the exchange of certain values. Broadcast
Variable is an immutable sharing variable that caches all equipment within a
cluster. This method is very efficient, especially when large variables such as
machine learning models must be used several times, so machine learning
algorithms that operate in most sparks include Broadcast Variable as a
necessity. Accumulator is used to update various values within Transformation.
And it can deliver values from Executors to Driver in an efficient way while
ensuring fault tolerance. Similar to Broadcast Variable, the accumulator is
frequently used when working on a deep learning model to deliver a
hyperparameter to the driver, updating the value several times, and finding a
better model.
3.2.2. Structured API
While each record in Dataframe, one of the structural APIs, is a
structured row consisting of fields that know the schema, RDD's record is
simply an object in the programming language chosen by the programmer. On the
other hand, the structured API consists of
- 10 -
Dataset, Dataframe, and SQL, and aims to handle big data using
the API. Structured APIs are recommended because RDDs are not available in the
Spark version 3 booth, which will be released in 2021.
Structured APIs are basic abstraction concepts that define data
flows. The API's execution process consists of four steps. First, write code
using Dataset, Dataframe, SQL first. For the second normal code, the Spark
engine converts to a logical execution plan. Converts a third logical execution
plan to a physical execution plan and verifies that further optimization is
possible in the process. Physical execution plan during the process means
converting query defined by structured API into RDD. Finally, send the plan to
the Spark Driver to execute the physical execution plan within the cluster. The
spark then returns the processing results to the user.
3.2.3. Machine Learning on Spark (MLlib)
MLlib offers data collection, refining, feature extraction and
selection, learning and tuning of map and non-map learning machine learning
models for large data, and an interface that helps these models to be used in
the operating environment. MLlib is often compared with Scikit-Learn and
TensorFlow. From a broad perspective, MLlib can be thought of as carrying out
Scikit-Learn or similar tasks provided by Python. The tools mentioned above are
tools that can perform machine learning on a single machine basis. However,
because the package operates in a cluster environment, it has complementary
relationships. MLlib has several basic 'structural' types, such as transformer,
estimators, evaluators and pipelines.
3.2.3.1.Transformer
The transformer is a function that converts raw data in various
ways. This could be creating a new interaction variable, normalizing a column,
or changing an Integer type to a Double type in order to enter the model.
3.2.3.2.Estimator
The estimator has two meanings. First, it means a kind of
transducer that initializes the data. For example, to normalize numeric data,
the transformation is initialized using the current value information in the
column you want to normalize. Second, the algorithms used by users to learn the
model from the data are also called estimators.
3.2.3.3.Evaluator
It allows us to see how the performance of a given model works
according to one
criterion, like the Receiver Operating Characters (ROC) curve.
After selecting the best model among the models tested using the Evaluator, the
final prediction can be made using that model.
3.2.3.4.External libraries
Sparks can run various projects using external libraries as well
as embedded packages. Among them, a variety of external deep learning libraries
can be used, especially in the new field, such as TensorFrame, BigDL,
TensorFlowOnSpark, DeepLearning4J, and Elephas. There are two ways to develop a
new deep learning model. One is to use a spark cluster to parallelize learning
on a single model in multiple servings and update the final results through
communication between each server. The other is how to use a specific library
to learn various model objects in parallel and to review various model
architectures and hyperparameters to efficiently select and optimize the final
model.
- 11 -
|
Library
|
Framework based on DL
|
Case of application
|
|
TensorFrame
|
Tensorflow
|
Inference, Transfer learning
|
|
BigDL
|
BigDL
|
Distributed learning, Inference
|
|
TensorFlowOnSpark
|
Tensorflow
|
Distributed learning
|
|
DeepLearning4J
|
DeepLearning4J
|
Inference, Transfer learning, Distributed learning
|
|
Elephas
|
Keras
|
Distributed learning
|
[Table 1] Deep Learning External Libraries
Elephas is a library designed to run the Keras Deep Learning
Framework in Spark. Keras maintains simplicity and high usability to support
distributed models that can be run on large datasets. Using Spark's RDD and
Dataframe, it is implemented on Keras as a class of data parallel algorithms,
initialized from the Driver of the Spark, then serialized the data and passed
to the Executor, and the parameters needed for the Model are passed from the
Executor using the distributed shared variables Broadcast Variable and
Accumulator of the Spark. Subsequently, the learned data and hyperparameters
are passed back to the Driver. These values are synced updater by Optimizer in
the Master of Node and continue learning.
3.3. Docker
Docker is an open-source project that makes it easier to use
applications as containers by adding multiple features of Linux containers.
Docker is written in Go language. Unlike virtual machines, which are
traditional methods of virtualization, Docker containers have little
performance loss, drawing attention from many developers in next-generation
cloud infrastructure solutions. There are many projects related to Docker,
including Docker Compose, Private Registry, Docker Machine, Kitemetic, and so
on, but typically Docker refers to the Docker Engine. The Docker Engine is the
main project of the Docker that creates and manages containers and provides a
variety of functions and controls the containers on its own [7].
Traditional virtualization technology used Hypervisor to create
and use multiple operating systems on a single host. These operating systems
are identified as virtual machines, and each virtual machine has Ubuntu,
CentOS, and so on. Operating systems created and managed by Hypervisor use
independent space and system resources that are completely different from each
guest operating system. Typical virtualization tools for this approach include
VirtualBox, VMware, and others. However, virtualizing machines and creating
independent space is a must-have hypervisor, resulting in performance loss
compared to normal hosts. So while virtual machines have the advantage of
creating a complete operating system, they have the potential to lose
performance compared to typical hosts, and it's hard to deploy gigabytes of
virtual machine images to applications.
In comparison, the Docker container has little performance loss
because it creates a process-level isolation environment by using Linux's own
features, chroot, namespace and cgroups, to create virtualized space. Because
the necessary kernel for the container shares and uses the kernel on the host,
and there are only libraries and executable files in the container that are
needed to run the application, the image capacity is also significantly reduced
when the container is imaged. This is faster than virtual machines and has the
advantage of having little performance loss when using virtualized space.
- 12 -
3.3.1. Micro-Service
The way in which multiple modules in the software operate the
logic they interact with within a program is called the Monolith application.
While this approach may be appropriate for smaller services, the disadvantage
is that the more complex and larger the function of the service, the less
scalable and flexible the software itself is. To replace this Monolith
approach, the latest emerging concept is the Micro-Service architecture. The
Micro-Service structure has the advantage of being able to respond quickly to
changes without being dependent on language, and making it easier to manage
each module. Docker is the most commonly used virtualization technology in the
Micro-Service architecture because containers can be created and started in
seconds and provide multiple modules with an independent environment at the
same time. The development of the BigData platform is the task of turning a
large number of nodes into a single cluster. Managing and maintaining these
clusters collectively requires skills to respond quickly to changes. This
advantage of Docker is essential for the development of the BigData
platform.
3.3.2. Image and Container
The basic units used in the Docker Engine are images and
containers, both of which are key to the Docker Engine. Image is a necessary
element for container creation and a concept similar to the iso file used to
create virtual machines. The image exists as a binary file with multiple tiers
and is used as read-only when creating and running containers. Basic Linux
operating systems such as Ubuntu and CentOS, which can be the basis for
applications, can be used through the Docker website called the Docker Hub.
When creating a Container with these images, the image creates a separate space
for the file system containing files that fit the purpose and for the isolated
system resources and network, which is the Docker Container. The Container uses
the image as read-only but stores only the changes in the image in the
Container layer, so whatever the Container does, the original image is not
affected. In addition, each created container is provided with a separate file
system and is separated from the Host, so if an application is installed and
deleted from a particular container, the other container does not change.
3.3.3. Networks
To run a single application on a Docker Engine installed on
several physical servers, the Docker containers need to communicate with each
other. Basically, on one server, the Docker Engine assigns sequentially the
internal IP of the container, which can be changed each time the container is
restarted. This internal IP is a host with Docker installed, that is, an IP
that can only be written to the internal network, so it needs to be connected
to the outside world. Typical network drivers provided by the Docker Engine on
their own include bridge, host, none, controller, overlay, and MacVLAN. Among
them, MacVLAN virtualizes Host's network interface cards, providing the same
physical network environment for containers. Therefore, with MacVLAN,
containers have virtual MAC Addresses over the physical network, enabling
communication with other devices connected to that network. Multiple servers
are connected to network equipment such as one router, and each server and
container is dynamically allocated IP in one network band, such as
192.168.0.0/24, enabling containers using MacVLAN to communicate with each
other.
3.3.4. Kubernetes
Kubernets is an open source-based management system that provides
automatic distribution and scaling of containerized applications. It was
designed by Google in 2014 and is now managed by the Linux Foundation. The
purpose is to provide a platform for automating the deployment, scaling, and
operation of application containers between hosts in
- 13 -
multiple clusters. Kubernets manages the belly's resources in a
form called an 'object'. Objects can serve a variety of roles by grouping a
kind of container, a set of basic containers called Pods, and even the
controller Replica Set, which manages the set of containers, and even the
Service Account and Node, can be used as one object. The role of the Kubernets
Node is largely divided into master and worker. Master is responsible for
managing the cluster so that Kubernets can function properly, and Worker is
created an application container. Master Node is responsible for all services
for deploying applications by running API Server, Controller Manager,
Scheduler, DNS Server, etc.
4. CONCLUSION
Research so far shows that the new coronavirus is affected by
temperature and humidity factors. Also, in common sense, cities with similar
latitudes have similar climates. In 'Temperature and Latitude Analysis to
Predict Potential Spread and Seasonality for COVID19', the COVID-19 virus
assumed that the transmission of the virus would be active in large cities with
an average temperature of 5 to 11 degrees per day and humidity of 47 to 79
percent [2]. Therefore, the hypothesis will be verified using actual climate
data. We will then implement a model that predicts the date on which COVID-19's
spread rate decreases. In order to verify these tests, we will make a deep
learning model that uses historical weather data to predict this year's
weather. For weather forecasting models using deep learning through `Weather
forecasting model using artificial neural network' [13], the deep learning
model will be constructed by adopting the hypothesis that the model predicted
using five hidden-layer using 10 historical data as input value is the most
accurate. For weather data, Hadoop, Spark clustering will be configured using
multiple Raspberry Pi to efficiently store and process big data and
semi-structured data. Afterwards, a climate prediction model based on the Keras
Deep Learning model will be implemented using the Elephas external library
[20].
III. METHOD AND DATA
In cities with similar latitudes, the climate tends to be
similar. Therefore, Madrid, Tehran, Seoul and San Francisco, four major cities
with latitude between 37 and 40 degrees, were chosen first. Since then, the
time series of confirmed cases in the city and daily maximum temperature data
observed at observatories in the city from January 1, 1950 to December 31, 2019
have been obtained. San Francisco had a population of about 880,000 and the
other three cities had a population of more than 6 million. It was assumed that
the transmission speed of COVID-19 would decrease after that date when the
maximum temperature of the city was maintained at 16 degrees Celsius or higher
for more than 12 days of the two weeks. Because generally the incubation period
for COVID-19 is two weeks. Therefore, we decided to observe the temperature
change for two weeks. However, there are additional conditions to maintain a
certain temperature for more than 12 out of 14 days, because abnormal weather
conditions may exist during the two weeks observed.
1. DEVELOPMENT ENVIRONMENT
For climate data, a framework to handle BigData is needed because
much of the data at the meteorological station is organized in semi-format
format. Therefore, instead of using the BigData service already available
online, the company decided to create and use the environment personally.
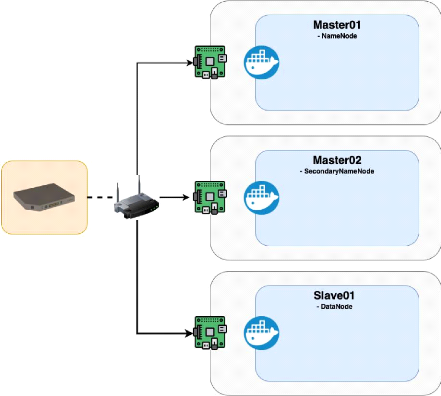
Hadoop connects several equipment in a parallel structure to create a single
clustering[Figure 2]. Spark is a framework that uses BigData data stored in
Hadoop Filesystem (hdfs) to help preprocess and deep learning analysis within
the cluster
- 14 -
environment. The clustering are all managed by a node manager
named YARN. Docker was used to easily install and deploy Hadoop and Spark on
several physical machines. Zeppelin is an Integrated Development Environment
that can be used in Spark, which helps you conduct analysis in the Web
interface [Figure 1]. Finally, Elephas, the external package of Spark
Deep-Learning, was installed in the cluster and weather prediction modeling was
conducted
through deep learning.
|
Raspberry Pi 4
|
Arm 64 bits
|
|
Ubuntu
|
18.04 LTS
|
|
Hadoop
|
2.7.7.
|
|
Spark
|
2.4.0
|
|
Zeppelin
|
0.8.2
|
|
Python
|
3.6.9
|
[Table 2] Development Environment Version
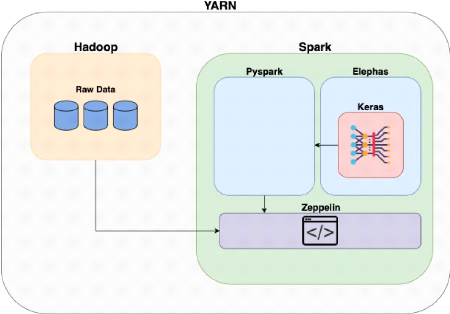
[Figure 1] Logical Architecture
- 15 -
[Figure 2] Physical Architecture
2. DATA
2.1. Daily COVID-19 confirmed cases
Prior to the weather forecasting model, we identified the
frequency distribution of the number of confirmed cases by date in the ongoing
COVID-19. First, we collected COVID19 datasets from Wikipedia[17] and the Johns
Hopkins Coronavirus Resource Center[16]. Afterwards, visualizations were
carried out by organizing the dataset by date. In Iran, subsequent data were
not available because the number of confirmed cases was not counted by cities
since March 26, but only the total number of confirmed cases was announced. The
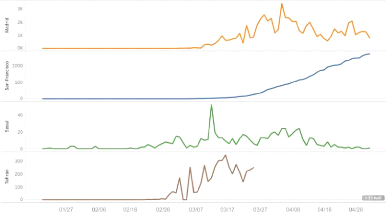
graph below is a graph of new confirmed numbers that occurred every day, and
the graph shows the change in the number of confirmed cases in four cities. It
was also possible to specify the day at which the number of confirmed cases was
increased.
- 16 -
[Figure 3] Confirmed case Trend at each date
In Seoul, the number of confirmed cases has been on the decline
since March 10, when the number of confirmed cases reached 52. Madrid has seen
a decline since 3,419 confirmed cases on March 30. Tehran has seen a downward
trend since peaking 347 confirmed cases on March 14. San-Francisco, a steady
increase in the number of confirmed cases has been seen since early March
[Figure 3].
2.2. Max Temperature Data
I wanted to use average temperature data and average humidity
data per day, but there were not many weather stations since 1950 and the
amount of data was limited. It was also assumed that human-to-human infection
of the COVID-19 virus is unlikely to occur because the minimum temperature is
generally recorded at night and there is a small floating population at dawn,
although daily minimum temperature data were available. For this reason, the
study was conducted using daytime maximum temperature data with a large
floating population instead of average temperature data and humidity data
[18].
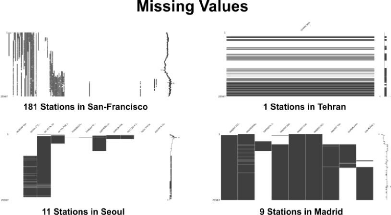
3. EDA, Exploratory data analysis
For the meteorological data, problems with the observation
machine or environmental problems result in many missing values[Figure 4].
Thus, the missing values are replaced by the MissForest algorithm, an algorithm
that estimates and replaces missing values, using the Random Forest model of
machine learning, among the imputation techniques. The algorithm is a
nonparametric method that uses correlations between variables to correct
missing values and can be applied to mixed and high-dimension data and does not
make distribution assumptions about the data [15].
- 17 -
[Figure 5] Visualization of Missing Values
In the case of Seoul, San Francisco and Madrid, missing values
were replaced based on Miss Forest because there were several stations, and in
the case of Tehran, missing values were interpolated based on the time series
date index because only one observatory existed.
4. PREDICTION MODELING
The data used daily maximum temperature data from 1950 to 2019,
and the prediction model was implemented using the Multi-Layer Perceptron (MLP)
provided by Keras. Because of the large number of rows of data, the data was
processed and analyzed using the BigData Analysis Framework Spark.
4.1. Data Preprocessing
For most Deep Learning models, train the model after converting
the input data value to - 1 to 1 or 0 to 1[14]. After model learning and
accuracy verification, put the converted input value for prediction and then
return the output value to its original value. The values of all Max
Temperatures were converted to 0 to 1 using the MinMaxScaler of Scikit Learn,
and then returned to Fahrenheit, the unit of actual data, using the values of
Max Value and Min Value that were stored, and then converted to Celsius units.
Because one out of four years has leap year, I drop the rows which recorded in
29th February. Then all data are divided with 70%
of Training datasets, 30% of Validation datasets and one dataset which contains
the max temperature between 2010 and 2019 for predicting 2020 through well-made
trained model.
4.2. Multi-Layer Perceptron
Since I have 10 inputs, a 5 hidden-layer network with 16 neurons
per layer. For the first to fourth hidden-layer of the five hidden-layer, the
function tan-sigmoid (tanh) is used as an activation function and the last
hidden-layer that returns 1 output data is based on linear activation
function[13]. On the basis of MSE( Mean Square Error), minimization criteria, I
adjust the weights and biases of the neurons on each step that makes reduce MSE
value. After a number of iterations (epochs) , the neural network is trained
and the weights are saved.
- 18 -
Finally I was able to get 4 trained models at each cities,
Madrid, Seoul, San-Francisco, Tehran.
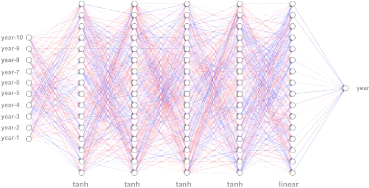
[Figure 6] Diagrams of Multi-Layer Perceptron
IV. RESULT
The following results will demonstrate that the diffusion rate of
COVID-19 will decrease if the temperature is maintained above 16 degrees for
more than 12 days of 14 days. The process for reaching the results is as
follows :
i) Create a `spark_base' container using the ubuntu image file
of the docker and
install Hadoop and Spark from that container.
Subsequently, the corresponding image file is stored in the Docker Hub
repository.
ii) Set up MacVLAN on each Raspberry Pi to communicate between
the three
Raspberry Pis.
iii) Download the `spark_base' image file on the Docker Hub from
all servers and
proceed to the Namenode, Secondary Namenode, Datanode, and
ResourceManager and NodeManager settings for Hadoop in accordance with the role
of each corresponding node. The spark-related settings are also carried out.
iv) Install Zeppeline and Elephas, external libraries of deep
learning, for analysis
environment in Container, which acts as Namenode.
Then, proceed with clustering to connect all nodes together.
v) After the weather data set is interpolated through python,
the data is imported to
the spark for MLP processing. During this process,
the data is divided into train and test to evaluate and improve the model.
vi) After model Deep-Learning using PySpark and Elephas, the
results are obtained
by adding the temperature of the last 10 years to the
model in order to obtain the expected data for 2020.
- 19 -
vii) Create a function using condition statements according to
the above hypothesis
and complete a model that predicts the date of the decrease using
the estimated temperature data for each day this year. Results will come in the
same format as 2020-04-10, and it can be seen that the number of confirmed
cases in the city will begin to decline after 10 April 2020.
|
Madrid
|
2020-04-10
|
San-Francisco
|
2020-02-07
|
|
Tehran
|
2020-03-14
|
Seoul
|
2020-04-10
|
[Table 3] Predicted Breaking Point of COVID-19
|
Madrid
|
2020-03-30
|
San-Francisco
|
?
|
|
Tehran
|
2020-03-14
|
Seoul
|
2020-03-10
|
[Table 4] Real Breaking Point of COVID-19
Two of the actual four cities, Tehran and Madrid, were able to
reach conclusions similar to the actual results[Table3][Table4]. It started to
decline after recording the largest number of confirmed cases on March 14 and
March 30, respectively. But it showed the exact opposite of what Seoul and
San-Francisco had expected. San-Francisco in the United States has seen a sharp
increase in the number of confirmed cases since March, starting with New York,
but the expected start date of the decline was expected to be Feb. 7. Seoul,
South Korea, was also expected to see a decrease after April 10, but with a
quick initial response, the number of confirmed cases has remained low since
March 10.
V. DISCUSSION
The research paper was conducted on COVID-19, the most necessary
analysis in the international economy and health sector as of 2020. Indeed,
since April 2020, the new Confirmed Cases of COVID-19 have been decreasing in
many countries, and economic indicators such as the U.S. Stock Exchange can
also confirm that they are recovering from the worst times in late March to
early April. However, there is a new discovery of the COVID-19 virus of various
types on different continents, and there is a study that if temperatures and
humidity change back to a viral environment in winter 2020, there may be a risk
of being attacked again. The ultimate solution to this problem is the
development of vaccines for the virus. As we saw from the results, we could see
that the radio waves of Coronavirus were somewhat affected by temperature.
However, as in the case of Seoul and San-Francisco, we could see that the
difference in the number of confirmed cases under each country's health system
affects more than the effects of climate. Thus, the study of the infectious
nature of coronavirus showed that it could be affected by a variety of external
variables as well as the simple climate and became an opportunity to be alert
to the dangers of viruses.
For the quick optimization of weather forecast deep learning
models, models that have already been the best results in other studies have
been actually taken and used[13]. 16 neurons and 5 hidden layers were used for
each layer. Four of them adopted the function 'tangent sigmoid' as an
activation function. In this study, the Mean Square Error (MSE),
- 20 -
which measured the accuracy of the model, obtained the accuracy
of the model with a very stable result of 2.0, but in my study, MSE showed an
overfit of the predictive model with a value of less than 1. The reason for
this phenomenon was that the number of samples in the previous study was not so
high at 730, and the previous study also showed that the MSE dropped from 2.71
to 0.211 when the number of samples increased from 730 to 1,460 was increased.
Therefore, if deep-learning modeling is carried out using BigData, it can be
found that overflowing occurs severely.
A general BigData analysis does not mean a large number of rows,
but a large number of columns. In this search, it is not a true BigData
analysis because it was analyzed using only one variable called daily max
temperature. However, physical systems that were implemented using dockers and
Raspberry Pi to handle BigData, and logical systems that were implemented using
Hadoop and spark, will be required to analyze the BigData of better quality of
the upcoming paper.
VI. CONCLUSION
'When will the transmission of COVID-19 begin to decrease? We
also conducted a search paper to predict the date on when the economic recovery
will begin? The study found that the virus had seasonal characteristics, but
other external factors also played an important role through the results of
four cases. We also found that climate forecasting models using Deep-Learning,
unlike conventional numerical-based weather forecasting models, can complete
hours of work in minutes. Such accelerated weather forecasting models could be
used to minimize casualties and asset damage by applying them to areas that
need to be responded in real time, such as natural disasters. A
high-performance computer is essential in areas that handle a lot of data, such
as weather, and have a lot of computations. In addition, data should be
collected and processed in real time for these natural forecasting areas.
However, weather forecasting using one existing supercomputer can be costly. I
think the distributed computing system sector and the cloud sector are the
right technologies to solve these problems. This is because the universality,
one of the characteristics of distributed computing systems, can turn multiple
computers into high-performance systems for a single application operation.
Thus, it can play a role in dramatically reducing the cost of producing the
same result.
References
[1] Ted, The next outbreak? We're not ready [Website]. (2015,
Avril 3). Retrieved from
https://www.ted.com/talks/bill_gates_the_next_outbreak_we_re_not_ready
[2] Sajadi, M. M., Habibzadeh, P., Vintzileos, A., Shokouhi, S.,
Miralles-Wilhelm, F., & Amoroso, A. (2020). Temperature and Latitude
Analysis to Predict Potential Spread and Seasonality for COVID-19.
Available at SSRN 3550308.
[3] Using Machine Learning to «Nowcast» Precipitation
in High Resolution, Google AI Blog [Website]. (2020, January 13). Retrieved
from
https://ai.googleblog.com/2020/01/using-machine-learning-to.nowcast.html
[4] Lai, C. C., Shih, T. P., Ko, W. C., Tang, H. J., &
Hsueh, P. R. (2020). Severe acute respiratory syndrome coronavirus 2
(SARS-CoV-2) and corona virus disease-2019 (COVID-19): the epidemic and the
challenges. International journal of antimicrobial agents, 105924.
[5] Tom White. (2015). Hadoop: The Definitive Guide. California:
O'Reilly Media.
[6]
- 21 -
Matei Zaharia. (2018). Spark: The Definitive Guide: Big Data
Processing Made Simple. California: O'Reilly Media.
[7] YONG ChanHo. (2020). Start! : Docker/Kubernetes. Paju:
Wikibook
[8] Richman DD, Whitley RJ, Hayden FG. Clinical Virology, 4th
ed. Washington: ASM Press; 2016.
[9] Turner, D., Wailoo, A., Nicholson, K., Cooper, N., Sutton,
A., & Abrams, K. (2003). Systematic review and economic decision modelling
for the prevention and treatment of influenza A and B. In NIHR Health
Technology Assessment programme: Executive Summaries. NIHR Journals
Library.
[10] Centers for Disease Control and Prevention (CDC). (2015).
Epidemiology and Prevention of Vaccine Preventable Diseases, 13th Edition. La
Vergne: ingram.
[11] Karun, A. K., & Chitharanjan, K. (2013, April). A
review on hadoop--HDFS infrastructure extensions. In 2013 IEEE conference
on information & communication technologies (pp. 132-137). IEEE.
[12] Scher, S., & Messori, G. (2019). Weather and climate
forecasting with neural networks: using general circulation models (GCMs) with
different complexity as a study
ground. Geoscientific Model Development,
12(7), 2797-2809.
[13] Abhishek, K., Singh, M. P., Ghosh, S., & Anand, A.
(2012). Weather forecasting model using artificial neural network. Procedia
Technology, 4, 311-318.
[14] Sebastian Raschka and Vahid Mirjalili. (2017). Python
Machine Learning - Second Edition: Machine Learning and Deep Learning with
Python, scikit-learn, and TensorFlow. Birmingham: Packt.
[15] Stekhoven, D. J., & Bühlmann, P. (2012).
MissForest--non-parametric missing value imputation for mixed-type data.
Bioinformatics, 28(1), 112-118.
[16] COVID-19 Data Repository by the Center for Systems Science
and Engineering (CSSE) at Johns Hopkins University [Website]. (2019). Retrieved
from
https://github.com/CSSEGISandData/COVID-19.
[17] COVID-19 pandemic in the United Sates [Website]. (2020).
Retrieved from
https://en.wikipedia.org/wiki/2020_coronavirus_pandemic_in_the_United_States.
[18] National Centers For Environmental Information: Climate
Data Online [Website]. Retrieved from
https://www.ncdc.noaa.gov/cdo-web/
[19] World Health Organization: Coronavirus disease (COVID-2019)
situation reports [Website]. Retrieved from
https://www.who.int/emergencies/diseases/novel-coronavirus-2019/situation-reports.
[20] Elephas: Distributed Deep Learning with Keras & Spark
[Website]. Retrieved from
https://github.com/maxpumperla/elephas.
|