The impact of covid-19: to predict the breaking point of the disease from big data by neural networkspar Woohyun SHIN Paris School of Business - MSc Data Management 2001 Dans la categorie: Informatique et Télécommunications > Intelligence artificielle |
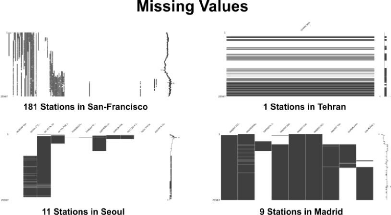
3. EDA, Exploratory data analysisFor the meteorological data, problems with the observation machine or environmental problems result in many missing values[Figure 4]. Thus, the missing values are replaced by the MissForest algorithm, an algorithm that estimates and replaces missing values, using the Random Forest model of machine learning, among the imputation techniques. The algorithm is a nonparametric method that uses correlations between variables to correct missing values and can be applied to mixed and high-dimension data and does not make distribution assumptions about the data [15].
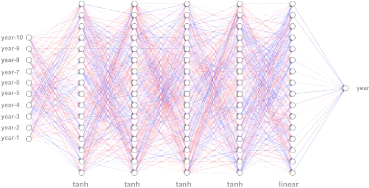
- 17 - [Figure 5] Visualization of Missing Values In the case of Seoul, San Francisco and Madrid, missing values were replaced based on Miss Forest because there were several stations, and in the case of Tehran, missing values were interpolated based on the time series date index because only one observatory existed. 4. PREDICTION MODELINGThe data used daily maximum temperature data from 1950 to 2019, and the prediction model was implemented using the Multi-Layer Perceptron (MLP) provided by Keras. Because of the large number of rows of data, the data was processed and analyzed using the BigData Analysis Framework Spark. 4.1. Data PreprocessingFor most Deep Learning models, train the model after converting the input data value to - 1 to 1 or 0 to 1[14]. After model learning and accuracy verification, put the converted input value for prediction and then return the output value to its original value. The values of all Max Temperatures were converted to 0 to 1 using the MinMaxScaler of Scikit Learn, and then returned to Fahrenheit, the unit of actual data, using the values of Max Value and Min Value that were stored, and then converted to Celsius units. Because one out of four years has leap year, I drop the rows which recorded in 29th February. Then all data are divided with 70% of Training datasets, 30% of Validation datasets and one dataset which contains the max temperature between 2010 and 2019 for predicting 2020 through well-made trained model. 4.2. Multi-Layer PerceptronSince I have 10 inputs, a 5 hidden-layer network with 16 neurons per layer. For the first to fourth hidden-layer of the five hidden-layer, the function tan-sigmoid (tanh) is used as an activation function and the last hidden-layer that returns 1 output data is based on linear activation function[13]. On the basis of MSE( Mean Square Error), minimization criteria, I adjust the weights and biases of the neurons on each step that makes reduce MSE value. After a number of iterations (epochs) , the neural network is trained and the weights are saved. - 18 - Finally I was able to get 4 trained models at each cities, Madrid, Seoul, San-Francisco, Tehran.
[Figure 6] Diagrams of Multi-Layer Perceptron IV. RESULT The following results will demonstrate that the diffusion rate of COVID-19 will decrease if the temperature is maintained above 16 degrees for more than 12 days of 14 days. The process for reaching the results is as follows :
- 19 - vii) Create a function using condition statements according to the above hypothesis and complete a model that predicts the date of the decrease using the estimated temperature data for each day this year. Results will come in the same format as 2020-04-10, and it can be seen that the number of confirmed cases in the city will begin to decline after 10 April 2020.
[Table 3] Predicted Breaking Point of COVID-19
[Table 4] Real Breaking Point of COVID-19 Two of the actual four cities, Tehran and Madrid, were able to reach conclusions similar to the actual results[Table3][Table4]. It started to decline after recording the largest number of confirmed cases on March 14 and March 30, respectively. But it showed the exact opposite of what Seoul and San-Francisco had expected. San-Francisco in the United States has seen a sharp increase in the number of confirmed cases since March, starting with New York, but the expected start date of the decline was expected to be Feb. 7. Seoul, South Korea, was also expected to see a decrease after April 10, but with a quick initial response, the number of confirmed cases has remained low since March 10. V. DISCUSSION The research paper was conducted on COVID-19, the most necessary analysis in the international economy and health sector as of 2020. Indeed, since April 2020, the new Confirmed Cases of COVID-19 have been decreasing in many countries, and economic indicators such as the U.S. Stock Exchange can also confirm that they are recovering from the worst times in late March to early April. However, there is a new discovery of the COVID-19 virus of various types on different continents, and there is a study that if temperatures and humidity change back to a viral environment in winter 2020, there may be a risk of being attacked again. The ultimate solution to this problem is the development of vaccines for the virus. As we saw from the results, we could see that the radio waves of Coronavirus were somewhat affected by temperature. However, as in the case of Seoul and San-Francisco, we could see that the difference in the number of confirmed cases under each country's health system affects more than the effects of climate. Thus, the study of the infectious nature of coronavirus showed that it could be affected by a variety of external variables as well as the simple climate and became an opportunity to be alert to the dangers of viruses. For the quick optimization of weather forecast deep learning models, models that have already been the best results in other studies have been actually taken and used[13]. 16 neurons and 5 hidden layers were used for each layer. Four of them adopted the function 'tangent sigmoid' as an activation function. In this study, the Mean Square Error (MSE), - 20 - which measured the accuracy of the model, obtained the accuracy of the model with a very stable result of 2.0, but in my study, MSE showed an overfit of the predictive model with a value of less than 1. The reason for this phenomenon was that the number of samples in the previous study was not so high at 730, and the previous study also showed that the MSE dropped from 2.71 to 0.211 when the number of samples increased from 730 to 1,460 was increased. Therefore, if deep-learning modeling is carried out using BigData, it can be found that overflowing occurs severely. A general BigData analysis does not mean a large number of rows, but a large number of columns. In this search, it is not a true BigData analysis because it was analyzed using only one variable called daily max temperature. However, physical systems that were implemented using dockers and Raspberry Pi to handle BigData, and logical systems that were implemented using Hadoop and spark, will be required to analyze the BigData of better quality of the upcoming paper. VI. CONCLUSION 'When will the transmission of COVID-19 begin to decrease? We also conducted a search paper to predict the date on when the economic recovery will begin? The study found that the virus had seasonal characteristics, but other external factors also played an important role through the results of four cases. We also found that climate forecasting models using Deep-Learning, unlike conventional numerical-based weather forecasting models, can complete hours of work in minutes. Such accelerated weather forecasting models could be used to minimize casualties and asset damage by applying them to areas that need to be responded in real time, such as natural disasters. A high-performance computer is essential in areas that handle a lot of data, such as weather, and have a lot of computations. In addition, data should be collected and processed in real time for these natural forecasting areas. However, weather forecasting using one existing supercomputer can be costly. I think the distributed computing system sector and the cloud sector are the right technologies to solve these problems. This is because the universality, one of the characteristics of distributed computing systems, can turn multiple computers into high-performance systems for a single application operation. Thus, it can play a role in dramatically reducing the cost of producing the same result. References
- 21 -
|