Article 8 :
LONG-TERM CHANGE IN THRESHOLD AND COMFORT ANDS
DYNAMICS
IN DIGISONIC COCHLEAR IMPLANT BEARERS
S. Gallégo, B. Frachet, C. Berger-Vachon , L.
Collet
Article soumis
Cet article décrit et interprète les modifications
des seuils et les dynamiques électriques en fonction de la durée
d'implantation.
La stabilité du seuil de détection après
les 100 jours d'implantation ainsi qu'une augmentation progressive de la
dynamique électrique démontre une stabilité de l'interface
bio-électrique et une préservation de la population neurale du
système auditif.
L'évolution de la dynamique électrique et du
seuil d'inconfort montre une adaptation progressive du
système auditif à la stimulation électrique. Afin
de prendre en compte les modifications de l'interface bio-électrique et
des capacités du sujet implanté cochléaire, il est
nécessaire d'effectuer des réglages réguliers du
processeur vocal.
LONG-TERM CHANGE IN THRESHOLD AND COMFORT LEVELS
AND
DYNAMICS IN DIGISONIC COCHLEAR IMPLANT BEARERS
S. Gallégo", B. Frachet3,C.
Berger-Vachonl, L.
1- UPRESA- CNRS 5020 laboratory
2- MXM laboratory
3- ORL department, Avicenne Hospital
ABSTRACT : Variations in threshold level
(TL), comfort level (CL) and dynamics were studied in a population of 80
subjects fitted with the Digisonic cochlear implant, a French multichannel
implant manufactured by the MXM company. Statistical analysis, by Anova, showed
very significant changes in CL and dynamics over implantation time. This may be
explained by neuronal plasticity facilitating auditory system adaptation to the
electrical stimulation. Results for TL over implantation time further showed
the implant system to be stable and not destructive of the auditory nervous
system. This may be due to the fact that each electrode of the Digisonic
implant has an in-series capacity which very accurately controls and balances
the number of positive and negative charges. Such a charge balance is vital to
avoid electrolysis between electrode and physiological environment.
Key words: Cochlear Implantation,
Threshold, Dynamic range, Auditory plasticity, Integrity system
INTRODUCTION
It is very important to develop an objective means, using
Electrical Auditory Brainstem Responses or Stapedius Reflex, of measuring
threshold level (TL) (Gallégo et al, 1997) and comfort level (CL)
(Jerger et al, 1988) in cochlear implant bearers, to enable setting in children
and in certain adults when conditioning is a problem. These techniques, however
take too long for routine clinical application on all the electrodes. It would
thus be very interesting to be able to determine TL and CL for the whole set of
electrodes on the basis of just two or three of them (Battmer et al, 1995).
According to the literature, there are several parameters
affecting TL and CL values. Firstly, Lusted et al (1984), Shannon (1983),
Pfingst et al (1980, 1984) have shown levels and dynamics to be ciosely
dependent on subjects' aetiology and spiral ganglion neurone population. The
levels also very much depend on the electrode's distance from the neurones to
be stimulated (Javel et al, 1987 ; Pfingst et al, 1980). Whether stimulation is
radial or longitudinal in relation to the electrode holder also affects levels
(Pfingst et al, 1981). The position of the stimulation site along the cochlea
is also important as there are differences in neurone density according to
cochlear and ganglion tonotopy (Hinojosa et al, 1985 ; Spoendlin et Schrott,
1988, 1989), and this is reflected in differences in dynamics (Shannon,
1983).
Here are presented the results from a European multi-centric
study involving 80 Digisonic Implant bearers which sought to determine implant
duration effects on the levels and dynamics of the 15 electrodes.
MATERIAL & METHODS
The Digisonic cochlear implant
The Digisonic is an transcutaneous cochlear implant comprising
15 electrodes (Beliaeff et al, 1994). Digital signal processing is by Fast
Fourier Transform (FFT), with real-time calculation of acoustic signal spectrum
over 64 frequency bands between 122 and 7800 Hz. Each electrode corresponds to
a set of frequency bands. The part of the apparatus implanted along the cochlea
consists of an electrode holder carrying 15 0.5 mm electrodes at 0.7 mm
intervals. The stimulated area runs round the first arm of the cochlea roughly
from the fifth to the twentieth millimetre from the basal extremity (Miller et
al, 1993) -- i.e., roughly speaking, the area coding for 1-16 kHz frequencies.
Stimulation is in what is called the common ground mode : for one electrode
stimulated all the others act as ground. In the Digisonic, the parameter which
varies to increase the intensity of the sound, or perceived stimulus, is the
pulse-time, in microseconds, pulse amplitude being constant. The current
injected between the stimulation electrode and the others is of the order of 1
mA (Gallégo et al, submitted).
Cochlear implant subjects
80 multichannel Digisonic cochlear implant bearers took part
in this multicenter European study (*): 41 female, 39 male. 43 had right
implants, 30 left, and data were missing for 7. Aetiologies were very varied.
Mean hearing deprivation duration was 11.9 years (s.d. = 14.5 years) for a
range from 0.3 year to 62 years.
A database of ail patient settings was created on Excel,
containing in particular TL and CL values for each of the 15 electrodes. Each
patient's setting file also contained the history of setting from first
stimulation to 24 moths' post-operative follow-up. An inclusion criterion was
that 12 of the 15 electrodes were should be working. The electrodes were
arbitrarily numbered 1 to 15, basal to apical.
(*) Bobigny Hôpital Avicenne (Fr) - Paris
Hôpital St Antoine (Fr) - North Riding lnfirmary, Middlesbrough (UK) -
Istituto di Audiologia Milano (It) - Marseille Hôpital de la Timone (Fr)
- Paris Hôpital Trousseau (Fr) - CHU Grenoble (Fr) - CHU Bordeaux ( Fr) -
Lyon Hôpital E. Herriot (Fr)
Threshold (TL) and comfort (CL) level measurement for
the 15 electrodes
Level setting measurement for Digisonic cochlear implant
bearers is performed at a fixed electrical stimulation frequency of 300 Hz. To
avoid adaptation effects, the stimulation is intermittent : 0.5 sec. ON, 0.8
sec. OFF.
The 15 electrodes are set individually, usually starting from
the most apical (n° 15) as this one produces the most easily identifiable
sound, quite different from phantom sensations due to tinnitus (particularly at
first setting).
TL corresponds to a sound at the limit of perceptibility while
still clearly audible. CL corresponds to a sound of very high sensation level
but which is still bearable. After testing the electrodes individually, TL and
CL are balanced by sweeping basal-toapical and apical-to-basal to adjust levels
(TL and CL). Thus sound levels can be balanced against the TL and CL of all
electrodes.
As well as these levels, the dynamics of each electrode was
studied, calculated as ten times the Iogarithm of CL over TL (dynamics = 10 LOG
( CL / TL) ).
RESULTS & DISCUSSION
Mean TL, CL and dynamics per
electrode
1 2 3 4 5 6 7 8 9 10 11 12 13 14 15
|
4 3 2 1
|
|
|
|
|
1 2 3 4 5 6 7 8 9 10 11 12 13 14 15
Electrode Num ber (1:basal 15:apical)
|
Figure 1 : Mean values and standard errors for
threshold level (TL) and comfort level (CL) (above) and dynamics (below) per
electrode in 80 Digisonic cochlear implant bearers.
Figure 1 shows means and standard errors for TL and CL (above)
and dynamics (below) per electrode in 80 Digisonic cochlear implant bearers. TL
and CL are in microseconds of 1 mA stimulation, and dynamics is in electrical
dB. For each subject, mean levels over time are shown. TLs and CLs per
electrode show what is classically known as a "banana" form, similar to that
described by Battmer et al (1995) for the Nucleus cochlear implant in "common
ground" stimulation mode. Dynamics averaged 2 to 4 electrical dB, in agreement
with Shannon's findings (1989) of narrow dynamics for pulse-times less than 100
ps without this affecting the number of sound levels.
Repeated measure Anova analysis found no correlation between
TL and cochlear area (i.e. electrode number) stimulated. The distance between
the stimulated
neurones and the stimulating electrode, and also the
functional condition of the neurones, are therefore probably fairly independent
of the cochlear area stimulated (i.e. electrode number).
CL and dynamics, on the other hand, did depend on cochlear
area (p<0.001). On the basis of the literature (Lusted et al, 1984 ;
Shannon, 1983 ; Pfingst et al, 1980, 1984), this could be explained in terms of
differences relating to the number of neurones stimulated. This is borne out by
anatomo-physiological correlates which, in normalhearing subjects, show a
rising gradient of cell density up to the end of the first arm of the cochlea
followed by a graduai decrease to the apex (Hinojosa et al, 1985 ; Spoendlin et
Schrott, 1988, 1989). Electrode 13 should correspond to the area of maximum
number of stimulated neurones, its dynamics being the highest.
TL, CL and dynamics over implantation
time
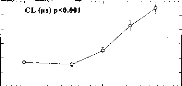
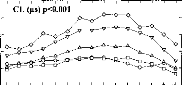
Figure 2 shows means and standard errors for CL (above), TL
(middle) and dynamics (below) per electrode in 80 Digisonic cochlear implant
bearers at different periods of implantation. And figure 3, similarly, shows
means and standard errors for CL (above), TL (middle) and dynamics (below) for
the average of the 15 electrodes in the same population. CL and TL are in
microseconds of 1 mA stimulation, and dynamics is in electrical dB. Two-way
repeated measure Anova (for electrode stimulated and implantation time)
revealed the following findings.
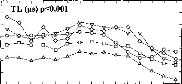
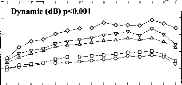
Changes in TL, CL and dynamics with implantation time depended on
stimulated number (p=0.008 for TL, p<0.001 for CL and p<0.001 for
dynamics) (figure 2).
TL fell until day 100, suddenly rose, then plateaued
(p<0.001). The fall until day 100 may be explained by enhanced threshold
detection on the part of the implanted subject, by neuronal plasticity and by
post-operative cicatrisation.
The sudden change in TL after 100 days has been previously
described in the literature (Clark et al, 1988). A study in guinea-pigs showed,
psycho-physically and electrophysiologically (Miller et ail, 1995), a sudden
change in TL between days 50 and 140 of implantation. This corresponds to two
phenomena: firstly, progressive degeneration of spiral ganglion dendrites
projecting onto the cochlea, entailing an increased electrode-to neurone
distance ; and, secondly, slight fibrosis along the
electrode holder, altering environmental impedance. That TL
plateaux afterwards
70 60 50 40 30
20 26 24 22 20 18 16 14 12 6
5 4 3 2
10 100 1000
TL (rts) p<0.001
10 100 1000
Dynamic (dB) p<0.001'
10 100 1000
Days after implantation
55 50 45 40 35 30 25
22 20 18 16 14 5 4 3 2
shows that the interface between physiological environment and
electrode stabilises, which is due to the Digisonic implant's perfect control
of charge through the electrodes by coupling capacity. Continued rise in TL
over implantation time would have indicated progressive auditory system
degeneration due to electrolysis because of poor charge control.
1 2 3 4 5 6 7 8 9 10 11 12 13 14 15
1 2 3 4 5 6 7 8 9 10 11 12 13 14 15
1 2 3 4 5 6 7 8 9 10 11 12 13 14 15
Electrode number (1:basal 15:apical)
o <20 days y 140< <300 days
· 20< <60 days 300< <640 days
· 60«140 days
Figure 2 : Mean values and standard errors
for Comfort level (CL) (above), threshold level (middle) and dynamics (below)
per electrode at various post-implantation periods (0-20, 20-60, 60-140,
140-300 and 300-640 days) in 80 Digisonic cochlear implant bearers.
Figure 3 : Mean values and standard errors
for Comfort level (CL) (above), threshold level (middle) and dynamics (below)
for the whole electrode set at various post-implantation periods (0-20, 20-60,
60-140, 140-300 and 300-640 days) in 80 Digisonic cochlear implant bearers.
Unlike TL, CL and dynamics increased progressively over
implantation time (Kubo et al, 1996). In two years, each electrode's dynamics
doubied. These findings agree with those of Miller et al (1995) in guinea pigs.
This increase in CL and in dynamics is a matter of neuronal plasticity, the
auditory system becoming ever better at encoding
intensity. This plasticity is probably due to the auditory
nervous system's having to adapt to much higher neuronal discharge rates (in
spike/sec.) with electrical as compared to acoustic stimulation (Kiang and
Moxon, 1972) and the much greater fiber synchronisation greatly strengthens
neuronal interaction under electrical stimulation, considerably lowering CL and
thus reducing dynamics.
The questions raised by the change over time in individual
electrode dynamics are: how does the auditory system adapt to cope with the
electrical stimulation, and what are the consequences for cochlear implant
bearers' performance development over time (Spivak et Walzman, 1990 ; Kubo et
al, 1996) ?
CONCLUSION
A study of TL and CL in a population of 80 Digisonic cochlear
implant bearers over a period of two years revealed very significant change
with implantation time. Intensity encoding capability increases (neuronal
plasticity). The study further showed that Digisonic cochlear implant causes no
progressive auditory system degeneration.
It is therefore both necessary and interesting to take change
over implantation time in electrode levels and dynamics into account to model
levels for all 15 electrodes on the basis of objective measurements in 2 or 3.
Objective techniques do not allow simultaneous determination of TL and CL:
EABRs can give TL (Gallégo et al, 1997), and Stapedius Reflex gives only
CL (Jerger et al, 1988).
REFERENCES
Battmer R.D., Gnadeberg D., AIIum-Mecklenburg D.J.
(1995) Algorithmic representation of common ground Programming in children with
the Nucleus Device. Adv Otorhinolaryngol, Basel, Karger, 50
83-90.
Beliaeff M., Dubus P., Leveau J.M., Repetto J.C.,
Vincent P. (1994) Sound processing and stimulation coding of Digisonic DX10
15-channel cochlear implant. Hochmair IN, ed. Advances in cochlear implant.
Innsbruck: Verlag. pp. 198-203.
Clark G., Shepherd R., Franz B., Dowell R., Tong Y.
(1988) The histopathology of the human temporal bone and auditory central
nervous system following cochlear implantation in patient. Acta Otolaryngol.
(Stockh) (suppl 448), 1-65.
Gallégo S., Truy E., Morgon A., Collet L. (1997)
EABRs and surface potentials with a transcutaneous multielectrode cochlear
implant. Acta Otolaryngol. (Stockh) 117, 164-168.
Gallégo S., Luu B.L., Berger-Vachon C. (in
press) Modelling of electrical stimulation delivered
by the Digisonic Multichannel cochlear implant. Advance
Modelling Signal Eng.
Hinojosa R., Seligsohn R., Lerner S. (1985) Ganglion
cell counts in the cochleae of patients
with normal audiograms. Acta Otolaryngol. (Stockh) 99,
8-13.
Javel E., Tong Y., Shepherd B., Clark G. (1987)
Responses of cat auditory nerve fibers to
biphasic electrical current pulses. Ann. Otol. Rhinol.
Laryngol. 96(sup 128), 26-30.
Jerger J., Olivier T.A., Chmiel R.A. (1988) Prediction
of dynamic range from stapedius reflex in
cochlear implanted patients. Ear Hear. 9,
4-8.
Kiang N.Y.S., Moxon E.C. (1972) Physiological
considerations in artificial stimulation of inner ear. Ann. Otol. 81,
714-730.
Kubo T., Iwaki T., Ohkusa M., Dol K.,
Uno A., Yamamoto K., Fujii K. (1996) Auditory plasticity in cochlear implant
patients. Acta Otolaryngol. (Stockh) 116, 224-227.
Lusted H., Shelton C., Simmons S. (1984) Comparison of
electrode sites in electrical stimulation of the cochlea. Laryngoscope 94,
878-882.
Miller C.A., Abbas P.J., Brown C.J. (1993) Electrically
evoked auditory brainstem response to stimulation of different sites in the
cochlea. Hear. Res. 66, 130-142.
Miller C.A., Faulkner M.J., Pfingst B.E. (1995)
Functional responses from guinea pigs with cochlear implants II. Changes in
electrophysiological and psychophysical measures over time. Hear. Res. 92,
100-111.
Pfingst B., Telman S., Sutton D. (1980) Operating ranges
for cochlear implants. Ann. Otol. Rhinol. Laryngol. 89(sup 66),
1-4.
Pfingst B., Sutton D., Miller J., Bohn B. (1981)
Relation of psychophysical data to hystopathology in Mon keys with cochlear
implant. Acta Otolaryngol. (Stockh) 92, 1-13.
Pfingst B. (1984) Operating ranges and intensity
psychophysics for cochlear implants. Arch. Otolaryngol. 110,
140-144.
Shannon RV. (1983) Multichannel electrical stimulation
of the auditory nerve in man.l. Basic psychophysics. Hear. Res. 11,
157-189.
Shannon RV. (1989) A model of threshold for pulsatile
electrical stimulation of cochlear implants. Hear. Res. 40,
197-204.
Spivak L.G., Waltzman S.B. (1990) Performance of
cochlear implant patients as a function of time. J. Speech. Hear. Res. 33,
511-519.
Spoendlin H., Schrott A. (1988)The Spiral Ganglion and
the Innervation of the Human Organ of Corti. Acta. Otolaryngol. (Stockh) 105,
403-10.
Spoendlin H., Schrott A. (1989) Analysis of the human
auditory nerve. Hear. Res. 43, 25-38.
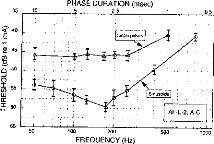
2-Seuils en fonction de la fréquence de
stimulation
D'après la littérature, les seuils de
détection et les dynamiques électriques décroissent
progressivement en fonction de la fréquence de stimulation (Shannon
1983, Pfingst et al, 1991, 1993). La fonction qui fait correspondre les seuils
de détection à la fréquence de stimulation est très
variable, selon le sujet ; il n'existe pas de corrélation franche entre
les seuils de détection pour deux fréquences de stimulation
(Brown et al, 1999).
50
500
1000
-35 10
Figure 47 Modification des seuils
en fonction de la fréquence de stimulation, d'après Pfingst,
1991
Toutes ces études ont utilisé l'amplitude de
l'impulsion pour coder l'intensité de stimulation. De plus la forme de
l'impulsion était symétrique. L'étude des modifications
des seuils et dynamiques électriques en fonction de la fréquence
de stimulation via la stimulation de l'implant cochléaire Digisonic
semble donc importante pour la mise en place de stratégie de codage
à des fréquences de stimulation variables.
Nous avons mesuré les seuils de détection (TL)
et de confort (CL) sur trois électrodes (électrode basale :1
à 5, électrode médium : 6 à10, électrode
apicale :11 à 15) à 4 fréquences de stimulations
différentes (75, 150, 300, et 600 Hz) chez une population de 16
implantés cochléaires Digisonic. Pour éviter les
phénomènes d'adaptation, la stimulation est intermittente (0.43
seconde ON et 1 seconde OFF). Le paramètre utilisé pour faire
varier l'intensité de stimulation est la durée de l'impulsion (en
ps). Le courant injecté entre l'électrode de stimulation et les
autres est de 1 mA. Afin d'atténuer la fatigue auditive, nous avons
d'abord mesuré les TL, puis les CL.
Le seuil de détection (TL) correspond au seuil absolu de
perception. Pour pouvoir le mesurer très
précisément
nous avons commencé par stimuler à un niveau de sonie nettement
perceptible pour que
le sujet puisse repérer le son, puis nous avons
diminué l'intensité de stimulation jusqu'à la
disparition
totale de la sensation. Le TL correspond au dernier niveau
d'intensité auquel le sujet a entendu un son. Cette technique permet au
sujet de suivre le son jusqu'à des intensités de stimulation
très faibles.
Le seuil d'inconfort (CL) correspond à un niveau
d'intensité juste au-dessous de la douleur. Tout comme la mesure du TL,
il faut commencer par stimuler à un niveau de sonie moyen, puis
augmenter progressivement l'intensité de stimulation jusqu'à
atteindre un niveau de sensation proche de la gêne. Cette technique
permet de limiter la fatigue auditive et de protéger le sujet de sons
qui pourraient être désagréables.
En plus des seuils, nous avons étudié la dynamique
de chaque électrode. La dynamique se mesure en décibel (dynamique
=10 Log (CL/TL)).
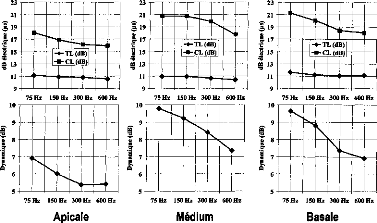
La partie haute de la figure 48, représente la moyenne
pour la population des 16 implantés cochléaires des seuils de
détection et de confort pour trois zones de cochlée
différentes en fonction de la fréquence de stimulation. Les
valeurs sont indiquées en décibel, ce qui correspond à 10
log de la durée de l'impulsion en ps.
La partie basse de la figure 48, représente la moyenne
pour la population des 16 implantés cochléaires des dynamiques
électriques pour trois zones de cochlée différentes en
fonction de la fréquence de stimulation.
L'analyse statistique par une Anova à deux facteurs (la
fréquence de stimulation et la zone de cochlée stimulée)
sur mesures répétées (les patients)
- ne montre pas de modification du TL en fonction de la zone
stimulée (p>0.1) et en fonction de la fréquence de stimulation
(p=0.079)
- indique une variation statistique du CL en fonction
- de la zone stimulée (p<0.001). La région
apicale est différente des régions basale et médium. - de
la fréquence de stimulation (p<0.001). Les fréquences 300 et
600 Hz ne sont pas différentes statistiquement.
- indique une variation statistique de la dynamique
électrique en fonction
- de la zone stimulée (p<0.001). La région
apicale est différente des régions basale et médium. - et
de la fréquence de stimulation (p<0.001). Les fréquences 300
et 600 Hz ne sont pas différentes statistiquement.
5
75 Hz
150 Hz 300 Hz 600 Hz
75 Hz 150 Hz 300 Hz 600 Hz
·
Apicale
10
9
H
7! . 8 z
1 7
k
6
75 Hz 150 Hz 300 Hz 600 Hz
Médium
10
150 Hz 300 Hz 600 Hz
9
e
8
Ef
5 7
6
5
75 Hz
75 Hz 150 Hz 300 Hz 600 Hz
75 Hz 150 Hz 300 Hz 600 Hz
Basale
23
23
21
ie 19
0.17
e 15
21
11
g 13
11
9
9
10
9
3 8
5 7
6
5
23
21
19
3 . I 7
2 15 ZI 13
11
9
1 I
· 1
TL (dB) -18- CL (dB)
II (dB) -81.. CL (dB)
Figure 48 : Moyenne des seuils de
détection et de confort en dB ps et dynamique électrique en
dB
chez une population de 16 sujets implantés cochléaires
Digisonic en fonction de la fréquence de
stimulation pour
différentes zones stimulées
Le fait que les seuils de détections soient
très peu sensibles à la fréquence de stimulation est
contradictoire avec les résultats obtenus avec d'autres systèmes
implantés (Shannon, 1983, Pfingst, 1991). Cela peut sûrement
s'expliquer par les caractéristiques du stimulus électrique qui
sont très différentes de celles des autres systèmes. En
effet, avec l'implant cochléaire Digisonic la durée et non
l'amplitude de l'impulsion sert à coder la sonie ; cette durée
est très faible au seuil de détection (de 5 à 20 ps
généralement), ce qui augmente la synchronisation des fibres. De
plus l'impulsion qui est asymétrique stimule le nerf principalement sur
sa phase positive. Tout cela fait que le seuil de détection est
très stable d'une mesure à une autre et est très peu
dépendant de la fréquence de stimulation.
Le fait que le seuil de détection varie peu en
fonction du site de stimulation provient principalement du mode de stimulation
en masse commune et du fait que la distance et l'impédance entre les
électrodes de stimulations et les neurones du ganglion spiral à
stimuler sont peu dépendants de la zone stimulée.
Les modifications des seuils d'inconfort et des dynamiques en
fonction de la fréquence de stimulation s'expliquent par l'augmentation
de la sonie en fonction du nombre de charge injectée par seconde. Les CL
et la dynamique sont dépendants de la zone de cochlée
stimulée. D'après la littérature (Lusted et al, 1984 ;
Shannon, 1983 ; Pfingst et al 1980, 1984), cela pourrait s'expliquer par des
différences liées au
nombre de neurones excités. De plus cela peut se
confirmer par des corrélats anatomo-physiologiques
(Hinojosa et al, 1985 ; Spoendlin et Schrott,1988, 1989) qui
montrent chez le sujet normo-entendant un gradient croissant du nombre de
cellules par millimètre carré jusqu'à la fin du premier
tour de cochlée, puis une décroissance progressive jusqu'à
l'apex.
3- Seuils en fonction de la durée de
stimulation
Il est important de savoir si, tout comme lors d'une
stimulation acoustique, une stimulation électrique prolongée de
la cochlée engendre une diminution progressive de la sonie. Ce
phénomène appelé adaptation de sonie est notamment
très important lors d'atteinte retro-cochléaire.
| 

