Article 2 :
MODELLING OF THE ELECTRICAL STIMULATION DELIVERED BY
THE
DIGISONIC MULTICHANNEL COCHLEAR IMPLANT
S. Gallégo, B.L. Luu,
C. Berger-Vachon
Advance in Modelling & Analysis, 1998 39: 1, 39-53
Cet article décrit les caractéristiques de la
stimulation électrique du modulus cochléaire
générée par l'implant cochléaire
Digisonic®.
Dans cet article nous avons modélisé la
stimulation électrique générée par l'implant
cochléaire en fonction de divers paramètres. Les contraintes
physiologiques de la stimulation électrique sont décrites :
équilibre des phases, charges par cycle faibles, stimulation
localisée ... La description et la simulation de la stimulation par
l'implant cochléaire Digisonic® permettent de conclure
à une grande sécurité :
- La quantité de charges envoyées au milieu est
très faible,
- Les phases sont parfaitement équilibrées,
- La zone de stimulation est très localisée.
Modelling of the electrical stimulation delivered by
the
DIGISONIC Multichannel cochlear implant.
Stéphane Gallégo (1,2), Ba Lê
Luu (1), Christian Berger-Vachon (1)
1- Laboratory "Perception and Hearing Mechanisms", CNRS UPRESA
5020, ORL Bdg, E. Herriot Hospital, F-69437 Lyon Cedex 03, France.
2- MXM Laboratory, 2720 chemin Saint-Bernard, 06224
Vallauris-cedex, France.
Key Words: Cochlear implant, Modelling, Surface
Potential.
Abstract
The study concerns a model of the skin recording given by the
DIGISONIC pulses. Digisonic is a multichannel cochlear implant made by the
French society MXM. Two models (using 3 and 5 electrodes) are described, one
simple, the other more complex. Results show that both models behaved very
similarly when the pulse duration was between 5 and 160 its (range commonly
used with cochlear implantees). This duration was Little affected by the
physiological medium impedance. The stimulation concerning the medium influence
and the .pulse duration, led to information about the delivered
electric load and the stimulation shapes. This modelling is developped in order
to help the setting of electrode thresholds with implantees.
Introduction
A cochlear implant (CI) is a device which restores some auditory
sensation to people having a
total bilateral cophosis. CI delivers an
electrical stimulation to the auditory nerve.
Speech
--recognition performances of some patients are really
amazing (some of them can even speak on
the telephone). Nevertheless, clinical results are very
heterogeneous. Some factors such as aetiology of deafness, length of sensory
deprivation, etc can explain implantees' performances, but much of the results
still remains unexplained.
In spite of the importance of knowing the stimulated zone on
the cochlea, only a few studies have considered the influence of the physical
situation of the electrical stimulation (Black et al, 1983; O'Leary et ai,
1985). This information is important, as it concerns the fondamental of the
voice frequency (pitch). It has been shown that modifications occur when
acoustical frequencies are redistributed along the electrodes because the
sensation varies with, the stimulated zone (Shannon, 1983). Moreover, some
authors have shown that the tonal perception, regarding the electrode, is
linked to the diffusion width of the current (Townshend et al, 1987). The
possibility of pinpointing the stimulation could help to estimate the frequency
gap perceived between two electrodes taking into consideration the tonotopic
difference.
The necessity of using a coupling condenser between the
patient and his cochlear implant in order to prevent the electrolysis of the
biological medium, adds fiwther problems. Condenser addition introduces
artefacts in the circulation of current charges for short duration pulses (due
to non-linearity). Consequently, this fact can modify the conversion of
acoustical dB to electrical dB. Moreover, it is necessary to keep the charge
delivered to the cochlea under control, in order to remain below the safety
limit which is 40 itC per square millimetre and per stimulation cycle (Frayel
et al, 1986).
The goal of this study is to built up a model of the
electrical recording observed with a pulse delivered between the implant
electrodes. lis link with the assessment of the correct working order of the
machine justifies the analytical study to establish the influence of electrode
and medium parameters. First, we will study the principle of the electrical
stimulation given by the DIGISONIC cochlear implant. Two models with increasing
complexity (3 and 5 electrodes) were constructed. Then the responses of the two
models were compared. Relation between the
pulse duration and the amount of electricity (charge)
delivered bythe implant, was calculated for several impedances of the
physiological medium.
Material and methods
The MXM DIGISONIC cochlear
implant
Microphone --\
Implanted electrodes amoeOECIC}mag--
Behind the ear device
Skin
Internai
receptor
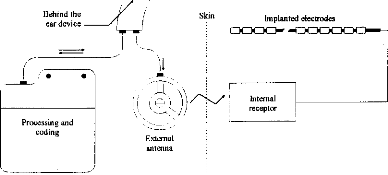
Figure 1: Block Diagram of the MXM DIGISONIC cochlear
implant. The external part is on the left and the implanted part on the
right.
The DIGISONIC is a cochlear implant made of two
different parts (fig 1); the external one .performs the signal processing (real
time FFT) and transmits some information to the second part. The internai part,
totally implanted, is made of 15 active electrodes distributed along the
cochlea (Beliaeff et al, 1994), usually situated from 5 to 20 millimetres from
the round window. The distance between two electrodes is 0.7 mm. A frequency
band is attached to each electrode. The stimulation used is common ground (one
electrode is active, and ail the others are connected to the ground). Each
electrode has a 220 nF serial condenser to force the charge mean value to zero.
The generator can deliver pulses with variable amplitude and duration.
Ordinarily, for a given patient, the amplitude is fixed (ranging from 1.2 to 6
volts, where 3.35V is usually taken). The duration of the pulse is variable; it
transmits the volume. Generally the
duration lasts from 20 to 60 ils; the maximum range is from 5
to 310 ris. The output
impedance of the stimulation transistor cannot be
neglected; it is connected to the output
voltage (R(E)).
Cochlear implant and physiological medium
In our models, the cochlear implant is represented by a
generator of pulses connected in series with a condenser (C2=220nF). As
indicated above, the output impedance of the generator, R(E), is variable. The
electrode and physiological medium were represented by a condenser placed in
parallel with a pure resistance (Rattay, 1990). In vitro measurements,
performed at the MXM laboratories, indicated that the capacity between two
electrodes is about 100 nF (C1) and the resistance is 2 kohms (R1). Modelling
of the electrical stimulation of the cochlear implant in a physiological
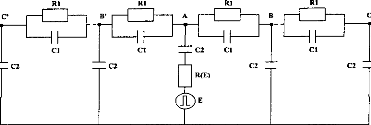
medium, is represented by the circuit indicated on figure 2.
V2 VI > < VI < V2
RI RI RI RI
I-. A H B
C'
Cl
C2 _ C2
C2
C2
Cl
Fig 2: Model of the stimulation delivered by the cochlear
implant DIGISONIC. The generator is between point A (active electrode) and the
ground; ail 14 other electrodes are connected the ground through condensers. E
varies from 1.2 to 6 volts, and the pulse duration is from 5 10 310 ,us. C2 is
220 nF and R(E) is a fonction of E. Concerning the physiological medium, RI is
2 kohms and C1 is 100 nF (average values).
A mathematical model
A full model would consider a 14th order differential equation
with one for each electrode. But
the further we are from the active
electrode, the weaker the current. Aller several electrical
divisions the current can be neglected. One of the aims of our
modelling was to reduce the number of useful electrodes. We considered 3
electrodes A, B, B' (3-pole) in the first model and five
electrodes A, B, B', C, C' (5-pole) in the second model. Consequently 13 active
electrodes were possible in the first model (1 electrode had to be taken on
each side of the active electrode) and eleven in the second model. In order to
simplify the models, symmetrical representations (on each side of the active
electrode) were used, thus leading to a simpler calculation. Then, three time
constants were introduced, TI=R1C1, T2=R2C2, T3=R3C3. The Laplace transformer
was used in the calculation. Finally, V1 and V2 were determined by the
following equations (alter the classical simplifications).
3-electrode model
V(1.3) r3p
E 3+(3r + 2 r2+ z-3)P +2r ril)2
5-electrode model
V(1.5) 81-3P
(11-(0.5r3-1-2-)P)
E - (16r 2r2 +8r r 2r 3)
p3 +(20r2 +32r r 2+8r 2r
3+20r r 3+ 421) P2 + (40r + 16r 2+20r 3) P
+20
V(2,5) 4 r3p (1+ z-
p )
E 2.
- (16r2r2-1-8T r2r3)P3
+(20r2+ 32r r2+8r2r3+20r r3+4r3)p2 +(40r
+16r2+20r3)P +20 Simulation
In order to solve the above differential equations, they were
rewritten in their differential format.
Then higher order equations were written as first orders with
variables being double or triple integrals of voltages V1 or V2. The solution
was then achieved with the Runge-Kutta method, using variable steps.
Results
First, the evolution of R(E) was directly measured on an
implant. Figure 3 shows the evolution on two different charge impedances (1
kohm and 10 kohms) when E is increased. R(E) decreases exponentially, with
respect to E. An asymptotic value (500 ohms) was observed. When E=3.35V
(voltage currently used) is used, then R(E) is close to 1 kohm.
|
E
o
2000
U
C
O
1500
E
o
1000
"FI
C
o
|
|
3.0 3.5 4.0 4.5 5.0 5.5 6 0
Power supply voltage (Volt)
Figure 3 : Impedance of the output transistor with respect to
the output voltage when the load is 1 kohm (full dots) and 10 kohms (empty
squares).
The next step was to compare the two models when the pulse
duration varied. The experimental range was from 5 to 320 gs and the steps were
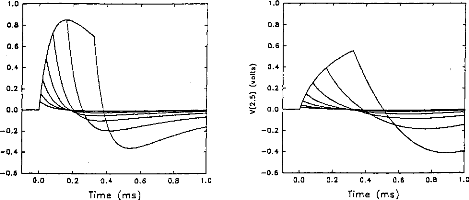
exponentially increased. Figure 4 indicates the voltage VI given by the first
model. Figures Sa and 5b show the simulation of VI and V2 by the second model.
VI (V(1,3) and V(1,5)) are very similar for the two models. V2 is mostly lower
than VI when the duration of the excitation pulse is below 80 gs.
|
1.0 0.8 0.6 0.4 0.2 0.0 -0.2 -0.4 -0.6
|
|
Figure 4: V(1, 3) obtained from the 3-pole model, with the
pulse duration (t=5, 10, 20, 40, 80, 160, 320 ,us) taken as a parameter. The
load had the physiological value of 2 kohms and Cl was 100 nF (E=3.35 volts,
R(E)= lkohm). The curve on the right refers to 320 ,us.
|

0.0 0.2 0.4 0.6 0.8 10
Time (ms)
1.0
0.8
0.6
0.4 0.2 0.0 -0.2 -0.4 -0.6
0.0 0.2 0.4 0.6
Time (ms)
-0.2
-0.4
-0.6
0.8 1 0 0.0 0.2 0.4 0.6
Time (ms)
0.8
0.6
1.0
0.2
10
0.8
Fig V(1, 5), VA-VB, simulation (5 pole
mode!) with respect to the pulse duration (1=5, 10, 20,
40, 80, 160, 320 us). The load had a physiological value of 2 kohms and Cl was
100 nF (E=3.35 volts, R(E)= lkohm).
Figure 5b: V(2,5), VB-VC, simulation (5- pole model) with
respect to the pulse duration (1=5, 10, 20, 40, 80, 160, 320 ,us). The load had
a physiological value of 2 kohms and Cl was 100 tiF (E=3.35 volts, R(E)=
lkohm)
In normal conditions, the impedance of the physiological
medium does not vary significantly. But, in special circumstances, for instance
in the case of partially ossified cochlea, impedance is increased on some
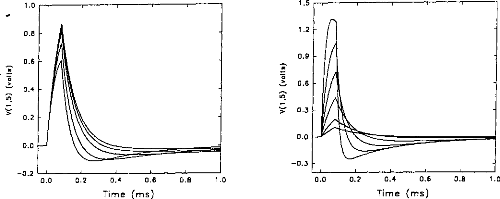
electrodes. Figures 6a and 6b show the evolution of the impulsion voltage
(using the second model) respectively considering the resistance R1 and the
capacity C l. The
duration of the excitation pulse was kept below 80 lis.
Variation of the response (shape and amplitude) was high with respect to C I
(figure 7). On the contrary, the influence of RI was rather small. The time to
reach the maximum of the output pulse followed the value of R1.
0.8
10
0.0 0.2 0.4 0.6
Time (ms)
-0.2 '
0.0
0.2
0.4
Time
0.6
(ms)
0.8
10
1.0
0.8
0.6
0.4
0.2
0.0
1.5
1.2
0.9
0.6
0.3
0.0
-0.3
Figure 6a: V(1,5) simulation (5-pole model), Figure 6h:
V(I,5) simulation (5-pole mode!),
with respect to the load resistance (RI = 1, 2, when the
condenser had the following values.
5,
· 10, 20 kohms) where Cl = 100nF. (E=3.35 (CI =20,
50, 100, 200, 500, 1000 nj9 where
volts, R(E)= I kohm). The higher the RI=2kohms. (E=3.35
volts, R(E) = I kohrn).
impedance, the greater the amplitude. The smaller the CI, the
higher the amplitude.
It is possible to calculate the electrical charge delivered to
the medium taking the integration of the positive part of the pulse and a
division by Rl.
fp
21V i(t)dt
U- ° R1 where V1(t0)=0.
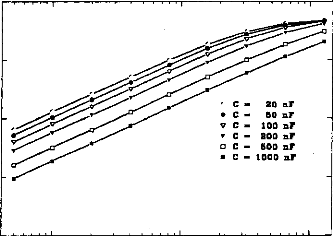
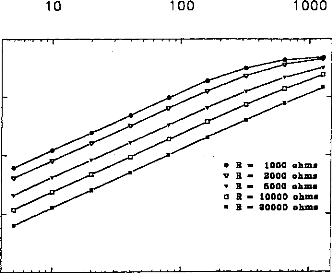
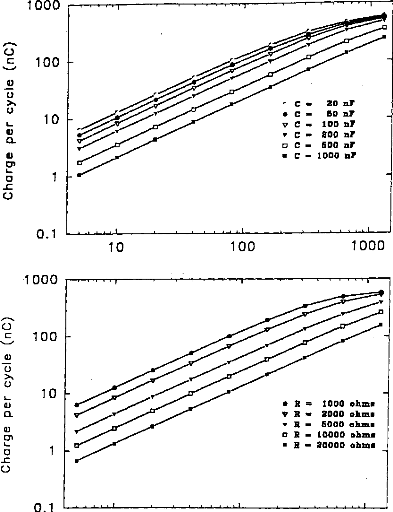
The amount of electricity denoted Q, has been calculated in
different situations, where the excitation pulse duration and the medium
impedance varied. Results are given in figures 7 (first model) and 8 (second
model). Results show that Q was linearly increased until an excitation duration
of 160 jis caused saturation. The same trend was observed with respect to
the
medium resistance. Both models led to equivalent results
for pulses shorter than 320 las and with a capacity C2 less than 500 nF
(Q2/Q1<ldB) (figure 9).
C 20 nr
· C 50 ni'
ü C- 100 sir
· C 800 nr
q C 600 nr
n C 1000 ni'
1 000
· 100 10
(t)
1
_c
U
10
100
1000
· R = 1000 ohms
· R - 2000 ohms
· R na 6000 ohm. a R - 10000 ohm.
n R 20000 ohms
0.1
1000
· 100
o
o
10
L.
o 1 _c
0.1
10 100 1000
Pulse duration (j s)
Figure 7: Load delivered
hy the electrodes B and B' calculated using the 3-pole model, with respect 10
the pulse duration when several values qf CI (top, R1=2 kohms), or RI (bottom,
Cl - 100 nF) are used (E=3.35 volts, R(E) =1
kohm):
1
0.1
10
100
1 000
1000
100
20 nr
C 50 nr
C 100 nr
C 800 nr
C-- 500 nr
C 1000 nr
1 0
· R = 1000 ohm.
· R int 2000 ohm,
· R ms 5000 ohm.
o R 10000 ohms
n R 20000 ohms
0) Cn
o 1
-C
0.1
1000
10 100 1000
Pulse duration (m,$)
Figure .8: Load delivered hy the electrodes B and B'
calculated using the 5-pole model, with respect to the pulse duration when
several values of Cl (top, R1=2 kohms), or RI (bottom, C1=100 nF) are used
(E=3.35 volts, R(E) = 1 kohm).
49
. 0
c
· y
0.5
0.0
Ol
o
O
C`4 --0.5
1.5
--1.0
10
100
1000
R = 1000
· 2000
R = 5000
· = 10000
· 20000
10 100
Pulse duration (gs)
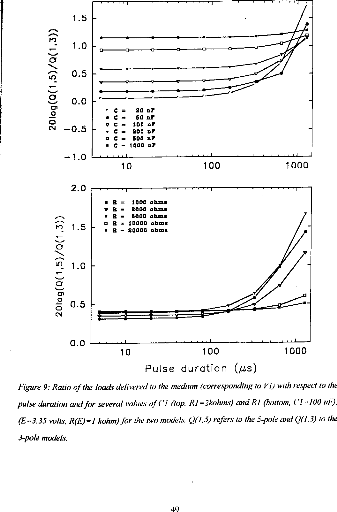
Figure 9: Ratio of the loach delivered 10 the medium
(corresponding to VI) with respect to the pulse duration and for several values
of CI (top, RI =2kohms) and RI (bottom, (' I 100 id), (E=3.35 volts, R(E) = I
kohm) for the two models. Q(1, S) refers to the 5-pole and 0(1,3)10 the 3-pole
models.
|
2.0
|
|
ri,
|
1.5
|
|
1.11
|
1.0
|
|
rn
|
|
|
0
|
0.5
|
|
0.0
|
Discussion
Comparison of the two models
The comparison of the results given by the
two models showed a high similitude for the shape and values of the charges
delivered by the DIGISONIC DX10 cochlear implant when the excitation pulse was
shorter than 320 gs. When the decimal logarithm was equal to 1, the ratio of
charges was 1.12, which is practically equivalent to 1. This could mean that
the excitation path is very short and does not spread throughout the
electrodes. Consequently, a 3-pole circuit appears adequate to provide a good
model of the stimulation. At least, a 5-pole model did not lead to different
results. A special non-symmetrical model needs to be established for the side
electrodes (1 and 15).
Influence of the physiological medium impedance
The shape of the response was significantly influenced by the
impedance of the physiological medium between two electrodes. In this case, it
seemed that information about the status of the active electrode couid only be
obtained by considering the surface potentials in cochlear implantees (Mens et
al, 1994; Gallégo et al, 1997). Surface potentials were potential
differences recorded between surface electrodes situated on the skin. They were
produced by the electrical action of the implant electrodes. They couid be
interpreted by the action of a stimulation dipole situated on the line
connecting the recording electrodes.
One application could be to help set the liminar and comfort
thresholds on each electrode. The more ossified the cochlea, the higher the
impedance. Consequently, in the case of ossification, an increase of the
liminar thresholds and a reduction of the electrical dynamic couid be seen. If
we consider figure 6a, it can be seen that the offset time, from the peak to
the baseline, is a function of the impedance, which consequently could be
evaluated.
Choice of the skin electrodes
If the line connecting the two skin electrodes, E 1
and E2 is orthogonal to the dipole, the action of the dipole is the same on El
and E2. Consequently the potential difference is null. In all other cases, this
potential difference is not equal to zero (fig 10).
Dipole
Figure 10 : Schematic representation of the skin
electrodes relative to an exciting dipole.
Influence of pulse duration
Figure 11 shows a typical surface potential. Waveform is
modified by the bandpass of an analog filter on the recording system (10-3000
Hz).
100 80 60 40 20 0
ce --20
--40 -
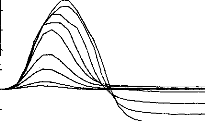
Figure 11: Surface potentials VE1-VE2 recorded on
a cochlear implant subject with regard to pulse duration (1=5, 9, 22, 34, 60,
86, 137, 188, 239 ps).
|
0 0 0.1 0.2 0.3 0.4 0.5 0.6
Time (ms)
|
0.7 0.8 0.9 1 0
|
The amount of charge delivered by the implant grew
linearly with the duration of the pulse. It has been shown (Shannon, 1992) that
an increase in perceived volume is proportional to the electrical charge
delivered to the medium between two electrodes. It has also been established,
with normal hearing people, that the perceived volume is in proportion to the
acoustic stimulation given in decibels. In other words, the stimulation growth
should be proportional to the duration of the pulse. Following these
considerations a logarithmic compression of the acoustical pressure could be
converted to a pulse duration. The introduction of condensers did
not increase the difficulty of evaluating the charge
delivered by the electrodes. The maximum
charge delivered by an electrode is, according to figures 7
&8, less than 1 giC. The surface of the electrode is about
one square millimetre, and the charge density in the tissue is less than 1
itC/mm2. These charges remain well below the safety limit
established in order to assure the integrity of the physiological tissues
(40iic per square millimetre and per cycle).
Further developments of the model
Considering the remote action (on the skin) of electrical
stimulation seen so far, this model may be considered as a first step toward a
more complete one. The next step in this modelling would be to extend the
models to 'in vitro' and 'in vivo' situations (figure 10), with corresponding
measurements. This would help the localisation of the stimulation on the
cochlea, the assessment of the quality of the implanted device and the
measurement of the electrode impedances.
In our model, the system was even more complicated by the fact
that two dipoles must be considered when the stimulation is symmetrical (in the
3-pole or the 5-pole representation). This situation will be considered in a
further step of the modelling.
Conclusion
The present study shows that a 3-pole model
provides an adequate means of representing the electrical stimulation delivered
by a cochlear implant used in a common ground mode. The extension to a 5-pole
model did not really change the results.
The influence of the medium resistance modified the shape of
the stimulation. Consequently, the knowledge of the impulse response indicates
the status of the medium, mostly in the case of ossification. The recording of
the electrical response produced by a pulse indicates also the amount of
electricity delivered between two electrodes. The relation is non linear and
the shape has to be seen to evaluate the magnitude of the stimulation.
The next step would be to use this 3-pole model in order to
simulate the surface potentials on
the skin. The relation between the
prediction and the observed values will determine the power
of the model, model which is of the utmost importance to
establish the cochlear implant working mode and the status of the physiological
medium surrounding the electrodes.
Acknowledgments
The authors acknowledge the people and institutions supporting
their work: the MXM society, the Hospices Civils of Lyon, the CNRS, the
University of Lyon and Professor Lionel Collet Director of the laboratory.
References
- Beliaeff M., Dubus P., Leveau J.M., Repetto J.C., Vincent P.
Sound Processing and Stimulation coding of DIGISONIC DX10 15-channel Cochlear
Implant. Advances in cochlear implant, Ed. IN Hochmair (Innsbruck).
1994;198-203.
- Black R, Clark G, Tong Y, Patrick J. Current distributions in
cochlear stimulation. Ann NY Acad Sci, 1983, 405, 137-145.
- Fravel R. Cochlear implant electronics made simple. Otolaryngol
Clin North Am, 1986, 19, 11-22.
- Gallégo S, Truy E, Morgon A, Collet L. EABRs and surface
potentials with a transcutaneous
multielectrode cochlear implant. Acta Otolaryngol (Stockh), 1997,
117 (in press).
· - Mens LHM, Oostendorp T, Broek P van den.
Identification Electrode Failures with Cochlear
Generated Surface Potentials. Ear Hear 1994;15, 330-338.
- O'Leary S, Black R, Clark G. Current distributions in cat
cochlea: a modelling and electrophysiological study. Hear Res, 1985, 18,
273-281.
- Shannon R. Multichannel electrical stimulation of the auditory
nerve in man. I. Basic psychophysics. Hear Res, 1983, 11, 157-189.
- Townshend B, Cotter N, Van Compernolle D, White R. Pitch
perception by cochlear implant subjects. J Acoust Soc Am, 1987, 82, 106-115.
53
| 

