|
COLLEGE OF EUROPE BRUGES CAMPUS European Economic Studies
Impact of Eco-innovation on firms'
competitiveness
An Empirical study based on Mannheim
Innovation Panel
Thesis presented by Abdelfettah BITAT
Supervisor: Klaus RENNINGS
for the
Degree of Master of Arts in European Economic Studies
Specialisation: European Economic Integration and Business
Statutory Declaration
I hereby declare that this thesis has been written by myself
without any external unauthorised help, that it has been neither presented to
any institution for evaluation nor previously published in its entirety or in
parts. Any parts, words or ideas, of the thesis, however limited, and including
tables, graphs, maps etc., which are quoted from or based on other sources,
have been acknowledged as such without exception.
Moreover, I have also taken note and accepted the College rules
with regard to plagiarism (Section 4.2 of the College study regulations).
<10 120 word>
Abstract
Environmental issues have become of prime importance nowadays
so that they are a recurrent subject at the table of the world's most powerful
committees. Hence, the relationship between environmental regulation,
eco-innovation and firms' competitiveness has always been equivocal. The
concerned groups of interest all claim to have the right argument without a
clear analytical proof. The present thesis will shed some light on one of the
most controversial hypothesis in the last couple of decades: the Porter
Hypothesis. In fact, Harvard Business School Professor Michael E. Porter wrote
a one page article in the beginning of 1990s claiming, against the current
trend in that time, that environmental regulation will actually trigger
eco-innovation (weak Porter hypothesis) which will in turn increase the
competitiveness of businesses (strong Porter hypothesis). Needless to say this
argument has been immediately captured by politician and environmentalists to
support stringent environmental regulation. At the same time several
counter-articles were published to refute the Porter Hypothesis claiming
metaphorically that there is no 10 dollars bill on the ground because if it was
there it would have been already picked up, referring to the idea that
businesses would not miss an opportunity to improve their competitiveness on
the basis of profit maximising paradigm. The current thesis will limit itself
to the empirical test of the strong Porter Hypothesis explaining the
relationship between eco-innovation and firms' competitiveness using Mannheim
Innovation Panel (MIP) part of the European Community Innovation Survey. The
Ordered Probit Model will test six different hypotheses to compare between
eco-innovative and non-innovative firms concerning the impact of each of access
to green market, environmentally friendly products differentiation,
eco-innovation technological rent, materials and energy efficiency, cost of
capital and labour productivity variables on the return on sales as an index of
competitiveness. The thesis is structured as follow: After the introduction,
section 2 will briefly define eco-innovation and its drivers and expose more
extensively a literature review on the Porter hypothesis, section 3 will setup
the theoretical foundations for each of the six hypotheses, while section 4 and
5 will describe and test the empirical model respectively. The empirical
results confirmed only partly the strong Porter hypothesis with an overall
positive effect of environmental innovation on return on sales whereas from the
six different sub-hypotheses only four were verified leading to a rejection of
the remaining ones, namely the green products differentiation and patent
stock.
Keywords
Eco-innovation
Porter hypothesis Competitiveness Environment
Ordered Probit Model
Table of Contents
Statutory Declaration ii
Abstract iii
Keywords iv
List of Tables vii
List of Figures viii
List of Abbreviations ix
1 Introduction 1
2 Literature review of the academic background
4
2.1 Introduction 4
2.2 Eco-innovation 4
2.2.1 Definition 4
2.2.2 Determinant for eco-innovation 5
2.3 The Porter hypothesis 6
2.3.1 The weak Porter hypothesis 7
2.3.2 The strong Porter Hypothesis 8
2.3.3 Critics of the Porter hypothesis 12
2.4 Conclusion 14
3 Hypotheses of the theoretical model 16
3.1 Better access to markets 16
3.2 Product differentiation 16
3.3 Technological rent 17
3.4 Cost of materials and energy 18
3.5 Cost of capital 18
3.6 Cost of labour 19
4 Empirical setting 21
4.1 Data description 21
4.2 Variable definitions 22
5 Empirical estimation 26
5.1 Estimation model 26
5.2 Empirical results 27
5.3 Model discussion 27
6 Conclusion 29
Bibliography 31
ANNEX I 35
ANNEX II 38
List of Tables
Dimensions of Environmental Innovation Distinguished in MIP 2009
...4
Variables definition 26
Probit Estimation 28
List of Figures
Spill-over effect of innovation 11
Schematic representation of the Porter hypothesis 12
List of Abbreviations
CIS Community Innovation Survey
ER Environmental Regulation
EU European Union
MIP Mannheim Innovation Panel
OECD Organisation for Economic Co-Operation and Development
PH Porter Hypothesis
R&D Research and Development
US United States of America
1 Introduction
Environmental issues are at the core of most of the economic
and political debates nowadays. The problem is so important that it has become
a recurrent subject of most of the world's top level committees such as the G8.
The current economic context has also brought to the table the discussion about
the competitiveness of the developed economies, with the businesses at their
core, and how governments may revive the comparative advantage of their
countries through well-designed regulation. All in all, one can notice that all
of these three aspects are linked one another in a certain way. Intuitively,
the starting point would be that the governments would intervene via the
regulation in order to reduce the environmental externalities, but the matter
of businesses' competitiveness is not less of importance in the point of view
of politicians seeking democratic legitimacy. Moreover, the classical economic
mind-set of the market economies is that the government shall not intervene in
the private economic field unless the intervention is justified by a market
failure or for redistributional purpose. Interestingly enough, Professor
Michael E. Porter came, at the beginning of the 1990s, with a revolutionary
idea defying all preconceptions: `Environmental regulation will trigger
innovation and thus increase the competitiveness of businesses.' The idea was
absolutely astonishing for economists at that time and the politicians took
immediately this hypothesis as a chief argument to support more Environmental
Regulation (ER). Porter argued that even if the impact of stringent ER might be
«challenging for the national industry at the very beginning», the
long run result would be an enhanced competitive position at the global level
for innovative business developing new environmental technologies to improve
their products and processes (Blind, 2011). The Porter Hypothesis quickly
became a counterhypothesis to the existing paradigm which stipulates the ER
will necessarily impact negatively the business competitiveness as it bound the
innovative projects of the firms to a limited scope of activities, in this case
environmental issues, and thus, will only lead to supplementary costs.
Consequently, during the last two decades a vivid debate has
been raised opposing the two different perspectives. On one hand, the
ground-breaking view correlating ER is with enhanced competitiveness rather
than the traditional view of an adverse effect as a result of additional costs
imposed to the businesses, on the other hand. Many managers and analysts have
begun to convey the idea that it is imperative for companies to financially
care about the environment (Lanoie and Laplante, 1992), either to protect their
reputation or improve their access to capital markets. Beyond these indirect
effects, a growing number of examples
started to show that certain activities related to
environmental management can have a direct positive effect on the financial
situation of companies. In other words, some activities may be cost effective
and bring a "green return" while helping to protect the environment at the same
time.
In light of the preceding arguments, the objective of this
thesis is as simple as humble. Instead of analysing the Porter hypothesis as a
whole, the investigation will be limited only to the second part of the effect.
To put it differently, the hypothesis will be dismantled into two chains: the
first one is how ER may trigger eco-innovation and the second one is how
eco-innovation may improve firms' competitiveness. In this context, the main
problematic of current thesis will be:
Does eco-innovation impact positively the firms'
competitiveness?
To investigate this central problematic, several sub-questions
will be tackled in order to better understand how eco-innovative firms may
outperformer their non-innovative competitors. The following sub-questions will
be then addressed:
Do eco-innovative firms have access to more markets than their
competitors?
Does green product differentiation explain a higher return for
firms investing in ecoinnovation?
Do they benefit from innovation by trading their new technologies
in the environmental innovation market?
Is the cost efficiency for materials and energy at the origin of
their competitive advantage? Do they have access to lower capital cost?
Do they enjoy a higher labour productivity?
As an a priori answer to the central questions, the following
general hypothesis will be formulated:
Eco-innovation does have a positive return on the competitiveness
of the companies. Following the same logic, the six sub-hypothesis are:
Eco-innovative firms have access to green markets compared to
their competitors. By differentiating their green products firms may apply a
higher mark-up.
The patent stock of green technologies represents a rent for
eco-innovative firms. Product and process eco-innovation diminish wasted inputs
and increase efficiency. Shareholders value the environmental implication of
the firms.
Thanks to a better commitment of the employees to the company's
value, the eco-innovative firm's labour-productivity is higher than its
competitors, ceteris paribus.
The methodology used to explore this subject is descriptive
and analytical with a literature review of some of the most important empirical
and academic works in the field. The test of the PH will be conducted via an
empirical model based on innovation data of German companies from the Mannheim
Innovation Panel, with an ordinal limited dependant variable model, more
precisely an Ordered Probit Model ideal for data collected via
surveys.1
Following the present introduction, section 2 will, after a
brief definition eco-innovation and its determinants, summarise the results of
some key empirical paper written by economic academia to either confirm or
refute the PH. Section 3 will setup the theoretical foundations for each of the
six hypotheses. Section 4 will present the dataset and define the variables
used for the empirical model. In section 5, the steps of the model building
will be exposed together with the empirical results and their discussion.
Finally, the conclusion will comprise a summary recalling the main results of
the thesis.
1 In this context I would like to thank very much
my academic supervisor Professor Klaus Rennings and my analytical supervisor
Professor Christian Rammer for all their valuable advice, their helpful
assistance and especially for giving me the opportunity to visit the ZEW and
have access to the Mannheim Innovation Panel (2009) without which the current
thesis could not have been conducted. Not to mention Professor Eric De Souza
for his econometric assistance and his availability.
2 Literature review of the academic background
2.1 Introduction
In the following section the key concepts for a thorough
understanding of the subject of the present thesis will be exposed. It will
start with a relatively short definition of ecoinnovation from three different
perspectives, followed by a discussion of the drivers of innovation in general
and eco-innovation in particular. Right after, the Porter Hypothesis (PH) will
be introduced. In order to have a better focus on the object of the thesis, the
PH will be dismantled, according to a common methodology in the literature,
into two main hypotheses: The `weak' PH and the `strong' PH. The former is
often, in its turn, decomposed into two hypotheses including a `narrow' one.
Since the main problematic is about the strong PH, a particular attention will
be given to this part with arguments for and against as well as an objective
critic of the PH as a whole.
2.2 Eco-innovation
2.2.1 Definition
Klemmer (1999) defined eco-innovations as all the
«techno-economic, organisational, social and institutional changes leading
to an improved quality of the environment». He made a clear distinction in
his article between end-of-pipe and integrated production techniques which may
concern either product or process innovation (Rennings, 2000). The conventional
comprehension of product innovations is, as articulated in the Manual of Oslo
(OECD/EUROSTAT, 2005), the innovation that may lead to novel products or
enhanced ones. Nevertheless, the scope of product eco-innovation includes the
application of known technologies for new utilisations or the investment in new
technologies in order to enhance current products with improved environmental
impact, for example products that need fewer inputs. Thus, the main difference
between environmental and conventional product innovation is that the former
abates the environmental problems. It is important to note that sometimes
businesses achieve product eco-innovations even without a clear purpose of
preventing environmental externalities. Consequently, product eco-innovation
is, before anything else, a wise business decision that associates cost cutting
strategy with environmental benefits (Triebswetter & Wackerbauer, 2008).
Kemp and Pearson (2008) suggested a more exhaustive definition
of eco-innovation with three main characteristics, namely the novelty, the aim
and the state of art compared to alternatives:
«Eco-innovation is the production, application or
exploitation of a good, service, production process, organizational structure,
or management or business method that is novel to the firm or user and which
results, throughout its life cycle, in a reduction of environmental risk,
pollution and the negative impacts of resources use (including energy use)
compared to relevant alternatives».
2.2.2 Determinant for eco-innovation
Determinants of innovation in general and eco-innovation in
particular are usually divided in the literature in two distinct components:
the supply side and demand side drivers. In case of the supply side, the
crucial importance of innovation for businesses is supposed to push mangers to
seize the opportunity to develop new technologies, and this is known as the
`technology push'. On the other hand, the demand for new products will force
the businesses to adapt themselves and innovate, this is known as the `demand
pull'. Likewise, the supply push and the demand pull are considered by the
evolutionary theory of innovation as the main drivers for innovation (Nelson
and Winter, 1977; Pavitt, 1984), as pointed out by Triebswetter &
Wackerbauer (2008):
«Already Schumpeter (1942) further differentiates the
innovation process according to market power. He assumes a positive
relationship between market power and innovation, suggesting that large firms
are more innovative than small ones. According to Schumpeter, monopolists are
more innovative because they enjoy superior access to capital, have better
possibilities to pool risks and can exploit economies of scale in maintaining
costly R&D structures.»
Other authors consider `technological opportunities' as a main
driver of innovation, meaning that if there is room to develop technologies not
yet discovered, businesses will immediately invest in innovation in order to
grasp this opportunity (Cohen and Levinthal, 1989) but only under minimum
conditions of intellectual protection as patents, privacy rights, etc.
Likewise, the first mover advantage, `learning curve effects', and economies of
scale (Dosi, 1988) or via regulation by created new demand for instance
constitute other important drivers for innovation.
Consequently, ER constitutes a relevant eco-innovation driver,
as suggested above; together with the push-pull effects of both market sides'
factors that encourage ecoinnovation (Kemp, 1993). Admittedly,
«profit-maximising firms will seek ways to reduce their production costs
for a given level and quality of output, including environmental aspects.»
(Triebswetter & Wackerbauer, 2008)
In fact, according to Türpitz (2004) ER has played a
great role in the development of eco-innovation and thusly reducing the
environmental externalities. Another research found that for proactive
innovative companies, the «anticipation of upcoming legislation is a
decisive factor for environmental innovations» (Rehfeld et al., 2004).
Krozer, (2002) argues that «none of the other drivers
(e.g. new technology, incentives, information or knowledge transfer) have been
found to be as significant as the legislative push for eco-innovations.»
Since, ER offers a «clear time lines and certainty of regulation»
which is much valued by managers. Clayton et al. (1999) came to the same
conclusion about the positive effect of ER on eco-innovation; however they
added that it should be adapted to the specific features of each industry.
Finally, Ashford (2002) pointed out the critical importance of the design of ER
(whether it is market-based or Command & Control) in order to limit the
trade-off between environmental protection and competitiveness.
2.3 The Porter hypothesis
According to Lundgren & Marklund (2010), the common
argument against strict ER is that companies are obliged to decrease
production, or shift capital investment to particular assets that might be less
productive. Therefore, both the level and the growth of the productivity might
be hindered, and consequently the competitive position of the firm and its
revenues. In other terms, the ER is not appreciated by managers since they
consider only the considerable incremental costs caused to their business.
Nonetheless, Michael Eugene Porter, Harvard Business School Professor, looked
critically into these arguments (Porter, 1991) and came to the conclusion that
«right kind stringent environmental regulation», such as market based
instruments i.e. «pollution taxes, tradable permits, and deposit-refund
schemes» (Porter and van der Linde. 1995, p. 111), might on the contrary
increase the competitiveness of businesses. This argument is known nowadays as
the Porter Hypothesis. This premise is detailed in the article written by
Porter with the collaboration of van der Linde (1995). The authors exposed as
their main argument the fact that the link between business's competitiveness
and ER must not be observed from a static point but rather for a dynamic one.
The dynamic understanding of this relationship allows figuring out the positive
impact on the performance of business through `over-time adjustments'. To put
it differently, firms must adapt themselves in order to comply with the ER by
incorporating process and technological innovation that that will enhance
business competitiveness. Henceforth, the profit increase may be so important
that the costs of compliance induced by the ER are
offset. In view of that, ER has an ultimate positive effect on
both the business through enhanced competitiveness and the society with less
environmental damages. This situation is commonly called the
«win-win» PH or the double dividend, furthermore, this
«win-win» situation is seen in the academic literature as the
«strong» Porter hypothesis. Likewise, the situation where ER will
stimulate only certain kinds of eco-innovations without a direct effect on the
competitiveness of the firm is presented as the «weak» Porter
Hypothesis (Jaffe and Palmer, 1997). A third version of the PH is the
«narrow» one; it stresses the fact that flexible ER is more likely to
achieve the expected results than command and control type of environmental
policies. (Lanoie, et al., 2011)
2.3.1 The weak Porter hypothesis
The neoliberal economic view is that economic agents (firms,
consumers) behave effectively under the rules the free market. Supply and
demand will determine the prices on each market which will send a signal to
economic agents so that they can take the right decisions. In fact, if the
market works perfectly, scare resources available to the company will be
allocated optimally (Lanoie & TANGUAY, 1999).
If this is the case then government intervention in economic
affairs is to be avoided since the market is efficient. Indeed, government
intervention will only be useful for redistributional activities or when
markets do not play well their role, in other words, in case of a market
failure (Lanoie & TANGUAY, 1999). This is precisely what happens in the
case of environmental externalities. In fact, one of the essential features of
the well-functioning of the markets is the existence of well-defined property
rights (Coase, 1960). Clearly, in case of environmental resources such as air
and water where property rights are very difficult to define, the governmental
intervention is necessary. Since, air and water belong to no one (and everyone
at the same time), the economic agents can use them at a zero cost, while the
actual cost for the whole society is far from being null. The polluters are
given the wrong incentives and, as they use these resources without paying for
their real cost, they intend to overuse them. Therefore, the market mechanisms
alone generate too much pollution compared to what is desirable or optimal.
Government intervention is legitimate in order to control pollution and reduces
it to a level that is tolerable. To do so, the regulator has an array of
instruments such as regulation or taxation that can ensure that the polluters
receive the right signal and face the true costs of the environmental
externalities that they cause (Lanoie & TANGUAY, 1999).
In light of this reasoning, the consideration of the
environmental externality and its internalisation is necessarily associated
with increased costs for companies that used to pollute without suffering any
consequences. The environmental protection is perceived as a trade-off between
those who desire stricter environmental standards and those who have to comply
with these norms, namely the businesses. The challenge is consequently to
balance the desires of society for a cleaner environment and the additional
costs imposed on firms.
2.3.2 The strong Porter Hypothesis
Brännlund and Lundgren (2009, p. 9) defined the strong PH
as the productivity gains induced by the ER so that the whole costs of
attaining it are, at least, compensated by the productivity increases. In this
context, it is relevant to point out that Porter (Porter, 1991; Porter and van
der Linde, 1995) has the credit of giving an approach that deviates from the
dominant design in those days. Porter's argument was that: appropriate
government environmental intervention can trigger innovations that can offset
the costs of compliance with the regulations. As a result of strict ER,
companies will reconsider their production process and will develop new
approaches to reduce the pollution while lowering their costs and / or
increasing their production. The possibility that regulation encourages
innovation imply that firms decisions are not always the optimal choices as
there is a high level of information imperfection and a certain inertia while
organisational opportunities and technologies are developed continuously. Thus
many innovation opportunities are overlooked by firms as their level of
awareness is limited. If ER stimulus to eco-innovation is sufficiently
important then ER would offer the possibility to improve environmental
conditions at zero cost or negative net costs by improving productivity.
Consequently, by stimulating innovation, ER may actually make businesses more
competitive. As an example, regulations on recycling products could lead to the
recovery of valuable materials more easily. Both consumers and producer could
then end up winners when disposing of the consumed product. (Lanoie &
TANGUAY, 1999)
Undoubtedly, such a view has received close attention from all
stakeholders who want stronger environmental policies, such as
environmentalists. If ER may be without costs or even with negative costs then
regulation is good for both the environment and the businesses.
Porter initially expressed his argument in a one-page article
(Porter 1991) and then extensively formulated it in a common article with van
der Linde (1995) and later on with Esty (1998). According to Porter (1991)
«strict environmental regulations do not inevitably
hinder competitive advantage against foreign rivals (p.
96)». And «... the environment-competitiveness debate has been framed
incorrectly (Porter & van der Linde 1995, p. 97)». The authors
emphasised the crucial role of innovations as their core argument. Wagner
(2004) indicated that: «In reality, one is faced with a dynamic
competition process, rather than a framework of static optimization.»
Because firms are «... currently in a transitional phase of industrial
history where companies are still inexperienced in dealing creatively with
environmental issues (Porter & van der Linde 1995, p. 99)», which
implies incomplete information and organisational inertia. Wagner (2004) adds:
«In such a situation properly designed regulation can have an influence on
the direction of innovation in that (Porter & van der Linde 1995, p.
99-100):
- It signals to firms resource inefficiencies and possibilities
for technological improvement;
- If focused on information provision, it can increase firms'
awareness for improvement potentials;
- It reduces the uncertainty of net paybacks from investments;
- It «... motivates innovation and progress» (Porter
& van der Linde 1995, p. 100);
- It provides a `level playing field' and is necessary in
situations with incomplete offsets.»
The idea underlying the reasoning of Porter is that pollution is
generally associated with resources and raw materials that are not fully
utilised or wasted energy.
«Pollution is the emission or discharge of a (harmful)
substance or energy form into the environment. Fundamentally, it is a
manifestation of economic waste and involves unnecessary, inefficient or
incomplete utilization of resources, or resources not used to generate their
highest value. In many cases, emissions are a sign of inefficiency and force a
firm to perform nonvalue-creating activities ... Innovation offsets will be
common because reducing pollution is often coincident with improving the
productivity with which resources are used.» (Porter and van der Linde,
1995, p. 98)
Thus there is room for innovation in order to prevent
pollution and reduce the waste. Specifically, Porter refers to two broad
categories of innovations. Firstly, process improvements when reducing
pollution is associated with higher productivity through material savings,
reduced energy needs and reduce costs of disposal; a typical example is to find
ways to use waste, scrap and residues as new combustion source. Secondly, there
are also gains to be made at products level where reducing pollution is
accompanied by a design
product of higher quality, safer, cheaper, with more value for
the consumer or is less costly to the trash. (Lanoie & TANGUAY, 1999)
The academic research conducted by Sinclair-Desgagné
and Gabel (Sinclair-Desgagné 1999; Gabel & Sinclair-Desgagné
2001; 1993) came to a similar conclusion, they considered in fact ER as
«... an industrial policy instrument aimed at increasing the
competitiveness of firms, the underlying rationale for this statement being
that well- designed environmental regulation could force firms to seek
innovations that would turn out to be both privately and socially profitable
(Sinclair-Desgagné 1999, p. 2)». Moreover they proposed a number of
conclusions such as «... [it is] inconsistent, albeit convenient, to
assume that markets are flawed but that firms are perfect (Gabel &
Sinclair-Desgangé 2001, p. 149)». Another conclusion was that
although «standard neoclassical-economics models do not support the
systematic presence of low-hanging fruits (Sinclair-Desgagné 1999, p.
3)» the authors indicated that «[I]nnovation itself is not free, and
if one prices managerial time and all other in puts correctly at their
opportunity costs, it should become clear that putting stronger environmental
requirements on polluting firms generally increases their production cost more
than their revenue (Sinclair-Desgagné 1999, p. 2)». Ambec and Barla
(2006) observed that the management tend to be `present-biased' and may delay
investment in costly assets even if they may be productive («low-hanging
fruits»):
«Because the cost of innovating is for «now»
while the benefit is «later,» a present-biased manager will tend to
postpone any investments in innovation. By making those investments more
profitable or requiring them, environmental regulations help the manager
overcome this self-control problem, which enhances firm profits» (Ambec,
et al., 2010).
In addition, according Gabel & Sinclair-Desgangé
(2001) «[It] is logically most likely in situations where the firm is far
from the efficiency frontier, where the burden of the compliance cost is light,
and where the shift to the frontier can be made cheaply» (p. 152).
Finally, Xepapadeas & de Zeeuw (1999) concluded that «basic argument
nevertheless remains the X-efficiency argument that external shocks caused by
stringent environmental regulations may reduce inefficiencies and failure
within the firm».
Another way to look at the situation is to suppose that
businesses might operate under their potential because of bad management and
lack of perfect information. A clear definition of property rights (Coase,
1960) with regulation to limit information asymmetries (Akerlof, 1970), may
lead to Porter's the win-win or positive sum game with Pareto
improvement. In practice, however, regulation usually has been
associated with decreased competitiveness, deterring innovative activities
(Cerin, 2006).
Ambec and Barla (2007) explain, through a game theory
application, the spill-over effect of R&D investment that justifies the
Porter hypothesis. Consider two firms with the same technology and each with a
monopoly on two separate markets. They get a profit of ðp. Each
firm must decide whether to invest in research and development (R&D) to
achieve a more productive and cleaner technology that allows it to achieve a
gross profit of ðV with ðV >ðp. The cost
of developing this new technology is I. Consider the extreme case where the
spill-over is complete so that a company has a perfect access to results of
another firm at no cost. In other words, innovation is a public good. A company
can have access to new technology at no cost if its competitor invests in the
project. If the two companies perform R & D investment that each should
I/2. The game is represented by the following matrix:
Spill-over effect of innovation
Firm 2 No R&D R&D
Firm 1 NoR&D
R&D
ðp, ðp
|
ðv, ðv -I
|
|
ðv -I , ðv
|
ðv -I/2, ðv -I/2
|
Figure1: Ambec and Barla (2007)
So if ðv-I <ðp but
ðv-I/ 2> ðp, then this is exactly the
situation of the so-called classic `prisoner's dilemma': the Nash equilibrium
is `no firm invests' while if they could cooperate, both would benefit from the
jointly developed the new green technology. Environmental regulation as a
standard that forces the adoption of new technology could therefore benefit
both players. Other environmental regulations a priori costly for the company
such that a carbon tax or a system of emission permits would lead to the Nash
equilibrium where both firms invest in R&D. They save on the costs of
R&D spill-over, the new technology requires an investment of individual
I/2. Their final gain is ðv-I/2, greater than the gain before
regulatory Nash equilibrium ðp. (Ambec & Barla, 2007)
Schematic representation of the Porter hypothesis
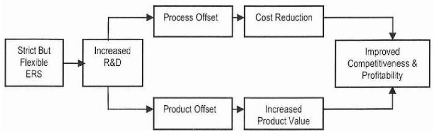
Figure2: Ambec & Barla, (2006)
2.3.3 Critics of the Porter hypothesis
The controversy around Porter's hypothesis has animated
several debates among economics academia. The motives are different: Firstly,
the questioning of the basic paradigm that the firms maximise their profit
under free market condition with no need to any supplementary restraints,
otherwise these constraints will rather increase their costs and consequently
impact their competitiveness negatively. Secondly, the lack of analytical proof
in Porter's work based on case studies of some companies in selected sectors,
which does not allow for generalising. «Is it really in all areas that the
`profitability green' is possible?» According to Palmer et al. (1995),
before concluding that more stringent ER has to be applied, one should first
answer the previous question. Thirdly, the governmental intervention in the
private sector is subject of a debate among economic researchers in order to
identify business opportunities. For Palmer et al. (1995) «if
opportunities exist, the state does not have to intervene to encourage
companies to identify them, they will do it for themselves given that firms are
aware of systematic improvements production process or technology». Many
researchers agree that ER may trigger eco-innovations; however this case would
be «the exception rather than the rule». Thus, even if businesses may
overlook new cleaner and cheaper processes, it is dubious that regulators are
better capable to assess the innovative potential than company management.
In the same vein, while defining competitiveness broadly,
Jaffe et al. (1995) have identified one hundred studies on the effects of
environmental regulations on competitiveness. There is little empirical
evidence that supports the hypothesis that the regulation has had an adverse
effect on the competitiveness of firms. If the long-term costs of regulations
can be high, including high costs on productivity, studies measuring the
effects of regulation on net exports, trade flows and the
decisions (re) location of firms have produced estimates that are generally
insignificant. The reasons given by economists have little to do with
compensating innovations. Except for the most polluting industries, the costs
of the environmental regulatory compliance represent a small proportion of
total costs. Moreover, firms seem reluctant to (re) locate for reasons of
environmental standards. (Lanoie & TANGUAY, 1999)
Similarly, the relationship between ER and competitiveness has
been largely debated among academics. Fundamentally, two main visions are
opposed concerning this link between competitiveness and ER. On one hand, the
traditional school which main concern is the possible negative effect that
would have a governmental intervention on productivity and competitiveness of
private economic agents (Palmer et al., 1995). On the other hand, the defenders
of the `win-win' situation generated by the ER as a stimulus for
eco-innovation, leading ultimately to both a decrease in environmental
externalities and a boost of business productivity (Porter and van der Linde,
1995). Several empirical analyses have been conducted to show the
dissimilarities between the two views. The empirical results concerning the
test of PH on the link between ER and competitiveness are quite equivocal. The
most influential articles found in the literature would be «Stewart,
(1993); Gray and Shadbegian, (1995); Repetto, (1995); Boyd and McClelland,
(1999); Wagner, (2004), King and Lennox, (2002); Sharma and Arragon-Correa,
(2005)» (Triebswetter & Wackerbauer, 2008). However, a strong
empirical support of PH is hardly found (Murty and Kumar, 2001).
Another argument against the PH is brought by Simpson &
Bradford III (1996), showing that typically stricter ER leads will not enhanced
firms' competitiveness because it governmental intervention will rarely trigger
the right eco-innovation. They add: «... it is by no means clear that the
benefits will repay the investment in the necessary innovation ... innovation
as the mechanism by which stringent environmental regulation is translated into
long-run competitive advantage (Simpson & Bradford III 1996, p. 283)».
They justify their analysis on the basis of incremental costs, assuming that in
order for a firm to improve its competitive position it has to decrease its
marginal costs but they found that regulation would rather increase the
marginal costs on what they called «direct effect», while the
indirect effect would be a decrease in variable costs «and thus marginal
costs through innovation». They made the assumption that«...the
government's objective is to maximise a domestic firm's profits net of the
(presumed) environmental externalities it imposes (Simpson & Bradford III
1996, p. 283)». The authors came to the conclusion that even if «it
is possible to develop a model in which effluent taxes in excess of marginal
external
damages are optimal (Simpson & Bradford III 1996, p.
284)» it will not be easy to define the right design for ER so that it
will trigger eco-innovation, and if so it will be valid only for some specific
situations and therefore it may create collateral disadvantages for other
industries for instance. Henceforth, «even if tougher environmental
regulations did serve to enhance competitive advantage, the same objective
might be achieved more effectively by more direct and conventional policies
(Simpson & Bradford III 1996, p. 284)», consequently
«...tightening regulation to induce advantage may be extremely dubious as
practical policy advice (Simpson & Bradford III 1996, p. 284)».
Another major critic addressed to the PH by its opponents is
the (implicit) assumption of overlook opportunity to `voluntarily' enhance
their competitiveness through environmental innovation. The metaphor used is
that there is no «10-Dollar bill on the ground because if it was there,
somebody else would have picked it up already» (Wagner, 2004). The other
questionable assumption is the one arguing that the governmental regulator is
more able to define the most effective ER in order to encourage eco-innovation
without negative impact on firms' competitiveness. In the same context, other
economists challenged the PH by the assumption of profit maximisation and the
other metaphor of the "low hanging fruit", arguing that if it was any
opportunity for firms to increase their profit there is no need for regulation
since the economic agents are rational (Wagner, 2004).
According to Palmer & al. (1995), even if RE may
eventually increase the competitiveness of businesses through eco-innovations
«these cases would be the exception rather than the rule». They argue
that the return of R&D investment is hardly determined «ex-ante»;
«it may be that, by chance, a company is equipped with technology that ex
post turned out to be profitable». They added that Porter and van der
Linde procedure of listing some "success stories" is far from proving the
presence of a «systematic link between ER positive and
profitability». In this context, Palmer & al. (1995) concluded that
«one could equally find cases where firms have seen their costs and
increase their profits shrink». (Ambec & Barla, 2006)
2.4 Conclusion
To close this section, a brief recall of different points
exposed seems relevant. In fact the first subsection made the difference
between product eco-innovation and process ecoinnovation with a clear
definition of both of them. Secondly, the different drivers of ecoinnovation
were detailed including the so-called push/pull effect of the both sides of the
market for environmental innovation. Finally, the part concerning the PH
touched to its the
different configuration, namely the weak PH with a clear
impact of environmental regulation on eco-innovation (which is somehow a must
happen effect since one would certainly expect firms to adapt if they have to
comply with compulsory standards), the narrow PH with a distinction of the
effects on innovation depending on the design of the environmental regulation,
and finally the strong PH, subject of the current thesis, where no robust
conclusions could be drawn since the results were varying so much from one
study to another. This may also be due to the difficulty to measure empirically
the strictness of the regulation and compare the gains with the compliance
costs to check the total or partial offset. At last, one of the major critics
to the PH remains the fact that the initial hypothesis relies on case studies
rather than empirical evidence which does not allow generalising.
3 Hypotheses of the theoretical model
3.1 Better access to markets
Improving environmental performance may facilitate access to
certain markets. In general, reducing pollution and other environmental impacts
can revive the image or the overall business prestige, thereby increasing
customer loyalty and supporting sales. In particular, if one wants to evaluate
the potential to reach more customers of green companies , it is useful to
scrutinise the policies of public and private organisations that are focusing
more on the environmental performance (or performance in terms of sustainable
development) as a purchasing criterion when selecting suppliers of goods and
services (demand pull). This phenomenon is also known as `buy green'. Many
companies now take into account in their purchasing decisions, considerations
related to social responsibility. Indeed, according to an OECD survey,
involving over 4000 facilities in seven different countries, 43% of these
latter evaluate the environmental performance of their suppliers (Lanoie, et
al., 2007).
The magnitude of the green public procurement is difficult to
assess, but it is clear that this phenomenon does exist. Also, in May 2001, the
Environment Ministers of the OECD countries have adopted an Environmental
Strategy for the first decade of the 21st century that contains a
recommendation to «improve the environmental performance of procurement
practices public.» It seems that by improving their environmental
performance, some companies have actually an easier access to certain markets.
At this stage, given that green procurement seems more present in the public
sector, the companies that are most the likely to benefit from it are those who
sell to the public organisations (construction, energy, transportation
equipment, medical products and office equipment). Taking into account this
theoretical background, one can formulate the following hypothesis:
H1: Firms investing in eco-innovation have a better access to
certain green markets compared to their conventional competitors.
3.2 Product differentiation
When companies decide to stand out by creating products and
services more environmentally friendly, they can hope that, in the future, it
will allow them to exploit lucrative niches within their industry and therefore
benefit from increased revenues and they can pass on the extra cost incurred to
customers willing to pay products or services more environmentally friendly.
Thus, Sinclair-Desgagné (2004, p. 6) writes that «many companies
(like McDonald's, Exxon, etc...) learned the hard way that
consumer loyalty to their products depends largely on the perception that they
are environmentally benign.» It is clear that consumer behaviour can have
a significant impact on sales. It appears that the differentiation strategy is
more likely to be effective if: 1) information about the environmental
attributes of the product is credible (e.g. eco-label), 2) consumers are
willing to pay and 3) innovation is protected from imitation by competitors.
Various examples suggest that a wide range of businesses can actually improve
their environmental performance and achieve higher incomes by using this
strategy. Even companies that produce goods rather homogeneous and usually
difficult to differentiate, such as agricultural products and energy, can also
achieve similar results (Lanoie, et al., 2007).Therefore, and after examining
this condition the following hypothesis may be stipulated:
H2: Eco-innovative firms have a higher return on sales since
they are able to differentiate themselves than other firms.
3.3 Technological rent
Resolution of environmental problems has become an important
business opportunity for companies specialising in this field. This is often
referred to as the `environmental industry'. The important aspect here is to
identify the situations where a company which wants to improve its
environmental performance has optimised its manufacturing or waste management
through the development of technologies for pollution control. This may lead to
the development of technologies that may eventually be sold to other firms.
Companies adopting such a strategy may also receive a benefit from being the
first player («first-mover advantage») and lobby governments in
favour of tighter regulation according to their higher and thus export their
eventual competitive disadvantage.
Since it is difficult to find examples of companies that have
benefited from technological opportunities as derivative trading, one would
assume that «the market of technology for pollution control» as a way
to turn an environmental problem in increasing revenue is not a widespread
phenomenon (Lanoie, et al., 2007). The only example would be the case of
companies which should already have research facilities, and many resources,
and eventually sell to other businesses the technology of pollution control
that they have developed for their own needs. In light of these findings, the
next hypothesis can be formulated as follow:
H3: Firms that invest in eco-innovation increase their
return on sales by selling their technologies to other firms.
3.4 Cost of materials and energy
Porter suggested that pollution is generally associated with
the waste of resources not fully utilised, or loss of energy (Porter 1991 and
Porter and van der Linde, 1995). He concludes that environmental policies both
more stringent and more flexible (e.g. taxes and tradable permits) would
benefit the economy, in a way that they stimulate innovations which will in
turn offset the costs of compliance with these policies. Similarly, Katz (2003)
shows, from a sample of 33 LEED (Leadership in Energy and Environmental Design)
certified green buildings that the financial benefits of green design reaches
more than 10 times the additional cost of environmentally friendly building. In
fact, the range of opportunities to reduce both pollution and energy costs of
equipment and services appear to be quite large. Over the past eight years,
Lanoie has collected more than 50 examples of firms that have succeeded in
reducing pollution as well as the costs of resources, energy and services. Such
opportunities are more likely to stand for companies whose production methods
are flexible and with effective means of communication in order to facilitate
the transmission of new ideas to decision makers. Furthermore, the likelihood
of success is greater for industries subject to fierce competition, hence the
cost reduction is more important in sectors where there are market based
environmental policies (for example, pollution taxes or tradable permits) to
trigger eco-innovation (Lanoie, et al., 2007). Subsequently, the next model
hypothesis is formulated this way:
H4: Eco-innovative firms increase their profit compared to
their non-innovative competitors by producing via more efficient
processes.
3.5 Cost of capital
According to Lanoie, & al. (2007) the capital lies at the
heart of any business. The funds needed to finance a new firm, its growth or
simply the continuation of its activities does not get easily and can be
costly. A company that maintains a positive environmental image may see its
task simplified in three distinct ways: access to green funds, the loan
facility from banks and improved performance in stock markets. Firstly, some
researchers in finance believe that the growing number of green (or ethical)
mutual funds had the effect of increasing the total funds available to
businesses that meet certain environmental criteria. In particular, investments
in U.S. funds subject to control socially rose by 258% between 1995 and 2005.
This exceeds the growth rate of other funds administered by professionals. In
France, the increase recorded was 92% between 2002 and 2006. Canada has also
increased sharply, investments from 65.5 to 500 billion dollars between 2004
and 2006. In 2005, about
10 dollars administered by professionals in the U.S., nearly $
1 (or 9.4%) was invested in a socially responsible fund. This percentage was
between 10 and 15% in Europe. In short, environmentally friendly companies have
access to a growing source of capital which reduces their cost of capital
compared to other similar firms. Secondly, companies that improve their
environmental performance can more easily get financed from banks. Given that
most of the major banks have now teams of experts in assessing the
environmental performance of potential borrowers and especially the potential
magnitude of responsibilities associated with contaminated resources. In
addition, some 40 international banks have adopted the "Equator Principles" in
order to ensure that the projects they fund are held in respect of the
environment, and 17 demonstrate appropriate practices of environmental
management. Thirdly, the shareholders in general may be influenced by
information related to the environmental performance of companies and their
reactions can be felt on the stock market. These movements can, in turn, affect
the cost of capital. Many empirical studies have attempted to identify the
stock market reaction to news about environmental performance. The literature
brings out three dominant approaches: a) portfolio analysis, b) the event
studies and c) the long-term studies using the regression analysis. The vast
majority of these studies indicate that better environmental performance is
associated with better stock market performance (at least, it is not worse).
Rising stock prices relative to the rest of the market may in turn reduce the
cost of capital. Companies listed on the Stock Exchange are more likely to
benefit from lower capital cost as a result of improved environmental
performance. In short, the following hypothesis will be examined
H5: By having access to cheaper capital, green innovative
firms increase their return on sale compared to other firms, ceteris
paribus.
3.6 Cost of labour
To be fully effective, a company must have a clear vision and
well-defined standards with ambitious goals. It would be difficult for any firm
to continue to operate if employees perceive that its products, processes and
objectives are harmful to mankind.
All point to conclusion that a better environmental
performance can reduce labour costs through lower sickness, absenteeism, staff
turnover, recruitment costs and improved productivity. Some analysts, like
Lankoski (2006), have used this argument in favour of reducing labour costs.
However, even if the argument is rather convincing, there is no direct
empirical evidence of this effect. To establish empirical evidence of cost
reductions related to a lesser degree of pollution, the dataset should reflect
the measurements of the costs of
labour, for example the rate of turnover and absenteeism, and
data on environmental performance. Intuitively, the type of companies that
could potentially cut labour costs by improving their environmental performance
would be: 1) those whose emissions may affect the health of their workers, 2)
those that seek to attract qualified workers, including scientists, engineers,
MBA and 3) those established in regions where sensitivity to environmental
concerns is more pronounced (Lanoie, et al., 2007). The last hypothesis of the
subsequent econometric model will be as follows:
H6: The eco-innovative firms will increase their return on
sales by both reducing their labour costs and increasing their productivity as
their employees as they are committed, compared to their competitors.
4 Empirical setting
4.1 Data description
The dataset used for the empirical model in the current thesis
is the German part of the Community Innovation Survey (CIS), also known as
Mannheim Innovation Panel (MIP). MIP is piloted by the Centre for European
Economic Research (Zentrum für Europäische Wirtschaftsforschung) in
Mannheim, on behalf of the German Federal Ministry of Education and Research.
It consists of a yearly mail survey, including an only response option.
Following the first contact by postal mail, if a firms does not answer it
receives a reminder by phone after six weeks with a second copy of the
questionnaire. After another six weeks, a second reminder follows. The sample
is constructed as a panel with lagged variables to allow the construction of
dynamic models. Considering the rather strict ER of Germany, the use of German
firms' data is ideal to test the PH (Rammer & Rexhauser, 2011).
The data used for the following model was collected in the
2009 MIP survey, particularly because it contains a set of relevant questions
on environmental innovations providing key variables for the model. Compared to
other CIS, the MIP has additional questions concerning firms' profitability and
other market structure information essential to build up a model with enough
control variables to avoid omitted variable bias (Rammer & Rexhauser,
2011).
The first wave in 1993 was only designed for the
manufacturing, mining, energy, water and construction sectors followed by
another wave in 1995 that included the service sector and more recently retail,
wholesale, telecommunication as well as consultancy firms. It is drawn from the
Creditreform database (a German credit-rating agency with the largest data base
on German firms) according to the following stratifying variables: firm size,
region, and industry. Every year the same set of firms are asked to participate
in the survey and to complete the questionnaire sent to them via mail. The
sample is updated every two years to account for exiting firms, newly founded
firms and firms that developed to satisfy the selection criteria of the sample.
Additionally a non-response analysis is performed via phone to check and
correct for non- response bias. The participation in the survey is voluntary
and the average response rate is about 25% (Vuong, 2011). According to Rammer
& Rexhauser (2011) «The survey adheres to the Oslo Manual which
provides guidelines for the definition, the classification and measurement of
innovation. The gross sample of the 2009 wave consists of 29,807 enterprises.
The sample is stratified by sector (56 sectors), size class (8 classes
according to the number of employees) and region (West Germany and East
Germany). The target population are enterprises with 5 or more
employees from most economic sectors excluding farming and forestry, hotels and
restaurants, public administration, health, education, and personal and
cultural services with German headquarters.»
In the 2009 wave the total number of companies that replied
with usable information was 7,657, equivalent of 26 % response rate which just
above the mean of similar for voluntary mail surveys of this scale in Germany
(Grimpe and Kaiser, 2010), especially because the questionnaire is considered
as relative long. The final sample is fairly representative of the gross one in
terms of sectoral composition and firms' size distribution of the whole German
companies' population. Rammer & Rexhauser (2011) provide more inside
information on the process of data collection and, eventually, how they
controlled to limit the «selection bias between responding and
non-responding firms in terms of their innovation status». To do so, they
conducted another non-response survey «surveying 4,829 enterprises by
telephone. This survey revealed a higher share of innovating firms among the
non- responding firms (63.1 %) compared to the net sample of responding firms
(54.3 %).» The sample size of the current model is 3,809 observations.
The main dissimilarity with several other CIS panel data sets
is the pattern of individual response. In fact, according to Peters (2008) MIP
«is not a typical unbalanced panel for which information on individuals is
available for a certain time period without gaps. Instead, one observes a lot
of firms which, for example, respond in a certain year but then refuse to
participate for one or more years, only to join in the survey again at a later
date. This means that the time span for firms under observation is marked with
gaps.» He further explains this phenomenon by the possible problem due to
link between firm closures and firms' innovation behaviour that could induce a
selection bias (Peters, 2008).
A last noteworthy drawback of the MIP is that the
eco-innovation data is collected each odd year and not every year.
4.2 Variable definitions
In order to measure profitability variable for the model, the
proxy chosen is the 2008 pre-tax returns on sales. The data was collected from
firms with seven ordered categories with determined thresholds.
The definition of the dependent variable is inspired from
Cearnitzki & Kraft (2008): The starting point will be from the well-known
profit equation:
Profit = Sales-Labour cost-Capital cost-Material cost ... (1)
Next step is to divide the two sides of the equation by sales in
order to get the profit margin:
|
fit _ Sales--Labou r c ost--Capital c ost--M aterial c
|
... (2)
|
|
|
If one considers the unit Marginal Cost (MC) is equal to the
Average Cost (AC) in the long run then the equation (2) may be written as
follow:
... (3)
p and q being respectively the price and the quantity of
output.
According to the authors the methodology followed is the price
cost-margin, they add «the capital costs have been subtracted and need not
to be taken into account by capital divided by sales as an explanatory variable
in the empirical model» (Cearnitzki & Kraft 2008).
To explain return on sales they propose concentration in the
industry and market share arguing that one would expect a greater return on
sales in market with high concentration since firms can price at high levels.
Moreover they expect firms with high market shares to be more efficient and
thus earn higher return on sales. This methodology returns to what was treated
previously in the theoretical part concerning the effect of ecoinnovation on
competitiveness. Therefore, Environmental Innovation (EI) will be considered as
the main explanatory variable and the model will test whether it has a positive
or negative impact on return on sales as an index of competitiveness.
To do so, the definition of the explanatory variable EI will
follow the same methodology as the one used by Rammer & Rexhauser (2011),
where the authors defined EI as «product, process, marketing or
organizational innovations that lead to a significant reduction of
environmental burdens.» Rammer & Rexhauser did not distinguish between
the ecoinnovations which aim explicitly to diminish the environmental
externalities and the ones that are rather «a by-product of
innovations». The definition includes the environmental benefits at both
the firm and consumer level. Also there is no distinction between the new
technologies developed by the firm that are absolutely novel for the market as
whole or only the new use of existing technology by the firm. They argue that
«the rationale behind this view of innovation is that firms can hardly
distinguish whether a new used abatement technology is novel to the whole
market or only novel to the firm.»
The MIP differentiates between 12 distinct environmental
innovations whereas the harmonised CIS survey contains only nine dimensions.
Rammer & Rexhauser (2011) determine which dimensions are processes
innovations and which ones are products innovations.
Dimensions of Environmental Innovation Distinguished in MIP
2009
|
DIMENSION OF ENVIRONMENTAL
BENEFITS
|
SHARE IN
SAMPLE
|
TYPE OF ENVIRONMENTAL
INNOVATION
|
|
EFFICIENCY
IMPROVING
|
EXTERNALITY REDUCING
|
|
PROCESS INNOVATION
|
|
Reduced material use per unit of output
|
35.12 %
|
X
|
|
|
Reduced energy use per unit of output
|
40.82 %
|
X
|
|
|
Reduced CO2 emissions
|
32.16 %
|
-
|
X
|
|
Reduced other air emissions
|
22.86 %
|
-
|
X
|
|
Reduced water pollution
|
22.13 %
|
-
|
X
|
|
Reduced soil pollution
|
14.36 %
|
-
|
X
|
|
Reduced noise burden
|
23.22 %
|
-
|
X
|
|
Replaced materials with less hazardous substitutes
|
22.90 %
|
-
|
X
|
|
Improved recycling of materials, water, waste
|
35.44 %
|
-
|
X
|
|
PRODUCT INNOVATION
|
|
Reduced energy use for the customer
|
35.21 %
|
X
|
|
|
Reduced air, water, soil, noise pollution
|
27.64 %
|
-
|
X
|
|
Improved recycling of product after use
|
23.59 %
|
-
|
X
|
Table1: (Rammer & Rexhauser, 2011)
The main independent variable EI is used according to the
definition of Rammer & Rexhauser (2011); They authors explain in their
article that the data was collected according to the rating of asked companies
on a four grade scale from no environmental benefit to high environmental
benefit. Also, they pointed out the relevance of the variable measuring for the
«expected impact of energy saving product innovation on
profitability». They added «Although external to the firm, energy
efficiency of products could be rewarded by the market since it directly
reduces user costs and therefore could lead to higher profitability.» For
this purpose a dummy variable is created the following table will further
explain the functioning mechanism of certain relevant variables for the model.
The same logic is followed to measure for environmental innovations introduced
during the past year. In order to inspect he hypotheses of the model the
authors created a dummy variable for any type of environmental innovations
which takes the value 1 if a firm introduced either resource efficiency or
externality reducing innovations. Additional control variables are introduced
for sector specific unobserved cross-sectional differences by including 21
two-digit sectoral
dummies (Rammer & Rexhauser, 2011). Finally, according to
Czarnitzki and Licht (2006) an East Germany dummy should be is included since
«this part of the country is characterised by specific economic and
institutional structures resulting from the transformation process, including a
high level public support».
Variables definition
|
INDEPENDENT
VARIABLE
|
DISCRIPTION
|
|
Ost
|
Firms from the `new' German Länder (former East Germany),
(0=Western Germany, 1=Eastern Germany).
|
|
Iages
|
Development of innovation expenditure in the current year
1=increase, 2=steady, 3=decrease, 4=not yet known, 5=not possible to say
|
|
Qual
|
Quality improvement by process innovations: yes=1/no=0
|
|
Wett5
|
Products of competitors can easily be substituted by products of
the firm
|
|
Rek
|
Average costs reduced thanks to process innovations; 0=no,
1=yes
|
|
Ziel9
|
To reduce materials and energy consumption: 0=no importance,
1=little to 3=great importance
|
|
Ziel4
|
To gain access to new markets: 0=no importance, 1=little to
3=great importance
|
|
Mneu
|
Proportion of total turnover from new or clearly improved
products
|
|
Iapgtz
|
Expenditure on product and process design as well as other
preproduction costs linked to innovation projects: 0=no, 1=yes
|
Table2: Adapted from The Mannheim Innovation Panel: Manufacturing
and Mining & Services (2008)
5 Empirical estimation
5.1 Estimation model
Return on sales is collected in MIP survey as scale from 0 to
8 with known cut off points. Ordered Probit Model is the most suited for this
kind of dependant variables. According to Greene (2009), the general model
would be as follows:
The dependent variable in Ordered Probit Model is observed this
way:
Y=1 if Y*?å1
Y=2 if å1<Y*?å2
Y=3 if å2<Y*?å3
...
Y=7 if å6<Y*
In this case Y represents return on sales (Umren) and the cut off
points would be:
0 = 1, 0% to < 2% = 2, 2% to < 4% = 3, 4% to < 7% = 4,
7% to < 10% = 5, 10% to < 15% = 6, 15% and more = 7, estimation not
possible = 8
Y=1 if Y*=0%
Y=2 if 0%<Y*=2%
Y=3 if 2%<Y*=4%
Y=4 if 4%<Y*=7%
Y=5 if 7%<Y*=10%
Y=6 if 10%<Y*=15%
Y=7 if 15 %< Y*
The six independent variables corresponding to each hypothesis
are:
The control variables with a relevant theoretical impact on
return on sales are:
Three different models, M, M1 and M2, will be tested. M
representing the baseline without distinction between eco-innovative firms and
non-innovative firms. M1 being the model for eco-innovative firms and M3 for
the non-innovative firms in order to answer the central problematic of the
thesis.
5.2 Empirical results
Probit Estimation
|
Independent variables
|
Model M
|
Model M1
|
Model M2
|
|
Environmental Innovation
|
0.0822593**
(0.0403479)
|
|
|
|
Market share
|
0.0775999***
|
0.0862508**
|
0.0743373**
|
|
(0.022197)
|
(0.029501)
|
(0.0349319)
|
|
Product differentiation
|
0.0098879
|
0.0501308
|
-0.0946248
|
|
(0.0507557)
|
(0.0605704)
|
(0.0958762)
|
|
Patent stock
|
-0.0457845
|
-0.0516562
|
-0.0376007
|
|
(0.0494725)
|
(0.061838)
|
(0.0841409)
|
|
Martials and energy
|
-0.0692138**
|
-.0523971*
|
-0.1110295
|
|
efficiency
|
(0.0236537)
|
(.0284859)
|
(0.0447996)
|
|
Cost of capital
|
-0.0735411**
|
-0.0505324*
|
-0.2062648 ***
|
|
(0.0255448)
|
(0.0280471)
|
(0.0620886)
|
|
Labour productivity
|
0.8199367***
|
0.9515969***
|
.7446644***
|
|
(0.0427542)
|
(0.0678447)
|
(0.0558337)
|
|
Observations
|
3500
|
1966
|
1534
|
|
Likelihood Ratio
|
646.98***
|
348.64***
|
338.73***
|
|
Pseudo R2
|
0.480
|
0.0463
|
0.0572
|
Table3: Author's own calculation.
5.3 Model discussion
The empirical estimation provides a useful analytical tool to
judge the validity or not of the initial hypotheses postulated in the
introduction of the current thesis concerning the impact on eco-innovation on
firms' competitiveness with an insight of the key differences between
eco-innovative firms and non-innovative firms. The baseline model shows that
environmental innovation does have a significant positive effect
on return on sales which confirms the strong porter hypothesis.
The models M1 and M2 give more visibility of the key
differences between innovative and non-innovative firms in case of green
innovation, providing the reader with additional information concerning with
aspect of the eco-innovation does really explain a higher return on sales for
eco-innovative firms.
In fact, the higher return on sales of eco-innovative firms
compared to non-innovative firms is statistically explained by a greater
coefficient for market share, and labour productivity which confirms the two
hypotheses stipulated previously and lower additional cost (negative impact on
return on sales) in case of cost of capital and materiel and energy efficiency
(Porter justified it by that fact that the impact is actually dynamic rather
than static).
The coefficients of product differentiation, even if they are
not significant, they follow the same logic below with a positive effect for
eco-innovative firms and a negative one for other firms.
And lastly, the coefficient of patent stock has led to the
opposite conclusion but it is not statistically significant.
To put it differently, from the six initial hypotheses only
two were rejected and four confirmed. One may conclude that such results
support, even if only partly, the strong Porter hypothesis.
6 Conclusion
As a conclusion for the current Master thesis, it seems relevant
to recall briefly its content and the central problematic and the main
hypothesis tested:
Firstly, the section 2 allowed framing the subject of the
thesis by clearly defining eco-innovation, its determinants and its impact on
competitiveness through a relatively extensive literature review of the major
empirical works done in the field of the three versions of the Porter
hypothesis, namely the weak, the narrow and the strong one.
The conclusions drawn were not as precise as one would expect,
due primarily to technical limits such as measuring the stringency of
environmental regulation or the specificities of each economic context whether
sectoral, national or global.
Secondly, the hypotheses of the thesis were stipulated from
purely theoretical background and articulated in way that they could be tested
empirically. In this context, here is a reminder of the principal problematic
of the thesis:
Does eco-innovation impact positively the firms'
competitiveness?
More specifically, the model tested whether environmental
innovation (including process and product eco-innovation) has a positive impact
on return on sales as an index for competitiveness. The main hypothesis was
accepted with a significant positive coefficient in the first Ordered Probit
Model estimated.
The model was constructed on the basis of an wide theoretical
literature review which provided the essential assumption to define the
relevant independent variables, namely environmental innovation, market share,
product differentiation, patent stock, materials and energy efficiency, capital
intensity and labour productivity. Additional relevant control variables were
introduced to limit the omitted variable bias.
Among the six sub-hypotheses four of them were accepted and
only the two remaining rejected, mainly because the coefficients were not
statistically significantly different from zero which mean that the two models
were not statistically significantly different from each other.
Thus, one can finally conclude that the strong Porter hypothesis
was only partly confirmed and equally rejected, in respect of theoretical
hypotheses of the current study.
Perfectly aware of the limits of the present analysis, the author
justifies the formal errors by the limited time-frame and analytical resources.
Nevertheless, the originality of the
present paper resides in the fact that besides testing the
strong Porter hypothesis on verifying for the positive impact of eco-innovation
on firms' competitiveness, the analysis goes beyond by searching for the key
factors that differentiate the competitive position of ecoinnovative firms
compared to their non-innovative competitors. The preliminary results pending
further investigation confirmed three key factors that allows eco-innovative
firms to outperform their competitors, ceteris paribus, namely: access to green
market such as green public procurement, materials and energy efficiency
(Porter's main argument) and access to border sources of capital at a lower
cost either because stockholders valuate environmental implication of the firms
or by responding to the criteria of green mutual funds.
The author wants to encourage further research in this sense;
another way of approaching the subject is by using dynamic panel data since
Porter claims that the positive effect of environmental regulation on firms'
competitiveness cannot be detected in a static point of view. Furthermore,
including more hypotheses and additional dependent variables may increase the
explanatory power of the model in order to remedy to the problem of the weak
pseudo R2.
Finally, I want to achieve this thesis with the golden words
of the management Guru Peter Drucker who once said: «There are only two
important functions in business: marketing and innovation; everything else is
cost.» (Drucker, 1985) To show that the key of the success for every
business is to innovation according to its costumers' needs, and what the
coming generations most certainly need is a safe and sound environment to
prosper.
Bibliography
Akerlof, G., 1970. The market for lemons: quality uncertainty and
the market mechanism. Quarterly Journal of Economics, Issue 84, pp.
488-500.
Ambec, S. & Barla, P., 2006. Can Environmental Regulations be
Good for Business? An Assessment of the PorterHypothesis. Energy Studies
Review, 14(2).
Ambec, S. & Barla, P., 2007. Quand la
réglementation environnementale profite aux pollueurs Survol des
fondements théoriques de l'hypothèse de Porter, Laval: GREEN
working paper, Laval University.
Ambec, S., Cohen, M., Elgie, S. & Lanoie, P., 2010. The
porter hypothesis at 20:Can environmental regulation enhance innovation and
competitiveness?, Montreal, Canada: CIRANO Working Papers.
Ambec, S. & Lanoie, P., 2007. When and Why Does It Pay To Be
Green?. CIRANO Working Papers 2007s-20, CIRANO.
Ambec, S. & Lanoie, P., 2009. Performance environnementale et
économique de l'entreprise. Economie & Prévision,
Issue 190, pp. 71-94.
Ashford, N. A., 2002. Technology-focused regulatory
approaches for encouraging sustainable industrial transformations: beyond
green, beyond the dinosaurs and beyond evolutionary theory, Brussels:
Paper in the framework of the Blueprint Workshop on Instruments for Integrating
Environmental and Innovation Policy.
Blind, K., 2011. The Influence of Regulations on Innovation: A
Quantitative Assessment for OECD Countries. Policy Research, 41(12),
pp. 391-400.
Boyd, D. A. & McClelland, J. D., 1999. The impact of
environmental constraints on productivity improvement in integrated paper
plants. Journal of Environmental Economics and Management, Issue 38,
pp. 121-142.
Brännlund, R. & Lundgren, T., 2009. Environmental
policy without costs? A review of the Porter hypothesis. The International
Review of Environmental and Resource , 3(2), pp. 75- 117.
Cearnitzki, D. & Kraft, K., 2008. On the Profitability of
Innovative Assets, Mannheim: ZEW Discussion Paper No. 04-38.
Cerin, P., 2006. Bringing economic opportunity into line with
environmental influence: A discussion on the Coase theorem and the Porter and
van der Linde hypothesis. Ecological Economics, Issue 56 , pp. 209-225
.
Clayton, A., Spinardia, G. & Williams, R., 1999. Policies
for Cleaner Technology: a New Agenda for Government and Industry. London:
Earthscan.
Coase, R., 1960. The problem of social cost. The Journal of
Law and Economics, Issue 3, pp. 1-44.
Cohen, W. M. & Levinthal, D. A., 1989. Innovation and
learning: the two faces of R&D. The Economic Journal, Issue 99,
pp. 569-596.
CZARNITZKI, D. & LICHT, G., 2006. Additionality of Public
R&D Grants in a Transition Economy: The Case of Eastern Germany.
Economics of Transition, 14(1), pp. 101-131. Dosi, G., 1988. Sources,
procedures and microeconomic effects of innovation. Journal of Economic
Literature, 26(3), pp. 1120-1171.
Drucker, P. F., 1985. Innovation and Entrepreneurship
Practices and Principles. New York: Harper & Row.
Dufour, C., Lanoie, P. & Patry, M., 1998. Regulation and
Productivity. Journal of Productivity Analysis, pp. 233-247.
Esty, D. & Porter, M. E., 1998. Industrial ecology and
competitiveness: strategic implications for the firm. Journal of Industrial
Ecology, 2(1), pp. 35-43.
Gabel, H. L. & Sinclair-Desgagné, B., 1993. Managerial
incentives and environmental compliance. Journal of Environmental Economics
and Management, Issue 24, p. 229-240.
Gabel, H. L. & Sinclair-Desgagné, B., 2001. The firm,
its procedures and win-win environmental regulations. In: H. Folmer, L. H.
Gabel, S. Gerking & A. Rose, eds. Frontiers of Environmental Economics.
Cheltenham/Northampton: Edward Elgar.
Gray, W., 1987. The Cost of Regulation : OSHA, EPA and the
Productivity Slowdown. American Economic Review, pp. 998-1006.
Gray, W. B. & Shadbegian, R. J., 1995. Pollution
Abatement Costs, Regulation and Plant Level Productivity, Washington, DC:
National Bureau of Economic Research Working Paper 4994.
Greene, W. H., 2009. Econometric Analysis. 7th ed. New
Jersey: Prentice Hall Inc.
Jaffe, A. B. & Palmer, K., 1997. Environmental Regulation and
Innovation: A Panel Data Study. Review of Economics and Statistics,
79(4), pp. 610-619.
Jaffe, A. B., Peterson, S. R., Portney, P. R. & Stavins, R.
N., 1995. Environmental Regulationand the Competitiveness of U.S. Manufacturing
: What Does the Evidence Tell Us. Journal of Economic Literature, pp.
132-163.
Katz, G., 2003. The Costs and Financial Benefits of Green
Buildings, California: Sustainable Building Task Force.
Kemp, R., 1993. An economic analysis of cleaner technology:
theory and evidence. In: K. Fischer & J. Schot, eds. Environmental
Strategies for Industry,International Research Perspectives on Research Needs
and Policy Implications. Washington DC: Island, pp. 79- 113.
Kemp, R. & Pearson, P., 2008. Project about measuring
eco-innovation, Maastricht: Final report MEI .
King, A. & Lenox, M., 2001. Does it Really Pay to be
Green? An Empirical Study of Firm Environmental and Financial Performance.
The Journal of Industrial Ecology, pp. 105-117. Klemmer, P., 1999.
Innovation and Environment. Berlin: Analytica-Verlag.
Krozer, J., 2002. Environment and Innovations, PhD Thesis.
Groningen, The Netherlands: Rijksuniversiteit Groningen.
Lanoie, P. & Laplante, B., 1992. Des billets verts pour des
entreprises vertes. Gestion, pp. 41-47.
Lanoie, P., Ambec, S. & Scott, I., 2007. Des billets
verts pour des entreprises vertes?, Montreal, Canada: CIRANO.
Lanoie, P., Lucchetti, J., Johnstone, N. & Ambec, S., 2011.
Environmental Policy,innovation and Performance: New Insights on the Porter
Hypothesis. Journal of Economics and Management Strategy.
Lanoie, P. & TANGUAY, G. A., 1999. Dix exemples de
rentabilité financière liés à une saine gestion
environnementale. Revue Gestion, pp. 30-38.
Lundgren, T. & Marklund, P. O., 2010. Climate Policy and
Profit Efficiency, Umeå: Working paper No. 11, Centre for
Environmental and Resource Economics.
Murty, M. N. & Kumar, S., 2001. Win-Win Opportunities and
Environmental Regulation: Testing of Porter Hypothesis for Indian Manufacturing
Industries, Mimeo, India: Institute of Economic Growth, Delhi University
Enclave.
Nelson, R. R. & Winter, S. G., 1977. In search of useful
theory of innovation. Research Policy, Issue 6, p. 36-76.
OECD/EUROSTAT, 2005. Oslo Manual - Guidelines for Collecting
and Interpreting Innovation Data, Paris: s.n.
Organization for Economic Co-Operation and Development, 1993.
Environmental Policies and Industrial Competitiveness, Paris: OECD.
Palmer, K., Oates, W. E. & Portney, P. R., 1995. Tightening
Environmental Standards : The Benefit-Cost or the No-Cost Paradigm ?.
Journal of Economic Perspective, pp. 119-132. Pavitt, K., 1984.
Sectoral patterns of technical change: towards a taxonomy and a theory.
Research Policy, Volume 13, p. 343-373.
Peters, B., 2008. Innovation and firm performance: An
empirical investigation for German evidence, Mannheim: ZEW Discussion
Paper 04-73, ZEW.
Porter, M. E., 1991. America's Green Strategy 264, no. 4 (April
1991). Scientific American, 264(4), p. 168.
Porter, M. E. & van der Linde, C., 1995. Toward a New
Conception of the Environment-Competitiveness Relationship. The Journal of
Economic Perspectives, 9(4), pp. 97-118. Rammer, C. & Rexhauser, S.,
2011. Unmasking the Porter Hypothesis: Environmental Innovations and
Firm-Profitability, Mannheim: ZEW - Centre for European Economic Research
Discussion Paper No. 11-036..
Rehfeld, K., Rennings, K. & Ziegler, A., 2004. Integrated
Product Policy and Environmental Product Innovations: an Empirical Analysis,
Mannheim: ZEW Discussion Paper 04-71.
Rennings, K., 2000. Redefining innovation - eco-innovation
research and the contribution from ecological economics. Ecological
Economics, Issue 32, p. 319-332.
Repetto, R., 1995. Jobs, Competitiveness and Environmental
Regulation: What Are the Real Issues?, Washington, DC: World Resources
Institute.
Ryan, C., 2003. Learning from a decade (or so) of eco-design
experience, part I. Journal of Industrial Ecology, Issue 7, pp.
10-12.
Schumpeter, J. A., 1942. Capitalism, Socialism and Democracy.
New York: Harper. Sharma, S. & Aragon-Correa, A., 2005. A
Corporate Environmental Strategy and Competitive Advantage. Cheltenham:
Edward Elgar Publishing.
Simpson, D. & Bradford III, R., 1996. Taxing variable cost:
environmental regulation as industrial policy. Journal of Environmental
Economics and Management, Issue 30, pp. 282- 300.
Sinclair Desgagné, B., 2004. corporate strategies to
managing environmental risk. Série scientifique CIRANO.
Sinclair-Desgagné, B., 1999. Remarks on Environmental
Regulation, Firm Behavior and Innovation, Montreal, Canada: Working Paper
99s-20. Centre interuniversitaire de recherche en analyse des organisations
(CIRANO).
Stewart, R. B., 1993. Environmental regulation and international
competitiveness.. The Yale Law Journal, Issue 102, pp. 2039-2106.
The Mannheim Innovation Panel: Manufacturing and Mining &
Services, 2008. Guide to the survey's datasets for external users, 1993 to
2008 surveys. Mannheim: ZEW.
Triebswetter, U. & Wackerbauer, J., 2008. Integrated
Environmental Product Innovation and Impacts on Company Competitiveness: a Case
Study of the Automotive Industry in the Region of Munich. European
Environment, Issue 18, pp. 30-44.
Türpitz, K., 2004. The Determinants and Effects of
Environmental Product Innovations - An Analysis on the Basis of Case Studies,
Mannheim: ZEW Discussion Paper 04-02.
Vuong, V. A., 2011. R&D, Innovations and Productivity,
Ph.D Thesis, Pennsylvania : The Pennsylvania State University.
Wagner, M., 2004. The Porter Hypothesis Revisited: A
Literature Review of Theoretical Models and Empirical Tests, Lueneburg:
Centre for Sustainability Management, Chair of Corporate Environmental
Management, University of Lueneburg.
Xepapadeas, A. & de Zeeuw, A., 1999. Environmental policy and
competitiveness: The Porter hypothesis and the composition of capital.
Journal of Environment Economics and Management, Issue 37, pp.
165-182.
ZEW, 2009. Mannheim Innovation Panel (MIP). Mannheim,
Germany: ZEW.
ANNEX
ANNEX I
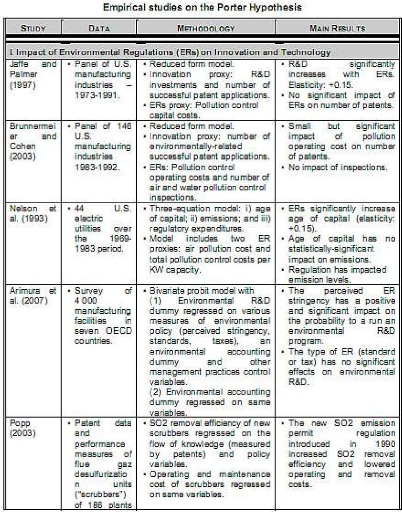
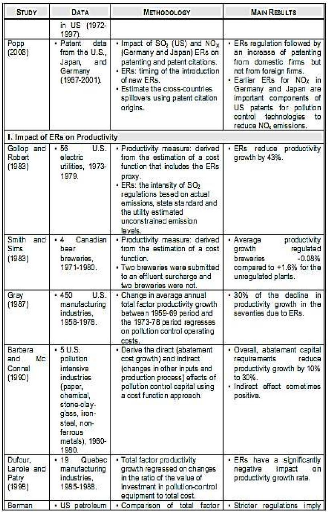
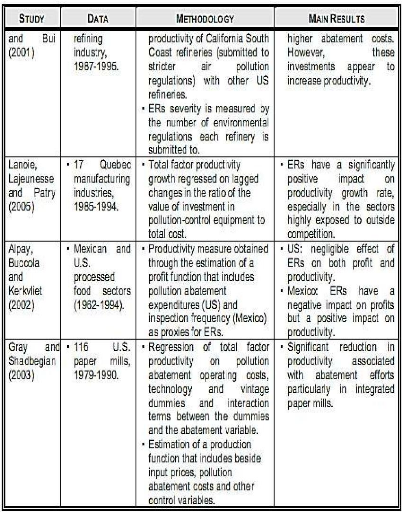
ANNEX II
Model estimation (M)
Model estimation (M1)
|
|
|
|
|
|
|
mneu
21 is
ood = od
d= hood = hood =
43
td
|
z ziel9
(natur
5052 .2173 .1871 1843 1843
z
|
nt lpro y coded;
Numbe LR ch Prob Pseud
P>|z|
|
wtt cs_1
obs
2
5 C
|
ages
ted
. Int
|
ugrup qua xd incs
|
|
8 0
|
29
|
0.003
|
.28
|
.1
|
|
|
8 06
|
0.8
|
0.408
|
0658
|
1
|
|
|
2 0
|
-08
|
0404
|
1785
|
.0
|
|
|
1 02
|
-1.8
|
0066
|
1022
|
0
|
|
|
4 02
|
-18
|
0072
|
050
|
.0
|
|
|
9 06
|
140
|
0.000
|
162
|
1
|
|
|
5 06
|
2.1
|
0.030
|
184
|
.2
|
|
|
4 02
|
-55
|
0.000
|
110
|
-.1
|
|
|
3 00
21
|
0.3
|
724
|
030
|
0
|
|
|
.05
|
2.0
|
0.039
|
|
|
12
|
|
.06
|
0.3
|
730
|
|
|
|
|
.05
|
-02
|
0.826
|
|
|
|
|
.17
|
-08
|
0.397
|
|
|
|
|
-0.8
|
0.415
|
|
|
|
|
.15
|
2.3
|
0.019
|
|
|
|
Model estimation (M2)
|
|
|
|
|
|
|
mneu
21 is
ood = od
d= hood = hood =
55
td
|
ziel9 (natur
.0389 5348 7407 6755 6755
z
|
nt lpro y coded;
Numbe LR ch Prob Pseud
P>|z|
|
wtt s_1
obs
2
5 C
|
ages
ted
. Int
|
ugrup qua xd incs
|
|
3 03
|
2.1
|
0.033
|
058
|
.1
|
|
|
8 09
|
-09
|
0.324
|
853
|
0.15
|
|
|
7 08
15
|
-0.4
|
0.655
|
051
|
.1
|
|
|
5 04
|
2.4
|
013
|
188
|
-
|
|
|
8 06
|
-33
|
0.001
|
295
|
-.0
|
|
|
4 05
|
133
|
0000
|
323
|
.8
|
|
|
7 11
|
05
|
553
|
555
|
.2
|
|
|
3 03
|
3.5
|
000
|
771
|
-0
|
|
|
2 00
21
|
10559
|
0.275
|
023
|
.0
|
|
|
.06
|
-0.2
|
0.826
|
|
|
|
|
.09
|
1.5
|
0.128
|
|
|
|
|
.06
|
1.9
|
0.055
|
|
|
|
|
.21
|
1.5
|
0.121
|
|
|
|
|
.22
|
1.7
|
0.080
|
|
|
3
|
|
.2
|
2.3
|
0.017
|
|
|
6
|
| 

