WOW !! MUCH LOVE ! SO WORLD PEACE !
Fond bitcoin pour l'amélioration du site: 1memzGeKS7CB3ECNkzSn2qHwxU6NZoJ8o
  Dogecoin (tips/pourboires): DCLoo9Dd4qECqpMLurdgGnaoqbftj16Nvp


Home | Publier un mémoire | Une page au hasard

 > 

crises financières et contagion: cas de subprime

( Télécharger le fichier original )
par zouari zeineb et hammami samir
IHEC Sousse - Maitrise en Actuariat et Finance 2008
  

précédent sommaire suivant

Bitcoin is a swarm of cyber hornets serving the goddess of wisdom, feeding on the fire of truth, exponentially growing ever smarter, faster, and stronger behind a wall of encrypted energy

ANNEXES

Statistiques descriptives

Test de stationnarité : test ADF

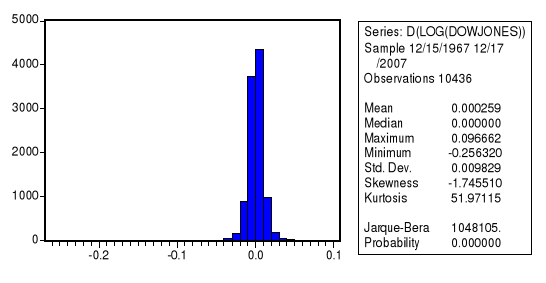
Null Hypothesis: LOG(DOW) has a unit root


Exogenous: Constant, Linear Trend


Lag Length: 2 (Automatic based on SIC, MAXLAG=2)


t-Statistic

  Prob.*


Augmented Dickey-Fuller test statistic

-2.441149

 0.3580

Test critical values:

1% level


-3.958914


5% level


-3.410233


Date: 03/25/08 Time: 11:07


Sample (adjusted): 12/20/1967 12/17/2007


Included observations: 10434 after adjustments


Variable

Coefficient

Std. Error

t-Statistic

Prob.  


LOG(DOW(-1))

-0.000789

0.000323

-2.441149

0.0147

D(LOG(DOW(-1)))

0.053757

0.009786

5.493515

0.0000

D(LOG(DOW(-2)))

-0.031709

0.009787

-3.240044

0.0012

C

0.004895

0.001987

2.463897

0.0138

@TREND(12/15/1967)

2.90E-07

1.09E-07

2.660624

0.0078


Null Hypothesis: D(LOG(DOW)) has a unit root


Exogenous: Constant


t-Statistic

  Prob.*


Augmented Dickey-Fuller test statistic

-24.38133

 0.0000

Test critical values:

1% level


-3.430803


5% level


-2.861625


Date: 03/25/08 Time: 11:41


Sample (adjusted): 1/10/1968 12/17/2007


Included observations: 10419 after adjustments


Variable

Coefficient

Std. Error

t-Statistic

Prob.  


C

0.000256

9.67E-05

2.641640

0.0083


Null Hypothesis: LOG(MDAX) has a unit root


Exogenous: None


Lag Length: 1 (Fixed)


t-Statistic

  Prob.*


Augmented Dickey-Fuller test statistic

 3.109105

 0.9996

Test critical values:

1% level


-2.565406


5% level


-1.940885


Dependent Variable: D(LOG(MDAX))


Method: Least Squares


Date: 03/25/08 Time: 11:52


Sample (adjusted): 1/01/1988 12/17/2007


Included observations: 5207 after adjustments


Variable

Coefficient

Std. Error

t-Statistic

Prob.  


LOG(MDAX(-1))

4.89E-05

1.57E-05

3.109105

0.0019

D(LOG(MDAX(-1)))

0.059925

0.013846

4.328000

0.0000


Null Hypothesis: D(LOG(MDAX)) has a unit root

Exogenous: Constant


Lag Length: 15 (Fixed)


t-Statistic

  Prob.*


Augmented Dickey-Fuller test statistic

-16.06369

 0.0000

Test critical values:

1% level


-3.431428


5% level


-2.861901


Date: 03/25/08 Time: 12:13


Sample (adjusted): 1/22/1988 12/17/2007


Included observations: 5192 after adjustments


Variable

Coefficient

Std. Error

t-Statistic

Prob.  


C

0.000348

0.000129

2.702353

0.0069


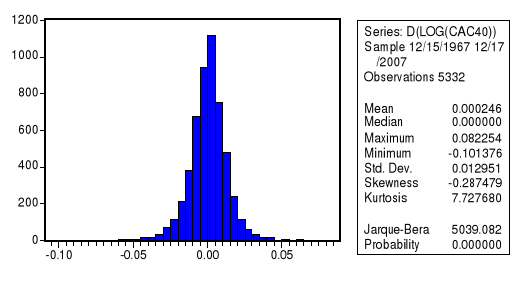
Null Hypothesis: LOG(CAC) has a unit root


Exogenous: None


Lag Length: 1 (Fixed)


t-Statistic

  Prob.*


Augmented Dickey-Fuller test statistic

 1.301714

 0.9517

Test critical values:

1% level


-2.565396


5% level


-1.940884


Date: 03/25/08 Time: 16:04


Sample (adjusted): 7/13/1987 12/17/2007


Included observations: 5331 after adjustments


Variable

Coefficient

Std. Error

t-Statistic

Prob.  


LOG(CAC(-1))

2.90E-05

2.23E-05

1.301714

0.1931

D(LOG(CAC(-1)))

0.015095

0.013699

1.101882

0.2706


Null Hypothesis: D(LOG(CAC)) has a unit root


Exogenous: None


Lag Length: 15 (Fixed)


t-Statistic

  Prob.*


Augmented Dickey-Fuller test statistic

-17.04505

 0.0000

Test critical values:

1% level


-2.565397


5% level


-1.940884


10% level


-1.616660


Date: 03/25/08 Time: 16:03


Sample (adjusted): 8/03/1987 12/17/2007


Included observations: 5316 after adjustments


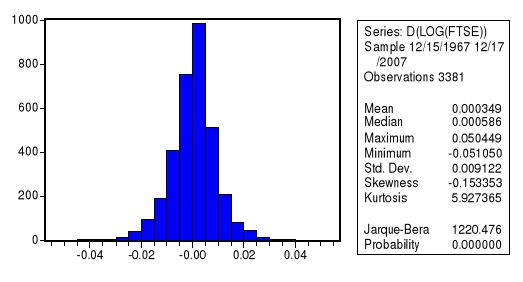
Null Hypothesis: LOG(FTSE) has a unit root


Exogenous: Constant


Lag Length: 1 (Fixed)


t-Statistic

  Prob.*


Augmented Dickey-Fuller test statistic

-2.269817

 0.1820

Test critical values:

1% level


-3.432097


5% level


-2.862197


Date: 03/25/08 Time: 19:06


Sample (adjusted): 1/03/1995 12/17/2007


Included observations: 3380 after adjustments


Variable

Coefficient

Std. Error

t-Statistic

Prob.  


LOG(FTSE(-1))

-0.001212

0.000534

-2.269817

0.0233

D(LOG(FTSE(-1)))

0.109198

0.017103

6.384664

0.0000

C

0.008407

0.003571

2.354485

0.0186


Null Hypothesis: D(LOG(FTSE)) has a unit root

Exogenous: Constant


Lag Length: 15 (Fixed)


t-Statistic

  Prob.*


Augmented Dickey-Fuller test statistic

-13.59434

 0.0000

Test critical values:

1% level


-3.432106


5% level


-2.862201


10% level


-2.567166


Date: 03/25/08 Time: 19:26


Sample (adjusted): 1/24/1995 12/17/2007


Included observations: 3365 after adjustments


Variable

Coefficient

Std. Error

t-Statistic

Prob.  


C

0.000328

0.000158

2.077054

0.0379


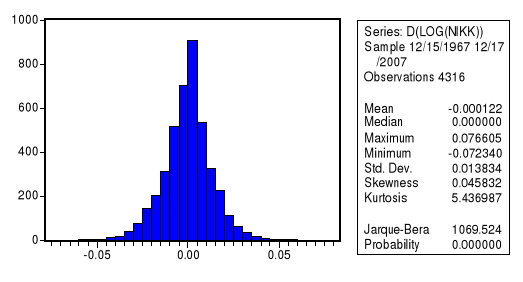
Null Hypothesis: LOG(NIKK) has a unit root


Exogenous: Constant


Lag Length: 2 (Fixed)


t-Statistic

  Prob.*


Augmented Dickey-Fuller test statistic

-2.148151

 0.2259

Test critical values:

1% level


-3.431682


5% level


-2.862014


10% level


-2.567065


Date: 03/25/08 Time: 19:16


Sample (adjusted): 6/05/1991 12/17/2007


Included observations: 4314 after adjustments


Variable

Coefficient

Std. Error

t-Statistic

Prob.  


LOG(NIKK(-1))

-0.001692

0.000788

-2.148151

0.0318

D(LOG(NIKK(-1)))

-0.032611

0.015218

-2.142883

0.0322

D(LOG(NIKK(-2)))

-0.034651

0.015217

-2.277067

0.0228

C

0.016198

0.007603

2.130523

0.0332


Null Hypothesis: D(LOG(NIKK)) has a unit root

Exogenous: None


Lag Length: 17 (Fixed)


t-Statistic

  Prob.*


Augmented Dickey-Fuller test statistic

-15.09390

 0.0000

Test critical values:

1% level


-2.565500


5% level


-1.940898


10% level


-1.616650


Date: 03/25/08 Time: 19:21


Sample (adjusted): 6/27/1991 12/17/2007


Included observations: 4298 after adjustments


Modèle VAR

VAR Lag Order Selection Criteria


Endogenous variables: LOG(DOW) LOG(CAC) LOG(MDAX) LOG(NIKK) LOG(FTSE) 


Date: 05/04/08 Time: 02:33


Sample: 12/15/1967 12/17/2007


Included observations: 3378


 Lag

LogL

LR

FPE

AIC

SC

HQ


0

 7674.940

NA 

 7.34e-09

-4.541113

-4.532047

-4.537871

1

 56738.78

 97953.38

 1.80e-21

-33.57536

-33.52096

-33.55591

2

 57229.55

 978.3573

 1.37e-21

-33.85113

 -33.75140*

-33.81547

3

 57282.13

 104.6506

 1.35e-21

-33.86745

-33.72240

 -33.81559*

4

 57311.12

  57.62619*

  1.34e-21*

 -33.86982*

-33.67943

-33.80175


 * indicates lag order selected by the criterion


Test de Johanson

Date: 04/16/08 Time: 23:15


Sample (adjusted): 1/05/1995 12/17/2007


Included observations: 3378 after adjustments


Series: LOG(DOW) LOG(CAC) LOG(MDAX) LOG(NIKK) LOG(FTSE) 

Lags interval (in first differences): 1 to 3


Unrestricted Cointegration Rank Test (Trace)


Hypothesized


Trace

0.05


No. of CE(s)

Eigenvalue

Statistic

Critical Value

Prob.**


None *

 0.008680

 77.66879

 76.97277

 0.0442

At most 1

 0.007136

 48.21862

 54.07904

 0.1503

At most 2

 0.003719

 24.02741

 35.19275

 0.4610

At most 3

 0.002424

 11.43993

 20.26184

 0.5003

At most 4

 0.000960

 3.243380

 9.164546

 0.5362


Modèle du modèle à correction des erreurs vectoriel

 Vector Error Correction Estimates


 Date: 05/04/08 Time: 02:36


 Sample (adjusted): 1/06/1995 12/17/2007


 Included observations: 3377 after adjustments


 Standard errors in ( ) & t-statistics in [ ]


Error Correction:

D(LOG(DOW))

D(LOG(CAC))

D(LOG(MDAX))

D(LOG(NIKK))

D(LOG(FTSE))


CointEq1

-0.010419

-0.008908

-0.000339

-0.000825

-0.009245


 (0.00236)

 (0.00292)

 (0.00201)

 (0.00295)

 (0.00208)


[-4.42333]

[-3.04839]

[-0.16812]

[-0.27989]

[-4.44568]


Modélisation ARMA

Dependent Variable: D(LOG(CAC))


Method: Least Squares


Date: 04/03/08 Time: 23:14


Variable

Coefficient

Std. Error

t-Statistic

Prob.  


C

0.000247

0.000167

1.485076

0.1376

AR(1)

0.695699

0.218390

3.185580

0.0015

MA(1)

-0.682641

0.218485

-3.124431

0.0018

MA(2)

-0.031566

0.014250

-2.215082

0.0268


R-squared

0.001225

    Mean dependent var

0.000245

Adjusted R-squared

0.000662

    S.D. dependent var

0.012952

S.E. of regression

0.012947

    Akaike info criterion

-5.855085

Sum squared resid

0.893000

    Schwarz criterion

-5.850147

Log likelihood

15610.73

    F-statistic

2.177278

Durbin-Watson stat

1.997988

    Prob(F-statistic)

0.088547


Dependent Variable: D(LOG(CAC))


Method: Least Squares


Date: 04/03/08 Time: 23:17


Variable

Coefficient

Std. Error

t-Statistic

Prob.  


C

0.000248

0.000166

1.492873

0.1355

AR(1)

0.726477

0.200030

3.631844

0.0003

AR(2)

-0.033764

0.014168

-2.383054

0.0172

MA(1)

-0.711826

0.199887

-3.561136

0.0004


R-squared

0.001342

    Mean dependent var

0.000245

Adjusted R-squared

0.000780

    S.D. dependent var

0.012953

S.E. of regression

0.012948

    Akaike info criterion

-5.855015

Sum squared resid

0.892895

    Schwarz criterion

-5.850076

Log likelihood

15607.61

    F-statistic

2.386231

Durbin-Watson stat

2.001364

    Prob(F-statistic)

0.067131


Dependent Variable: D(LOG(DOW))


Method: Least Squares


Date: 04/03/08 Time: 23:18


Variable

Coefficient

Std. Error

t-Statistic

Prob.  


C

0.000258

9.34E-05

2.765274

0.0057

AR(1)

0.716355

0.146850

4.878122

0.0000

AR(2)

-0.062078

0.010176

-6.100513

0.0000

MA(1)

-0.663828

0.146974

-4.516620

0.0000


R-squared

0.004082

    Mean dependent var

0.000259

Adjusted R-squared

0.003796

    S.D. dependent var

0.009830

S.E. of regression

0.009811

    Akaike info criterion

-6.410184

Sum squared resid

1.004005

    Schwarz criterion

-6.407403

Log likelihood

33445.93

    F-statistic

14.25131

Durbin-Watson stat

1.999011

    Prob(F-statistic)

0.000000


Dependent Variable: D(LOG(DOW))


Method: Least Squares


Date: 04/03/08 Time: 23:18


Variable

Coefficient

Std. Error

t-Statistic

Prob.  


C

0.000259

9.32E-05

2.774526

0.0055

AR(1)

0.674693

0.145744

4.629312

0.0000

MA(1)

-0.621502

0.145618

-4.268032

0.0000

MA(2)

-0.062989

0.010222

-6.161833

0.0000


R-squared

0.004128

    Mean dependent var

0.000259

Adjusted R-squared

0.003842

    S.D. dependent var

0.009829

S.E. of regression

0.009811

    Akaike info criterion

-6.410325

Sum squared resid

1.003960

    Schwarz criterion

-6.407545

Log likelihood

33449.87

    F-statistic

14.41310

Durbin-Watson stat

2.000318

    Prob(F-statistic)

0.000000


Dependent Variable: D(LOG(FTSE))


Method: Least Squares


Date: 04/03/08 Time: 23:19


Sample (adjusted): 1/03/1995 12/17/2007


Variable

Coefficient

Std. Error

t-Statistic

Prob.  


C

0.000352

0.000152

2.309437

0.0210

AR(1)

0.720484

0.162080

4.445243

0.0000

MA(1)

-0.612252

0.161609

-3.788475

0.0002

MA(2)

-0.114658

0.019465

-5.890439

0.0000


R-squared

0.015076

    Mean dependent var

0.000349

Adjusted R-squared

0.014201

    S.D. dependent var

0.009123

S.E. of regression

0.009058

    Akaike info criterion

-6.569147

Sum squared resid

0.276994

    Schwarz criterion

-6.561898

Log likelihood

11105.86

    F-statistic

17.22574

Durbin-Watson stat

1.993941

    Prob(F-statistic)

0.000000


Dependent Variable: D(LOG(FTSE))


Method: Least Squares


Date: 04/03/08 Time: 23:19


Sample (adjusted): 1/04/1995 12/17/2007


Variable

Coefficient

Std. Error

t-Statistic

Prob.  


C

0.000352

0.000152

2.320476

0.0204

AR(1)

0.811782

0.143817

5.644546

0.0000

AR(2)

-0.119852

0.018550

-6.460947

0.0000

MA(1)

-0.700211

0.144254

-4.854006

0.0000


R-squared

0.015630

    Mean dependent var

0.000350

Adjusted R-squared

0.014755

    S.D. dependent var

0.009124

S.E. of regression

0.009057

    Akaike info criterion

-6.569444

Sum squared resid

0.276830

    Schwarz criterion

-6.562192

Log likelihood

11103.07

    F-statistic

17.86273

Durbin-Watson stat

2.000970

    Prob(F-statistic)

0.000000


Dependent Variable: D(LOG(NIKK))


Method: Least Squares


Date: 04/03/08 Time: 23:19


Sample (adjusted): 6/05/1991 12/17/2007


Variable

Coefficient

Std. Error

t-Statistic

Prob.  


C

-0.000119

0.000196

-0.605751

0.5447

AR(1)

0.067715

0.388465

0.174314

0.8616

AR(2)

-0.031280

0.020580

-1.519911

0.1286

MA(1)

-0.101040

0.388710

-0.259937

0.7949


R-squared

0.002271

    Mean dependent var

-0.000120

Adjusted R-squared

0.001577

    S.D. dependent var

0.013835

S.E. of regression

0.013824

    Akaike info criterion

-5.723828

Sum squared resid

0.823708

    Schwarz criterion

-5.717922

Log likelihood

12350.30

    F-statistic

3.270523

Durbin-Watson stat

1.999445

    Prob(F-statistic)

0.020331


Dependent Variable: D(LOG(NIKK))


Method: Least Squares


Date: 04/03/08 Time: 23:21


Sample (adjusted): 6/04/1991 12/17/2007


Variable

Coefficient

Std. Error

t-Statistic

Prob.  


C

-0.000122

0.000200

-0.609179

0.5424

AR(1)

-0.740684

0.167818

-4.413615

0.0000

MA(1)

0.707506

0.168016

4.210950

0.0000

MA(2)

-0.049049

0.015265

-3.213198

0.0013


R-squared

0.002568

    Mean dependent var

-0.000123

Adjusted R-squared

0.001874

    S.D. dependent var

0.013835

S.E. of regression

0.013822

    Akaike info criterion

-5.724131

Sum squared resid

0.823650

    Schwarz criterion

-5.718226

Log likelihood

12353.81

    F-statistic

3.700290

Durbin-Watson stat

1.998320

    Prob(F-statistic)

0.011260


Dependent Variable: D(LOG(MDAX))


Method: Least Squares


Date: 04/06/08 Time: 12:50


Sample (adjusted): 5/15/1991 12/17/2007


Variable

Coefficient

Std. Error

t-Statistic

Prob.  


C

0.000330

0.000191

1.727807

0.0841

AR(1)

1.015754

0.037623

26.99830

0.0000

AR(2)

-0.052929

0.016715

-3.166538

0.0016

MA(1)

-0.947258

0.034152

-27.73659

0.0000


R-squared

0.007141

    Mean dependent var

0.000337

Adjusted R-squared

0.006452

    S.D. dependent var

0.008835

S.E. of regression

0.008806

    Akaike info criterion

-6.625751

Sum squared resid

0.335416

    Schwarz criterion

-6.619862

Log likelihood

14345.44

    F-statistic

10.36839

Durbin-Watson stat

2.000350

    Prob(F-statistic)

0.000001


Dependent Variable: D(LOG(MDAX))


Method: Least Squares


Date: 04/06/08 Time: 12:52


Sample (adjusted): 5/14/1991 12/17/2007


Variable

Coefficient

Std. Error

t-Statistic

Prob.  


C

0.000331

0.000190

1.742084

0.0816

AR(1)

0.958656

0.029600

32.38746

0.0000

MA(1)

-0.892365

0.033498

-26.63929

0.0000

MA(2)

-0.049133

0.016304

-3.013511

0.0026


R-squared

0.007000

    Mean dependent var

0.000336

Adjusted R-squared

0.006312

    S.D. dependent var

0.008834

S.E. of regression

0.008806

    Akaike info criterion

-6.625782

Sum squared resid

0.335483

    Schwarz criterion

-6.619895

Log likelihood

14348.82

    F-statistic

10.16561

Durbin-Watson stat

1.995773

    Prob(F-statistic)

0.000001


Modélisation ARMA(1,2)-GARCH(1,1)

Dependent Variable: D(LOG(MDAX))


Method: ML - ARCH (Marquardt) - Normal distribution

Date: 04/06/08 Time: 13:19


Sample (adjusted): 5/14/1991 12/17/2007


GARCH = C(5) + C(6)*RESID(-1)^2 + C(7)*GARCH(-1)


Coefficient

Std. Error

z-Statistic

Prob.  


C

0.000874

0.000161

5.436838

0.0000

AR(1)

0.996938

0.000771

1292.484

0.0000

MA(1)

-0.904335

0.015275

-59.20353

0.0000

MA(2)

-0.093016

0.015374

-6.049992

0.0000


Variance Equation


C

5.31E-06

5.61E-07

9.466094

0.0000

RESID(-1)^2

0.157596

0.010911

14.44425

0.0000

GARCH(-1)

0.778500

0.015346

50.72966

0.0000


R-squared

-0.010362

    Mean dependent var

0.000336

Adjusted R-squared

-0.011765

    S.D. dependent var

0.008834

S.E. of regression

0.008886

    Akaike info criterion

-6.860999

Sum squared resid

0.341349

    Schwarz criterion

-6.850695

Log likelihood

14861.06

    Durbin-Watson stat

2.017654


Dependent Variable: D(LOG(CAC))


Coefficient

Std. Error

z-Statistic

Prob.  


C

0.000544

0.000134

4.043721

0.0001

AR(1)

0.845703

0.115981

7.291753

0.0000

MA(1)

-0.825988

0.115486

-7.152267

0.0000

MA(2)

-0.034525

0.015243

-2.264996

0.0235


Variance Equation


C

3.35E-06

3.44E-07

9.720807

0.0000

RESID(-1)^2

0.087733

0.005131

17.09699

0.0000

GARCH(-1)

0.891909

0.006406

139.2249

0.0000


R-squared

0.000125

    Mean dependent var

0.000245

Adjusted R-squared

-0.001002

    S.D. dependent var

0.012952

S.E. of regression

0.012958

    Akaike info criterion

-6.105239

Sum squared resid

0.893983

    Schwarz criterion

-6.096597

Log likelihood

16280.51

    F-statistic

0.110894

Durbin-Watson stat

2.008991

    Prob(F-statistic)

0.995204


Dependent Variable: D(LOG(DOW))


Coefficient

Std. Error

z-Statistic

Prob.  


C

0.000494

8.46E-05

5.835302

0.0000

AR(1)

-0.423187

0.672958

-0.628847

0.5294

MA(1)

0.507802

0.673383

0.754105

0.4508

MA(2)

0.026955

0.061774

0.436343

0.6626


Variance Equation


C

1.11E-06

9.52E-08

11.65722

0.0000

RESID(-1)^2

0.067885

0.001462

46.44196

0.0000

GARCH(-1)

0.922571

0.002428

379.9038

0.0000


R-squared

0.001942

    Mean dependent var

0.000259

Adjusted R-squared

0.001367

    S.D. dependent var

0.009829

S.E. of regression

0.009823

    Akaike info criterion

-6.661176

Sum squared resid

1.006164

    Schwarz criterion

-6.656311

Log likelihood

34761.69

    F-statistic

3.380995

Durbin-Watson stat

2.059405

    Prob(F-statistic)

0.002479


Dependent Variable: D(LOG(NIKK))


Coefficient

Std. Error

z-Statistic

Prob.  


C

0.000228

0.000180

1.265985

0.2055

AR(1)

-0.975227

0.018710

-52.12427

0.0000

MA(1)

0.956207

0.025935

36.86921

0.0000

MA(2)

-0.022283

0.017122

-1.301457

0.1931


Variance Equation


C

3.73E-06

4.25E-07

8.776883

0.0000

RESID(-1)^2

0.073469

0.005685

12.92267

0.0000

GARCH(-1)

0.908725

0.006811

133.4233

0.0000


R-squared

0.001266

    Mean dependent var

-0.000123

Adjusted R-squared

-0.000125

    S.D. dependent var

0.013835

S.E. of regression

0.013836

    Akaike info criterion

-5.846792

Sum squared resid

0.824726

    Schwarz criterion

-5.836458

Log likelihood

12621.45

    F-statistic

0.909862

Durbin-Watson stat

2.024012

    Prob(F-statistic)

0.486518


Dependent Variable: D(LOG(FTSE))


Coefficient

Std. Error

z-Statistic

Prob.  


C

0.000656

0.000114

5.737062

0.0000

AR(1)

0.826285

0.092548

8.928134

0.0000

MA(1)

-0.712654

0.091854

-7.758557

0.0000

MA(2)

-0.125761

0.018191

-6.913323

0.0000


Variance Equation


C

4.88E-07

1.05E-07

4.664111

0.0000

RESID(-1)^2

0.060624

0.005668

10.69560

0.0000

GARCH(-1)

0.934517

0.006126

152.5498

0.0000


R-squared

0.013380

    Mean dependent var

0.000349

Adjusted R-squared

0.011625

    S.D. dependent var

0.009123

S.E. of regression

0.009070

    Akaike info criterion

-6.840866

Sum squared resid

0.277471

    Schwarz criterion

-6.828180

Log likelihood

11568.06

    F-statistic

7.624003

Durbin-Watson stat

2.001128

    Prob(F-statistic)

0.000000


Modélisation ARMA(1,2)E-GARCH

Dependent Variable: D(LOG(FTSE))


Method: ML - ARCH (Marquardt) - Normal distribution

Date: 04/06/08 Time: 20:15


Sample (adjusted): 1/03/1995 12/17/2007


LOG(GARCH) = C(5) + C(6)*ABS(RESID(-1)/@SQRT(GARCH(-1))) +

        C(7)*RESID(-1)/@SQRT(GARCH(-1)) + C(8)*LOG(GARCH(-1))


Coefficient

Std. Error

z-Statistic

Prob.  


C

-0.000158

0.000613

-0.257897

0.7965

AR(1)

0.996702

0.002797

356.3754

0.0000

MA(1)

-0.870517

0.017800

-48.90432

0.0000

MA(2)

-0.117193

0.017561

-6.673539

0.0000


Variance Equation


C(5)

-0.139763

0.019822

-7.050841

0.0000

C(6)

0.080565

0.009796

8.224362

0.0000

C(7)

-0.079220

0.006451

-12.28041

0.0000

C(8)

0.991905

0.001595

621.7916

0.0000


R-squared

0.009925

    Mean dependent var

0.000349

Adjusted R-squared

0.007869

    S.D. dependent var

0.009123

S.E. of regression

0.009087

    Akaike info criterion

-6.860387

Sum squared resid

0.278443

    Schwarz criterion

-6.845889

Log likelihood

11602.05

    F-statistic

4.828804

Durbin-Watson stat

2.019154

    Prob(F-statistic)

0.000020


Dependent Variable: D(LOG(DOW))


Coefficient

Std. Error

z-Statistic

Prob.  


C

0.000244

0.000103

2.374792

0.0176

AR(1)

0.997223

0.000791

1260.495

0.0000

MA(1)

-0.920639

2.95E-05

-31172.45

0.0000

MA(2)

-0.076298

0.000378

-201.7813

0.0000


Variance Equation


C(5)

-0.131403

0.007266

-18.08566

0.0000

C(6)

0.062011

0.002450

25.31559

0.0000

C(7)

-0.025455

0.002093

-12.16462

0.0000

C(8)

0.991168

0.000663

1494.805

0.0000


R-squared

0.002466

    Mean dependent var

0.000259

Adjusted R-squared

0.001797

    S.D. dependent var

0.009829

S.E. of regression

0.009821

    Akaike info criterion

-6.657012

Sum squared resid

1.005635

    Schwarz criterion

-6.651452

Log likelihood

34740.96

    F-statistic

3.682861

Durbin-Watson stat

2.044455

    Prob(F-statistic)

0.000557


Dependent Variable: D(LOG(MDAX))


Coefficient

Std. Error

z-Statistic

Prob.  


C

0.000328

0.000145

2.252701

0.0243

AR(1)

0.553010

0.195592

2.827362

0.0047

MA(1)

-0.461546

0.196232

-2.352040

0.0187

MA(2)

-0.003541

0.028723

-0.123288

0.9019


Variance Equation


C(5)

-0.635444

0.057311

-11.08758

0.0000

C(6)

0.145575

0.008599

16.92946

0.0000

C(7)

-0.085175

0.007918

-10.75721

0.0000

C(8)

0.945329

0.005499

171.8960

0.0000


R-squared

0.005976

    Mean dependent var

0.000336

Adjusted R-squared

0.004367

    S.D. dependent var

0.008834

S.E. of regression

0.008815

    Akaike info criterion

-6.862758

Sum squared resid

0.335829

    Schwarz criterion

-6.840983

Log likelihood

14864.22

    F-statistic

3.712214

Durbin-Watson stat

2.043936

    Prob(F-statistic)

0.000520


Dependent Variable: D(LOG(NIKK))


Coefficient

Std. Error

z-Statistic

Prob.  


C

-8.10E-05

0.000175

-0.462430

0.6438

AR(1)

-0.951570

0.037303

-25.50914

0.0000

MA(1)

0.931769

0.042222

22.06837

0.0000

MA(2)

-0.026501

0.016995

-1.559318

0.1189


Variance Equation


C(5)

-0.322514

0.027099

-11.90134

0.0000

C(6)

0.136560

0.009809

13.92142

0.0000

C(7)

-0.076946

0.005740

-13.40617

0.0000

C(8)

0.974714

0.002621

371.8839

0.0000


R-squared

0.002162

    Mean dependent var

-0.000123

Adjusted R-squared

0.000540

    S.D. dependent var

0.013835

S.E. of regression

0.013832

    Akaike info criterion

-5.869641

Sum squared resid

0.823986

    Schwarz criterion

-5.857831

Log likelihood

12671.75

    F-statistic

1.333210

Durbin-Watson stat

2.023802

    Prob(F-statistic)

0.229971


Dependent Variable: D(LOG(CAC))


Coefficient

Std. Error

z-Statistic

Prob.  


C

0.000303

0.000148

2.043747

0.0410

AR(1)

-0.888330

0.014354

-61.88906

0.0000

MA(1)

0.909546

0.001833

496.1335

0.0000

MA(2)

0.029151

0.014192

2.054048

0.0400


Variance Equation


C(5)

-0.274801

0.017413

-15.78157

0.0000

C(6)

0.113312

0.005239

21.62936

0.0000

C(7)

-0.074317

0.005312

-13.99143

0.0000

C(8)

0.978941

0.001800

543.9941

0.0000


R-squared

0.000719

    Mean dependent var

0.000245

Adjusted R-squared

-0.000595

    S.D. dependent var

0.012952

S.E. of regression

0.012956

    Akaike info criterion

-6.116993

Sum squared resid

0.893452

    Schwarz criterion

-6.107116

Log likelihood

16312.84

    F-statistic

0.547043

Durbin-Watson stat

2.010317

    Prob(F-statistic)

0.799168


Modélisation : ARMA(1,2)-GARCH(1,1)-M

Dependent Variable: D(LOG(DOW))


Date: 04/28/08 Time: 12:57


Included observations: 3905 after adjustments

Convergence achieved after 144 iterations


MA backcast: 12/25/1992 12/28/1992, Variance backcast: ON

GARCH = C(6) + C(7)*RESID(-1)^2 + C(8)*GARCH(-1)


Coefficient

Std. Error

z-Statistic

Prob.  


GARCH

4.903921

2.617447

1.873551

0.0610

C

0.000254

0.000200

1.268935

0.2045

AR(1)

-0.647980

0.255892

-2.532240

0.0113

MA(1)

0.653715

0.255901

2.554561

0.0106

MA(2)

0.000386

0.017420

0.022147

0.9823


Variance Equation


C

9.22E-07

1.23E-07

7.506099

0.0000

RESID(-1)^2

0.068143

0.005026

13.55868

0.0000

GARCH(-1)

0.923635

0.005681

162.5833

0.0000


R-squared

0.000212

    Mean dependent var

0.000352

Adjusted R-squared

-0.001583

    S.D. dependent var

0.009811

S.E. of regression

0.009819

    Akaike info criterion

-6.667024

Sum squared resid

0.375712

    Schwarz criterion

-6.654179

Log likelihood

13025.36

    F-statistic

0.118266

Durbin-Watson stat

2.031544

    Prob(F-statistic)

0.997144


Dependent Variable: D(LOG(CAC))


Coefficient

Std. Error

z-Statistic

Prob.  


GARCH

4.274848

1.758515

2.430943

0.0151

C

-7.10E-05

0.000240

-0.295895

0.7673

AR(1)

0.355481

0.571300

0.622232

0.5338

MA(1)

-0.340661

0.570525

-0.597102

0.5504

MA(2)

-0.024345

0.015434

-1.577381

0.1147


Variance Equation


C

3.50E-06

3.69E-07

9.480571

0.0000

RESID(-1)^2

0.088359

0.005217

16.93606

0.0000

GARCH(-1)

0.890069

0.006587

135.1247

0.0000


R-squared

-0.003138

    Mean dependent var

0.000245

Adjusted R-squared

-0.004457

    S.D. dependent var

0.012952

S.E. of regression

0.012981

    Akaike info criterion

-6.104082

Sum squared resid

0.896901

    Schwarz criterion

-6.094206

Log likelihood

16278.43

    Durbin-Watson stat

1.987431


Dependent Variable: D(LOG(NIKK))


Coefficient

Std. Error

z-Statistic

Prob.  


GARCH

2.625754

2.247081

1.168518

0.2426

C

-0.000169

0.000384

-0.439334

0.6604

AR(1)

-0.975269

0.018697

-52.16283

0.0000

MA(1)

0.955806

0.025987

36.78000

0.0000

MA(2)

-0.022708

0.017202

-1.320105

0.1868


Variance Equation


C

3.79E-06

4.33E-07

8.762121

0.0000

RESID(-1)^2

0.073429

0.005708

12.86449

0.0000

GARCH(-1)

0.908394

0.006870

132.2358

0.0000


R-squared

0.001877

    Mean dependent var

-0.000123

Adjusted R-squared

0.000255

    S.D. dependent var

0.013835

S.E. of regression

0.013834

    Akaike info criterion

-5.846661

Sum squared resid

0.824221

    Schwarz criterion

-5.834851

Log likelihood

12622.17

    F-statistic

1.157107

Durbin-Watson stat

2.023721

    Prob(F-statistic)

0.324132


Dependent Variable: D(LOG(FTSE))


Coefficient

Std. Error

z-Statistic

Prob.  


GARCH

0.085594

3.139956

0.027260

0.9783

C

0.000652

0.000197

3.302720

0.0010

AR(1)

0.825377

0.097521

8.463620

0.0000

MA(1)

-0.711748

0.097278

-7.316665

0.0000

MA(2)

-0.125681

0.018339

-6.853219

0.0000


Variance Equation


C

4.88E-07

1.06E-07

4.611566

0.0000

RESID(-1)^2

0.060635

0.005684

10.66706

0.0000

GARCH(-1)

0.934504

0.006166

151.5682

0.0000


R-squared

0.013375

    Mean dependent var

0.000349

Adjusted R-squared

0.011327

    S.D. dependent var

0.009123

S.E. of regression

0.009071

    Akaike info criterion

-6.840274

Sum squared resid

0.277472

    Schwarz criterion

-6.825776

Log likelihood

11568.06

    F-statistic

6.530439

Durbin-Watson stat

2.001091

    Prob(F-statistic)

0.000000


Dependent Variable: D(LOG(MDAX))


Coefficient

Std. Error

z-Statistic

Prob.  


GARCH

9.715800

2.965677

3.276082

0.0011

C

0.000470

0.000294

1.600729

0.1094

AR(1)

0.996686

0.001757

567.3282

0.0000

MA(1)

-0.904248

0.017957

-50.35680

0.0000

MA(2)

-0.091624

0.017636

-5.195323

0.0000


Variance Equation


C

5.01E-06

4.61E-07

10.86957

0.0000

RESID(-1)^2

0.158989

0.011339

14.02158

0.0000

GARCH(-1)

0.779478

0.014484

53.81704

0.0000


R-squared

0.003582

    Mean dependent var

0.000336

Adjusted R-squared

0.001968

    S.D. dependent var

0.008834

S.E. of regression

0.008825

    Akaike info criterion

-6.861429

Sum squared resid

0.336638

    Schwarz criterion

-6.849653

Log likelihood

14862.99

    F-statistic

2.219498

Durbin-Watson stat

2.004154

    Prob(F-statistic)

0.029908


Transmission en moyenne

Dependent Variable: D(LOG(CAC))


Method: Least Squares


Date: 04/06/08 Time: 21:02


Sample (adjusted): 7/10/1987 12/17/2007


Included observations: 5332 after adjustments


Variable

Coefficient

Std. Error

t-Statistic

Prob.  


C

0.000157

0.000173

0.908820

0.3635

D(LOG(DOW(-1)))

0.282519

0.016171

17.47110

0.0000


Dependent Variable: D(LOG(NIKK))


Method: Least Squares


Date: 04/06/08 Time: 21:06


Sample (adjusted): 6/03/1991 12/17/2007


Included observations: 4316 after adjustments


Variable

Coefficient

Std. Error

t-Statistic

Prob.  


C

-0.000260

0.000203

-1.282886

0.1996

D(LOG(DOW(-1)))

0.399382

0.021120

18.91024

0.0000


Dependent Variable: D(LOG(FTSE))


Method: Least Squares


Date: 04/06/08 Time: 21:06


Sample (adjusted): 1/02/1995 12/17/2007


Included observations: 3381 after adjustments


Variable

Coefficient

Std. Error

t-Statistic

Prob.  


C

0.000309

0.000156

1.985390

0.0472

D(LOG(DOW(-1)))

0.105979

0.015180

6.981607

0.0000


Dependent Variable: D(LOG(MDAX))


Method: Least Squares


Date: 04/06/08 Time: 21:06


Sample (adjusted): 5/13/1991 12/17/2007


Included observations: 4331 after adjustments


Variable

Coefficient

Std. Error

t-Statistic

Prob.  


C

0.000231

0.000127

1.816794

0.0693

D(LOG(DOW(-1)))

0.297763

0.013265

22.44764

0.0000


Transmission en variance

Dependent Variable: D(LOG(CAC))


Method: ML - ARCH (Marquardt) - Normal distribution

Date: 04/06/08 Time: 21:14


Sample (adjusted): 7/13/1987 12/17/2007


Included observations: 5331 after adjustments

Convergence achieved after 75 iterations


MA backcast: 7/09/1987 7/10/1987, Variance backcast: ON

LOG(GARCH) = C(5) + C(6)*ABS(RESID(-1)/@SQRT(GARCH(-1))) +

        C(7)*RESID(-1)/@SQRT(GARCH(-1)) + C(8)*LOG(GARCH(-1)) +

        C(9)*E(-1)^2


Coefficient

Std. Error

z-Statistic

Prob.  


C

0.000278

0.000150

1.859171

0.0630

AR(1)

-0.914986

0.066335

-13.79344

0.0000

MA(1)

0.940164

0.066468

14.14452

0.0000

MA(2)

0.037319

0.014791

2.523136

0.0116


Variance Equation


C(5)

-0.314027

0.019850

-15.82036

0.0000

C(6)

0.107548

0.006314

17.03395

0.0000

C(7)

-0.072388

0.005644

-12.82584

0.0000

C(8)

0.974473

0.002009

485.0948

0.0000

C(9)

29.61134

6.324429

4.682057

0.0000


Dependent Variable: D(LOG(FTSE))


Coefficient

Std. Error

z-Statistic

Prob.  


C

-0.000242

0.000650

-0.371793

0.7100

AR(1)

0.996011

0.003444

289.1607

0.0000

MA(1)

-0.866870

0.018246

-47.50911

0.0000

MA(2)

-0.118056

0.017680

-6.677356

0.0000


Variance Equation


C(5)

-0.174712

0.027020

-6.466112

0.0000

C(6)

0.070092

0.010532

6.655349

0.0000

C(7)

-0.082202

0.006709

-12.25234

0.0000

C(8)

0.987885

0.002521

391.9285

0.0000

C(9)

38.40408

19.53376

1.966036

0.0493


Dependent Variable: D(LOG(NIKK))


Coefficient

Std. Error

z-Statistic

Prob.  


C

-7.33E-05

0.000175

-0.418164

0.6758

AR(1)

-0.959303

0.029233

-32.81532

0.0000

MA(1)

0.940280

0.035092

26.79452

0.0000

MA(2)

-0.025184

0.017030

-1.478808

0.1392


Variance Equation


C(5)

-0.395135

0.032038

-12.33345

0.0000

C(6)

0.133564

0.010352

12.90286

0.0000

C(7)

-0.075835

0.006021

-12.59492

0.0000

C(8)

0.967169

0.003104

311.6083

0.0000

C(9)

95.19737

14.06179

6.769931

0.0000


Dependent Variable: D(LOG(MDAX))


Coefficient

Std. Error

z-Statistic

Prob.  


C

0.000331

0.000148

2.242193

0.0249

AR(1)

0.588946

0.179652

3.278253

0.0010

MA(1)

-0.497582

0.179934

-2.765366

0.0057

MA(2)

-0.004393

0.028313

-0.155150

0.8767


Variance Equation


C(5)

-0.981700

0.089610

-10.95527

0.0000

C(6)

0.164040

0.013923

11.78212

0.0000

C(7)

-0.075554

0.009955

-7.589596

0.0000

C(8)

0.912850

0.008388

108.8244

0.0000

C(9)

185.9741

28.42676

6.542222

0.0000


Test de contagion (avec une variable Dumy)

En moyenne

Dependent Variable: D(LOG(CAC))


Method: Least Squares


Date: 04/13/08 Time: 19:36


Sample (adjusted): 7/10/1987 12/17/2007


Included observations: 5332 after adjustments


Variable

Coefficient

Std. Error

t-Statistic

Prob.  


C

0.000160

0.000172

0.929442

0.3527

D(LOG(DOW(-1)))

0.285536

0.016101

17.73413

0.0000

D(LOG(DOW))*DUMMY(-1)

0.728506

0.102054

7.138411

0.0000


Dependent Variable: D(LOG(NIKK))


Method: Least Squares


Date: 04/13/08 Time: 19:40


Sample (adjusted): 6/03/1991 12/17/2007


Included observations: 4316 after adjustments


Variable

Coefficient

Std. Error

t-Statistic

Prob.  


C

-0.000259

0.000203

-1.280414

0.2005

D(LOG(DOW(-1)))

0.400148

0.021130

18.93706

0.0000

D(LOG(DOW))*DUMMY(-1)

0.120825

0.108240

1.116271

0.2644


Dependent Variable: D(LOG(FTSE))


Method: Least Squares


Date: 04/13/08 Time: 19:41


Sample (adjusted): 1/02/1995 12/17/2007


Included observations: 3381 after adjustments


Variable

Coefficient

Std. Error

t-Statistic

Prob.  


C

0.000314

0.000153

2.046390

0.0408

D(LOG(DOW(-1)))

0.111444

0.014941

7.459007

0.0000

D(LOG(DOW))*DUMMY(-1)

0.774697

0.072545

10.67885

0.0000


Dependent Variable: D(LOG(MDAX))


Method: Least Squares


Date: 04/13/08 Time: 19:42


Sample (adjusted): 12/31/1987 12/17/2007


Included observations: 5208 after adjustments


Variable

Coefficient

Std. Error

t-Statistic

Prob.  


C

0.000314

0.000119

2.643713

0.0082

D(LOG(DOW(-1)))

0.332304

0.012275

27.07227

0.0000

D(LOG(DOW))*DUMMY(-1)

0.733479

0.069796

10.50897

0.0000


En variance

Dependent Variable: D(LOG(MDAX))


Method: ML - ARCH (Marquardt) - Normal distribution

Date: 04/13/08 Time: 19:56


Sample (adjusted): 1/01/1988 12/17/2007


Included observations: 5207 after adjustments

Convergence achieved after 153 iterations


MA backcast: 12/30/1987 12/31/1987, Variance backcast: ON

LOG(GARCH) = C(5) + C(6)*ABS(RESID(-1)/@SQRT(GARCH(-1))) +

        C(7)*RESID(-1)/@SQRT(GARCH(-1)) + C(8)*LOG(GARCH(-1)) +

        C(9)*E(-1)^2 + C(10)*DUMMY(-1)*E(-1)^2


Coefficient

Std. Error

z-Statistic

Prob.  


C

0.000439

0.000152

2.888360

0.0039

AR(1)

0.883926

0.050379

17.54555

0.0000

MA(1)

-0.781102

0.053346

-14.64219

0.0000

MA(2)

-0.056469

0.018763

-3.009686

0.0026


Variance Equation


C(5)

-1.675837

0.094003

-17.82739

0.0000

C(6)

0.216894

0.018728

11.58144

0.0000

C(7)

-0.073034

0.010762

-6.786302

0.0000

C(8)

0.848336

0.008683

97.70180

0.0000

C(9)

468.2025

14.86657

31.49365

0.0000

C(10)

1035.459

256.2599

4.040662

0.0001


Dependent Variable: D(LOG(CAC))


Method: ML - ARCH (Marquardt) - Normal distribution

Date: 04/13/08 Time: 20:24


Sample (adjusted): 7/13/1987 12/17/2007


Included observations: 5331 after adjustments

Convergence achieved after 48 iterations


MA backcast: 7/09/1987 7/10/1987, Variance backcast: ON

LOG(GARCH) = C(5) + C(6)*ABS(RESID(-1)/@SQRT(GARCH(-1))) +

        C(7)*RESID(-1)/@SQRT(GARCH(-1)) + C(8)*LOG(GARCH(-1)) +

        C(9)*E(-1)^2 + C(10)*DUMMY(-1)*E(-1)^2


Coefficient

Std. Error

z-Statistic

Prob.  


C

0.000277

0.000150

1.853738

0.0638

AR(1)

-0.915036

0.066353

-13.79045

0.0000

MA(1)

0.940178

0.066495

14.13916

0.0000

MA(2)

0.037277

0.014794

2.519786

0.0117


Variance Equation


C(5)

-0.314083

0.019880

-15.79927

0.0000

C(6)

0.107449

0.006318

17.00748

0.0000

C(7)

-0.072437

0.005654

-12.81281

0.0000

C(8)

0.974458

0.002012

484.2545

0.0000

C(9)

29.93935

6.324655

4.733751

0.0000

C(10)

-19.34045

83.37548

-0.231968

0.8166


Dependent Variable: D(LOG(NIKK))


Method: ML - ARCH (Marquardt) - Normal distribution

Date: 04/13/08 Time: 20:26


Sample (adjusted): 6/04/1991 12/17/2007


Included observations: 4315 after adjustments

Convergence achieved after 22 iterations


MA backcast: 5/31/1991 6/03/1991, Variance backcast: ON

LOG(GARCH) = C(5) + C(6)*ABS(RESID(-1)/@SQRT(GARCH(-1))) +

        C(7)*RESID(-1)/@SQRT(GARCH(-1)) + C(8)*LOG(GARCH(-1)) +

        C(9)*E(-1)^2 + C(10)*DUMMY(-1)*E(-1)^2


Coefficient

Std. Error

z-Statistic

Prob.  


C

-7.10E-05

0.000176

-0.403677

0.6865

AR(1)

-0.959903

0.028603

-33.55963

0.0000

MA(1)

0.940777

0.034547

27.23208

0.0000

MA(2)

-0.025246

0.017025

-1.482858

0.1381


Variance Equation


C(5)

-0.393796

0.031971

-12.31721

0.0000

C(6)

0.133549

0.010369

12.87938

0.0000

C(7)

-0.075264

0.006099

-12.34035

0.0000

C(8)

0.967328

0.003095

312.5291

0.0000

C(9)

94.33492

13.96116

6.756955

0.0000

C(10)

34.74344

79.86350

0.435035

0.6635


Dependent Variable: D(LOG(FTSE))


Method: ML - ARCH (Marquardt) - Normal distribution

Date: 04/13/08 Time: 20:29


Sample (adjusted): 1/03/1995 12/17/2007


Included observations: 3380 after adjustments

Convergence achieved after 24 iterations


MA backcast: 12/30/1994 1/02/1995, Variance backcast: ON

LOG(GARCH) = C(5) + C(6)*ABS(RESID(-1)/@SQRT(GARCH(-1))) +

        C(7)*RESID(-1)/@SQRT(GARCH(-1)) + C(8)*LOG(GARCH(-1)) +

        C(9)*E(-1)^2 + C(10)*DUMMY(-1)*E(-1)^2


Coefficient

Std. Error

z-Statistic

Prob.  


C

-0.000226

0.000630

-0.359339

0.7193

AR(1)

0.995898

0.003486

285.6815

0.0000

MA(1)

-0.866165

0.018328

-47.26019

0.0000

MA(2)

-0.118582

0.017734

-6.686801

0.0000


Variance Equation


C(5)

-0.175133

0.026804

-6.533775

0.0000

C(6)

0.067880

0.010560

6.427941

0.0000

C(7)

-0.081668

0.006655

-12.27211

0.0000

C(8)

0.987705

0.002502

394.7233

0.0000

C(9)

40.28242

19.37862

2.078705

0.0376

C(10)

43.05302

55.43153

0.776688

0.0373


précédent sommaire suivant


Bitcoin is a swarm of cyber hornets serving the goddess of wisdom, feeding on the fire of truth, exponentially growing ever smarter, faster, and stronger behind a wall of encrypted energy


"Des chercheurs qui cherchent on en trouve, des chercheurs qui trouvent, on en cherche !"   Charles de Gaulle