2.4. Results
? Analysis 1
A simple example of a training set composed of two variables
(correlated or not) illustrated well the difference between the chord and the
Mahalanobis generalised distances (Fig. II.4). When the correlation between two
parameters was not different to 0, the ecological niche model based on the
chord distance and the Mahalanobis generalised distance gave similar results
(Fig. II.4a-b). However, when the variables of the training set were highly
correlated, the model gave improved results when it was based on the Mahalanobis generalized distance
(Fig. II.4c-d). This fictional example shows shows that the chord distance
should not be used when ecogeographical variables are correlated. Therefore, we
did not calculate the probability of cod occurrence based on this distance.
? Analysis 2
Cod individuals were mainly reported over neritic regions
(Fig. II.5; see also Fig. II.2). Most of the reported cod occurrences (79.87% in the original reference
matrix) were in regions shallower than 200 m and the frequency of cod
occurrence increased when the region became shallower; the homogenisation
procedure did not alter radically the shape of the distribution (Fig. II.5).
Only a fraction of the total records (6.41% of reported cod occurrence) were
deeper than 800 m, the threshold of bathymetry selected in this study. The
sharpness of the continental slope may explain this small percentage since it
is likely that the species can make short incursions over the shelf-edge (small
mistakes on the spatial coordinates could increase this percentage slightly).
Cod are rarely seen in oceanic regions and some authors have proposed a limit
of 600 m, which corresponded to 12.48% of the records (Sundby 2000). To be more
conservative, the bathymetric threshold was increased to 800m.
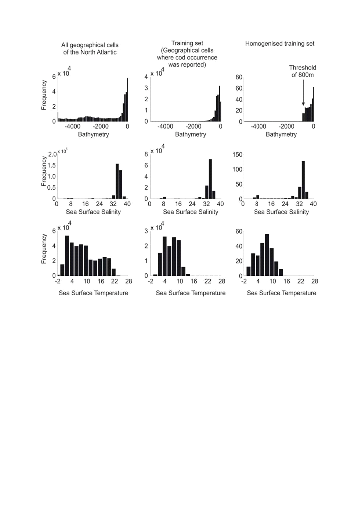
Figure II.5 : Frequency distribution of
bathymetry (upper panels), sea surface salinity (middle panels) and sea surface
temperature (lower panels) in the North Atlantic (from 80.5°W to
70.5°E and from 35.5°N to 70.5°N; left panels), in the original
reference matrix (i.e. geographical pixels where cod occurrence was detected)
and in the homogenised reference matrix (see methods).
The frequency of occurrence showed a mode over 34 for annual
SSS, a mode that corresponds to the one identified when all regions of the
Atlantic were gathered together. Another smaller mode, more visible after
homogenisation, appeared around 8 (Fig. II.5). This mode corresponds to the
salinity observed in the Baltic Sea. While annual SSTs in the regions of the
North Atlantic vary between -2°C and 22°C, with a mode around
2°C, the range of temperature in which cod occurrences were more
frequently reported were over 8°C but range between 2°C and 14°C
in the homogenised reference matrix. The procedure of homogenisation (Step 1)
made it clear that the thermal optimum of the species is about 8°C.
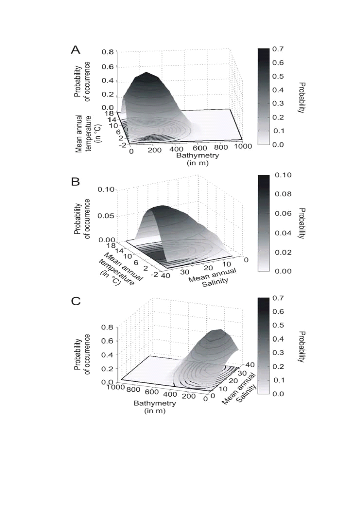
Figure II.6 : Realised niche (sensu
Hutchinson) of the Atlantic cod. A. Probability of cod
occurrence as a function of bathymetry and mean annual sea surface temperature.
B. Probability of cod occurrence as a function of mean annual
sea surface salinity and mean annual sea surface temperature.
C. Probability of cod occurrence as a function of mean annual
sea surface salinity and bathymetry.
? Analysis 3
The model NPPEN was first applied to reproduce the ecological
niche of Atlantic cod as a function of annual SST (observed data), annual SSS
and bathymetry (Fig. II.6). The niche exhibited high probabilities of
occurrence at a bathymetry that ranged between 0 and 500 m (mode between 100 m
and 300 m), an annual SST between -1°C and 14°C (mode between
4°C and 8°C) and an annual SSS ranging between 0 and 36 (mode between
25 and 34) (Fig. II.6).
When projected on the geographical space (Fig. II.7), the
modelled spatial distribution of the probability of cod occurrence was
congruent with the main location of the cod stocks in the North Atlantic sector
(Sundby 2000, Bigg et al. 2008). However, there was a notable exception in the
Baltic Sea where low probabilities of cod occurrence were detected
(Fig. II.7A). A significant decrease in the probability of cod occurrence
was evident between the 1960s and the period 2000-2005 in the North Sea, while
no such a change was visible on the western side of the Atlantic at the
southern range of the spatial distribution of the species. At the northern edge
of the spatial distribution of the species, probabilities of cod occurrence
increased along Greenland and especially in the western regions of this country
and in the Barents Sea. Probabilities around the Faeroes and Iceland remained
stable.
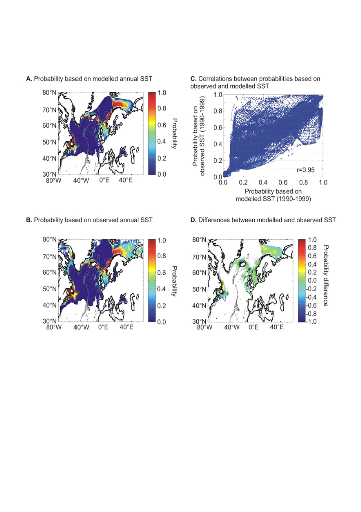
Probabilities of cod occurrence based on modelled annual SST
(ECHAM 4, scenario B2) and observed annual SST were similar (r=0.95,
p<0.01). However, some discrepancies were noted on the western side of the
Atlantic (Fig. II.8D; see (Beaugrand et al. 2008). Based on modelled data, the
probabilities of cod occurrence appear much lower than observed data during the
1990s on the Georges Bank, the Eastern Scotian Shelf and the Grand Bank
(Fig. II.8D).
The examination of long-term decadal changes in the
probability of cod occurrence projected for this century suggests a clear
northward movement of this species (Fig. II.9). Interestingly, the probability
of cod occurrence decreased substantially at the southern edge of the range of
the species: the North Sea, Georges Bank, Eastern Scotian Shelf, Grand Bank and
Newfoundland. The probabilities increased in the Barents Sea and in areas close
to Greenland while no major changes were detected for Iceland. A substantial
decrease in the probability of cod occurrence is also suggested by the model
around the Faeroes at the end of this century if long-term changes in SST
follow Scenario B2 (Fig. II.9D).
Figure II.7 : Modelled spatial
distribution in the probability of cod occurrence. A.
Probability of cod occurrence for the period 1960-1969. B.
Probability of cod occurrence for the period 2000-2005.
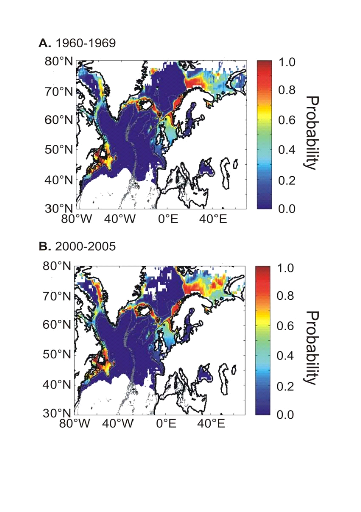
Figure II.8 : Modelled spatial
distribution in the probability of cod occurrence for the period 1990-1999.
A. From modelled annual SST (ECHAM 4, scenario B2).
B. From observed annual SST. C. Relationships
between probabilities based on observed and modelled (ECHAM 4, scenario B2)
annual SST. The Pearson coefficient of correlation is indicated. Probabilities
assessed from Scenario A2 gave similar conclusions. D.
Difference between probability of cod occurrence based on modelled SST (A) and
probability of occurrence based on observed SST (B).
The probability of cod occurrence was sensitive to the
intensity of warming (Fig. II.10). This sensitivity was not constant in
space. Major changes occurred in areas located at the southern or northern
limit of the spatial distribution of the species. When the level of
anthropogenic warming remained unchanged (Fig. II.10A-B), the probability of
cod occurrence remained high in regions located at the southern limit (or low
at the northern limit) of the spatial distribution of the species. However,
even with a moderate scenario (Scenario B1, Fig. II.10C), the probability of
cod occurrence decreased in key regions such as the North Sea and the Georges
Banks. When the level of anthropogenic warming increased, this had a pronounced
influence in regions such as the North Sea and the Eastern Scotian Shelf
(Fig. II.10D-E).
The coefficient of variation calculated per geographical cell
using all 7 simulations issued from the three models (ECHAM4, HadCM3, HadGEM1)
showed the areas where the changes are expected to be the most prominent (Fig.
II.10F). This analysis showed that modifications are expected to be pronounced
at the periphery of the current spatial distribution of species. High values
were observed in the Barents Sea where a strong increase in the probability of
cod occurrence is expected in the case of an intense warming and to a lesser
extent in areas such as the North Sea and the Georges Bank.
Figure II.9 : Projected long-term
decadal changes in the probability of cod occurrence from modelled annual SST
(Scenario B2). A. Period 1990-1999. B. Period
2050-2059. C. Period 2090-2099. Probabilities assessed from
Scenario A2 gave similar conclusions. D. Difference of
modelled probability of occurrence between periods 2090-2099 and 1990-1999.
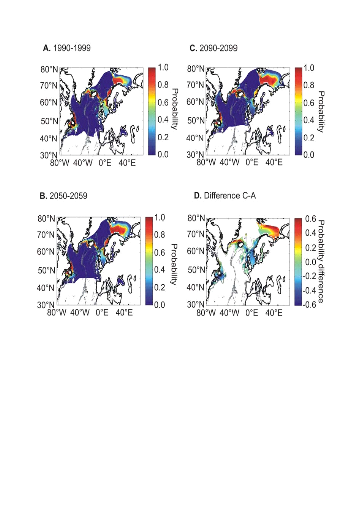
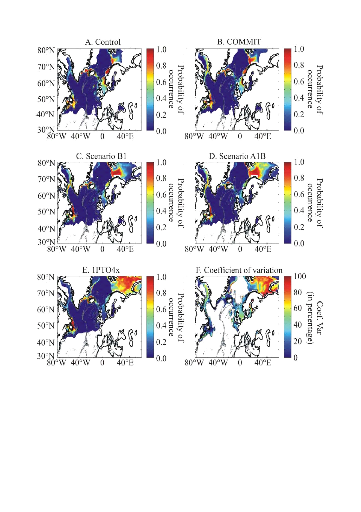
Figure II.10 : Projected long-term decadal
changes in the probability of cod occurrence for the period 2090-2099.
A. scenario `Control'. B. Scenario COMMIT.
C. SRES scenario B1. D. SRES scenario A1B.
E. 1PTO4x. F. Coefficient of variation (Coef.
Var) based on the 7 scenarios and 3 atmosphere-ocean general circulation models
(see methods). The intensity of warming increases from A to E.
| 

