UNIVERSITE DE LOME

West Africa Science service Center on
Climate Change and Human Security

FLOOD VULNERABILITY ASSESSMENT IN DOWNSTREAM AREA OF
MONO BASIN, SOUTH-EASTERN TOGO: YOTO DISTRICT
A Thesis
by
KISSI Abravi Esssenam
Submitted to
West African Science Service Center on Climate Change and
Adapted Land Use
Université de Lomé, Togo
in partial fulfilment of the requirements for the degree of
MASTER OF SCIENCE
November, 2014
Major Subject: Climate Change and Human Security
FLOOD VULNERABILITY ASSESSMENT IN DOWNSTREAM AREA OF
MONO BASIN, SOUTH-EASTERN TOGO: YOTO DISTRICT
A Thesis
by
KISSI Abravi Esssenam
Submitted to
West African Science Service Center on Climate Change and
Adapted Land Use
Université de Lomé, Togo
in partial fulfilment of the requirements for the degree of
MASTER OF SCIENCE
Approved by:
Chair of Committee, Georges Abbevi ABBEY
Committee Members, Amadou Thierno GAYE
Komi AGBOKA
Director of Program, Kouami KOKOU
November 2014
Major Subject: Climate Change and Human Security
ABSTRACT
Flood Vulnerability
Assessment in Downstream Area of Mono Basin,
South-Eastern Togo: Yoto
District. (November, 2014)
KISSI Abravi Essenam.
B.S., Université de Lomé
Chair of Advisory Committee: Dr. Georges Abbevi ABBEY
The Mono River in the Yoto district, presents a challenge in
terms of repeated flood hazard. The eight selected communities lie in majority
in the floodplains of the Mono River and experience year after year flood
disaster. This study focuses on flood vulnerability assessment of the
downstream part in the Mono River basin in the Yoto district. It analyses the
trend in rainfall and river discharge series (1971-2010); it assesses the
determinants of flood vulnerability; and it equally computes Flood
Vulnerability Index (FVI).
The result reveals a clear evidence of change in precipitation
and river discharge patterns during the period of record. It shows an extreme
variability in terms of flood magnitude and frequency in the Mono River.
Besides, the closeness of households' farmlands to the river body, the type of
construction and the position of settlements, the household size, the low level
education of household head, the lack of diversification of livelihood
strategies, the lack of adequate flood warning system and lack of willingness
and ability to take responsive actions coupled with inadequate emergency
services, are identified as main determinants increasing communities'
vulnerability to flood disaster. Furthermore, FVI offers easy comparison of
communities' vulnerability to flood disaster.
Keywords: Trend analysis, Determinant of flood
vulnerability, Flood Vulnerability Index, Downstream part of the Mono River
basin.
RESUME
Le fleuve Mono, présente un défi majeur en terme
d'inondations qui constituent un phénomène récurent dans
la préfecture de Yoto. La majeur partie de la population des huit
villages est localisée dans le lit supérieur et moyen du fleuve
et fait face année après année aux inondations. A cet
effet, cette étude a été initiée pour analyser la
vulnérabilité des populations aux inondations dans la basse
vallée du fleuve Mono dans la préfecture de Yoto. L'analyse a
portée sur la variation des précipitations et débits du
fleuve de 1971-2010, l'identification des facteurs de
vulnérabilités et le calcul des indices de la
vulnérabilité d'inondation
Le résultat révèle une claire
évidence de la variabilité pluviométrique et des
débits pendant la période considérée. Il montre une
variabilité extrême quant à la fréquence et
l'intensité des inondations. La proximité des terrains agricoles
par rapport au fleuve, le type de construction, le faible niveau
d'éducation, l'absence de système d'alerte précoce
adéquat, et la faible capacité de la population à prendre
des mesures appropriées pour faire face aux impacts des inondations sont
identifiés comme les principaux facteurs de la
vulnérabilité de la population aux inondations. En outre, le
calcul des indices de vulnérabilité offre une comparaison facile
de la vulnérabilité des communautés aux inondations.
Mots clés: Analyse de la variation; Les
facteurs de vulnérabilité; Indice de vulnérabilité
d'inondation; Basse vallée du fleuve Mono.
Dedication
To
The Living God Almighty
who by his grace has seen and guided me in my entire life and
through my academic course of study to this level, the glory be to him.
To
My father Kissi Kodjo, my uncle Houngbedji Clement and my aunt
Houngbedji Clotilde, brothers and sisters
Thank you for inspiring me always to look higher
May the Lord reward you
ACKNOWLEDGEMENTS
I would like to start by thanking to WASCAL ( West African
Science Service Centre on Climate Change and Adapted Land Use) for offering me
a scholarship, which made it possible for me to participate in the Master
Programme in Climate Change and Human Security (MRP CCHS) at University of
Lomé.
My special thanks go to my committee chair, Dr. Georges Abbevi
ABBEY, and my committee members, Prof Amadou Thierno GAYE, and Dr. Komi AGBOKA,
for his patience, unceasing and tireless efforts, his guidance and mentorship,
and for his encouragement, constructive comments, remarks, suggestions and
support during the writing process of this thesis.
I would like to thank our former Director Professor Adote Blim
Blivi for his constructive comments and advices to give us the will and
strength to be best.
I would also like to express my gratitude to my lecturers and
colleagues who helped me and kept me during the two years of this Master.
I would like to sincerely thank our current Director Professor
Kokou Kouami and our coordinator Dr Aklesso Egbendewe-Mondzodzo for their
encouragement and support.
I would like to express my sincere gratitude to Togo Red Cross
Society, Mr André Akpadja , to the team of research assistants for their
effort during the process of collecting data for this study and to all the
communities and households where the questionnaires were administered without
whom this research would not have been possible.
I am grateful to all those who have helped directly or
indirectly in the production of this thesis . I render my special thanks to my
entire family especially, to my young sister, Ms Kissi Esther, to all my
friends, especially, Mr Batadjaga Magloire, Mr Adjaho Iréné, Mr
Kpotor Edguard, Mr Wilson-Bahun Noah, Mr Bruce Michel, Mr Etoh Kudzo Sena who
listened to my complains, gave me advice and the will to go on, and made me
laugh when I needed to. To you, all I owe my gratitude.
May the Almighty Bless You.
TABLE OF CONTENTS
ABSTRACT
III
RESUME
IV
DEDICATION
V
ACKNOWLEDGEMENTS
VI
TABLE OF CONTENTS
VII
LIST OF FIGURES
X
LIST OF TABLES
XI
LIST OF MAPS
XII
LIST OF PHOTO
XII
CHAPTER I: INTRODUCTION
1
1.1. PROBLEM STATEMENT
1
1.2 RESEARCH OBJECTIVES
4
1.3. RESEARCH QUESTIONS
4
1.4. RESEARCH HYPOTHESIS
5
1.5. THESIS STRUCTURE
5
CHAPTER II: LITERATURE REVIEW
6
2.1. HAZARDS, DISASTERS, AND VULNERABILITY
6
2.2. FLOOD VULNERABILITY FACTORS
8
2.3. METHODOLOGY FOR MEASUREMENT OF VULNERABILITY
TO NATURAL HAZARDS
10
2.3.1. Theoretical and Conceptual Frameworks of
Vulnerability
10
2.3.2 Indicators for Measuring
Vulnerability
11
2.4. THE INDEX APPROACH TO STUDY VULNERABILITY
15
2.4.1.Existing Flood Vulnerability Index
16
CHAPTER III: RESEARCH METHODOLOGY
18
3.1 THE AREA OF STUDY
18
3.1.1 Localisation
18
3.1.2. Landscape, soil and vegetation
18
3.1.3. Climate and Hydrology
21
3.1.4. Population and Economic Activities
21
3.2. METHODS
21
3.2.1. Study Population and sampling
22
3.2.2. Selected Vulnerability Conceptual
Frameworks
22
3.2.3. Flood Vulnerability Indicator
Development
23
3.3. DATA COLLECTION AND ANALYSIS
25
3.3.1. Primary Data Collection
25
3.3.2. Secondary Data
25
3.3.3. Data Analysis
26
3.3.3.1. Trend Analysis of Rainfall And River
Discharge to Assess Climate Change.
26
3.3.3.2. Analysis of the determinants of
communities' vulnerability to flood
27
3.3.3.3 Analysis of human-environmental
condition
29
3.3.3.4 Computation of Flood Vulnerability Index
(FVI)
29
CHAPTER IV: PRESENTATION AND DISCUSSION OF
RESULTS
33
4.1. EMPIRICAL FINDING ON TREND AND VARIABILITY
ANALYSIS
33
4.1.1. Precipitation Time Series Analysis
33
4.1.2. Discharge Time Series Analysis
35
4.2. DETERMINANTS OF COMMUNITIES' VULNERABILITY TO
FLOODS
38
4.2.1. Flood Frequency and Magnitude
Analysis
38
4.2.4. Assessment of communities'
vulnerability : Human-environmental conditions
42
4.2.4.1. Socio-Demographic Characteristics of
Households
42
4.2.4.2 Location of settlement and type of
construction
43
4.2.4.3. Livelihood patterns of respondents
44
4.2.4.4. Awareness and impacts of flood
44
4.2.4.5 Environmental conditions
45
4.2.4.6. Household coping mechanisms
46
4.2.4.7. Anticipative measures of flood
occurrence
46
4.2.4.8. Training on flood hazard management
47
4.2.4.9. Household recovery time and positive
effects of flood on household
47
4.2.5 Household adaptation options
48
4.2.5.1 Household's perception of Government and
NGOs role in flood management
48
4.2.5.2. Household `s perception of communities
role in flood management
48
4.3 COMPUTATION OF FLOOD VULNERABILITY INDEX
49
4.3.1 Identifying key indicators of developed
FVI
49
4.3.2. Normalised Scores and Weight Values of
Indicators
49
4.3.4. Composite vulnerability index of
vulnerability factors
50
4.3.4.1. Exposure factor
50
4.3.4.2 Susceptibility Factor
51
4.3.4.3 Resilience Factor
53
CHAPTER V: CONCLUSION AND POLICY
RECOMMENDATION
56
REFERENCES
58
ANNEXE 1 : Statistical summary of annual
and monthly precipitation for Tabligbo
- 1 -
ANNEXE 2: Mann-Kendall test results of
annual, monthly and seasonal precipitation
- 2 -
ANNEXE 3 : Statistical summary of annual
and monthly flow for Athieme
- 3 -
ANNEXE 4: Mann-Kendall results of annual ,
monthly and seasonal flow for the study area
- 5 -
ANNEXE 5: Calculation for return period of
2010 flood, Mono river
- 6 -
ANNEXE 6:Normalised scores of flood
vulnerability indicators of each village
- 7 -
ANNEXE 7: Calculated weights of flood
vulnerability indicators
8
ANNEXE 8: Questionnaire for household
interview
9
ANNEXE 9: Key informants interview
guide.
15
VITA .
16
LIST OF FIGURES
FIGURE 1: NUMBER OF PEOPLE AFFECTED BY FLOOD DURING
THE PERIOD OF (1994-2010)
3
FIGURE 2 SUSCEPTIBILITY FRAMEWORK
9
FIGURE 3 RESILIENCE FRAMEWORK
10
FIGURE 4: TURNER ET AL'S VULNERABILITY FRAMEWORK;
SOURCE: TURNER ET AL., 2003, P 8076
21
FIGURE 5: VULNERABILITY COMPONENTS EXTRACTED FROM
TURNER ET AL., 2003 FRAMEWORK
22
FIGURE 6: LINEAR TREND LINE CORRESPONDING TO
RAINFALL DATA (1971-2010)
33
FIGURE 7: MONTHLY AVERAGE RAINFALL (1971-2010)
33
FIGURE 8: ANNUAL RAINFALL CUMULATIVE DEVIATION
(1971-2010) (TABLIGBO STATION)
34
FIGURE 9: AVERAGE ANNUAL DISCHARGE VARIATION
(1971-2010)
35
FIGURE 10: MONTHLY DISCHARGE AVERAGE(1971-2010)
35
FIGURE 11: ANNUAL DISCHARGE CUMULATIVE DEVIATION
(1971-2010)
36
FIGURE 12:FLOOD FREQUENCY DISTRIBUTION
39
FIGURE 13: LIVELIHOOD STRATEGIES BY MARITAL STATUS
OF HEADS OF HOUSEHOLDS
43
LIST OF TABLES
TABLE 1: FLOOD INDICATORS INFORMATION
3
TABLE 2: SELECTED INDICATORS FOR FLOOD
VULNERABILITY
23
TABLE 3: DESCRIPTION OF SECONDARY DATA USE
24
TABLE 4: REFERENCE OF METEOROLOGICAL AND
HYDROLOGICAL STATIONS
25
TABLE 5: ANNUAL MAXIMUM FLOW BASIC STATISTICS
38
TABLE 6: DEPTHS OF FLOOD WATER (2010) AS REVEALED
BY MARKS ON BUILDING WALLS AND AVERAGE FLOOD DURATION (2010) FROM HOUSEHOLD
40
LIST OF MAPS
MAP 1: MAP SHOWING THE TARGETED VILLAGES
3
MAP 2: MAP OF YOTO DISTRICT SHOWING THE SURVEYED
VILLAGES IN LOW ALTITUDE
43
MAP 3: FLOOD EXPOSURE MAP OF THE STUDY AREA
53
MAP 4: FLOOD SUSCEPTIBILITY MAP OF THE STUDY
AREA
54
MAP 5: FLOOD RESILIENCE MAP OF THE STUDY AREA
55
MAP 6 FLOOD VULNERABILITY MAP OF THE STUDY
AREA
56
LIST OF PHOTO
PHOTO 1: PALM TREES FARM UNDER WATER SINCE THE
2010 FLOOD, PHOTOGRAPH TAKEN DURING FIELD WORK
3
PHOTO 2: USE OF WATER IN THE COMMUNITY,
PHOTOGRAPH TAKEN DURING FIELD WORK
45
PHOTO 3: HOUSE MADE IN BANCO AND
STRAW. 46
PHOTO 4: HOUSE MADE BY CLAY WALL WITH DESTROYED BY THE 2010
FLOOD IN TOKPLI COUNTY THATCHED ROOF, PHOTOGRAPH TAKEN DURING
SOURCE: PDNA, 2010 FIELD
WORK..................................................................
46
PHOTO 6: DEHYDRATE SOIL IN BATOE
VILLAGE...................................................................48
PHOTO 7: MONO RIVER BANK FRAGMENTATION IN PHOTOGRAPH TAKEN DURING FIELD WORK
VILLAGE MAWUSSOU, PHOTOGRAPH TAKEN DURING FIELD WORK
48
PHOTO 8: IMPLANTATION OF SIGN POST MARKING
POSSIBLE FLOODING LEVELS (EARLY WARNING SYSTEM)
49
ACRONYMS
CCA: Climate Change Adaptation
CRED: Centre for Research on Epidemiology of Disasters
CV: Coefficient of Variation
DNM: Direction National de la Météorologie
DRM: Disaster Risk Management
EM-DAT: Emergency Events Data Base
EVI: Extreme Value Type 1 distribution
FAO: United Nations Food and Agriculture Organization
FVI: Flood Vulnerability Index
GDP: Gross Domestic Product
GIS: Geographical Information System
HFA: Hyogo Framework for Action
IMF: International Monetary Fund
IPCC: Intergovernmental Panel on Climate Change
MERF: Ministère de l'Environnement et des Ressources
Forestières
NGO: Non Government Organisation
LP3: Log Pearson Type 3 distribution
PAR: Pressure and Release Model
PDNA: Post Disaster Needs Assessment
OCHA: Office for the Coordination of Humanitarian Affairs
SREX: IPCC Special Report on Managing the Risks of Extreme
Events and Disasters to Advance Climate Change Adaptation
UN: United Nations
UNDP: United Nations Development Programme
UN/ISDR: United Nations International Strategy for Disaster
Reduction
UNU-EHS: United Nations University-Institute for Environment and
Human security
CHAPTER I. INTRODUCTION
1.1. Problem Statement
Many countries worldwide, whether in Europe, America, Asia,
Oceania, Australia or in Africa, are experiencing heavy rains, river overflows,
hurricanes, typhoons, tsunamis causing unexpected floods which decimate
entirely or partly some localities in all over the world. Floods are among the
most recurring and devastating natural hazards, impacting human lives and
causing severe economic damage throughout the world (Sadiq et al, 2011, p 85).
Floods can be defined as hydrological events characterised by a rapid rise of
water flow in the river. They are characterised by long, short and no warning,
depending on the type of floods, speed or onset which may be gradual or sudden
(Carter 1991, p1). Various elements either climatic or non-climatic influence
flood processes resulting in different types of flood. Six types of floods are
distinguished: coastal, flash, river, flood due to drainage problems, tsunamis,
and tidal wave/bore floods (Jonkman, 2005).
Flood disasters are occurring as a consequence of either natural
factors, such as climate change and climate variability or anthropogenic
factors, such as socio-economic and land-use developments (Balica, 2009, p
2571). The frequency of those disasters has been increasing over the years,
resulting in loss of life, damage to property and destruction of the
environment.
Over the last 50 years, there has been a growing body of
evidence pointing to the effect of human behaviour on the global natural
environment and on the possibility that certain types of natural disasters such
as floods may be increasing as a direct consequence of human activity
(Guha-Sapir et al, 2004, p 15). Equally, the effects associated with global
warming such as sea level rise, more intensive precipitation levels and higher
river discharges may be consequences of this as well. Those effects may
increase the frequency and the extent of flood hazards on a worldwide scale and
make the number of people at risk in developing countries more vulnerable to
flood disasters due to high poverty level.
In Africa, floods of different kinds are one of the most common
type of disastrous events, and they account for the biggest losses
inflicted by natural disasters. The UN Office for the Coordination of
Humanitarian Affairs (OCHA) recently stated that, compared with previous years,
2010 has seen the largest number of people affected and dying from flooding.
This is consistent with the dramatic rise in flood events that have battered
the world, with West Africa being a case in point.
It is understood that flood risks will not subside in the
future, and with the onset of climate change, flood intensity and frequency
will threaten many regions of the world (Sadiq, 2011, p 85). The Fourth
Assessment Report (AR4) by the Intergovernmental Panel on Climate Change (IPCC,
2007) projects that warming in Africa in the 21st century is likely to be
greater than the average global warming and does find that extremely wet
seasons, high intensity rainfall events, and associated flooding in West Africa
are expected to increase by 20% over the next decades. However, it is noted
that responses of local communities to the impact of extreme climatic events in
many cases in West Africa have mostly been reactive instead of proactive.
Between 1925 and 1992, Togo has recorded 60 urban and rural
floods that caused damages and casualties (MERF, 2013, p 13). Flood disasters
are not then a recent phenomenon in the country but have become a frequently
recurring problem that occur mainly between July and October which inflicts
significant environmental, social, and economic damages and affects population
safety. According to "EM-DAT" (Emergency Events Database) of the Centre for
Research on the Epidemiology (CRED), a number of flood disasters have been
recorded during the last 20 years, with particularly severe events occurring in
2007, 2008 and most recently in 2010 "figure 2". According to MERF (2010), the
2010 flood, in Togo has impacted both urban and rural areas throughout the
entire country, affecting 82,767 people; 21 persons were reported to have lost
their lives, 85 to have been injured, 12,382 houses have been impacted and
7744,24 hectares of land to have been destroyed. Damage and losses were
amounted to an estimated 1.1 percent of GDP, amounting to US$38 million.
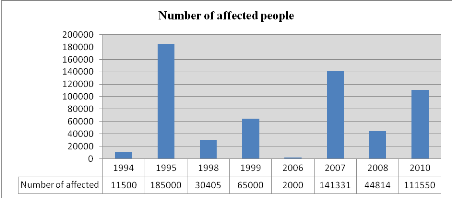
Figure 1: Number of people
affected by flood during the period of (1994-2010)
Source: EM-DAT: The OFDA/CRED
International Disaster Database
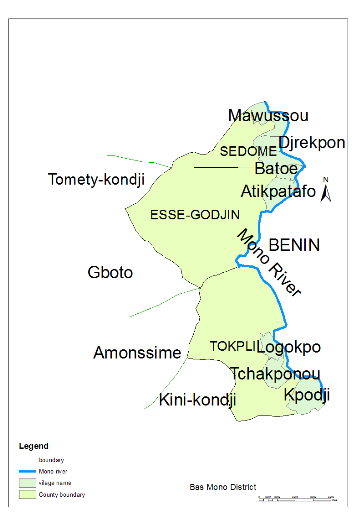
The study area is made up of eight villages (Mawussou, Djrekpon,
Batoe, Tofacope, Atikpatafo, Logokpo, Tchakponou-kondji, Kpodji) from three
counties Sedome, Esse-Godjin and Tokpli located along the river in a
severely flood prone area. The population has experienced occurrence of floods.
Flood events were frequent during the last decade, causing loss of lives,
extensive damages to property, including houses, destruction of transport
infrastructures, agricultural land, breakdown in education system and food
production. In sum flood affects human security in these communities. The
number of reported flood disasters during the last 20 years in the Yoto area,
occurred mainly in 1995, 1999, 2007, 2008 and 2010, with the 2010 flood being
the most severe (UN, 2010) and recently in October 2014. During the 2010 flood,
six counties, 35 villages, including the study villages, were impacted; 2081
people were affected and 1496 hectares of crops were destroyed in the area.
Supplied by a set of sub-branches, the Mono River with 21,300 km² often
undergoes during torrential rains period, the rising of water level followed by
high flows causing the overflowing of the river which inundates the selected
villages and makes the population more vulnerable to flood disasters. To this
are added environmental factors such as fragmentation of the river banks due to
erosion effect digging and widening the river channel, the anthropogenic
pressure like the construction of Nangbeto dam at the upstream of the Mono
basin, deforestation, the demographic explosion and the socio-economic
constraints that exacerbate the vulnerability of the population located at the
downstream part of the basin (AGO et al., 2005, p 1).
The country's vulnerability is expected to increase as a result
of climate change. It follows that both the frequency and the severity of flood
hazards have the potential to increase (MERF, 2009). Regardless of the current
and the future trend of flood hazards combined with socio-economic constraints
of the area, about 74.8% of people are below the poverty line (IMF, 2010, p
17), the occupancy or use of flood-prone areas may involve a degree of
vulnerability.
For communities to be protected against damage due to floods,
it exists four main type of flood measures that have to be taken into account:
the non-structural measures, the structural measures, land planning measures
and conducting flood vulnerability and risks assessments, the latter being the
first step in disaster risk reduction process. Therefore, to enable decision
makers to implement appropriate flood policies in the right place, there is a
need to conduct flood vulnerability assessment with a vulnerability score for a
systematic understanding of an area; its characteristics related to flood
disasters and easily interpret and compare vulnerability of different
communities. Thus, the focus of this study is to conduct flood vulnerability
assessment of the downstream area in the Mono River basin in the Yoto district
through indicator-based vulnerability assessment as proactive response to
floods.
1.2
Research Objectives
The overall objective of the current
study is to conduct indicator-based flood vulnerability assessment of the
downstream part in the Mono River basin in the Yoto district to compute a Flood
Vulnerability Index in order to assess the conditions which influence flood
damage in the study area and pinpoint the most vulnerable villages to flood for
an effective flood risk reduction. More specifically, the present study
attempts to:
1. examine the long term trends in rainfall and discharge data
for a record period of (1971-2010);
2. identify the determinants of communities' vulnerability to
floods under the three factors of vulnerability (Exposure, Susceptibility and
resilience);
3. apply FVI methodology to compute Flood Vulnerability Index of
the target area.
1.3. Research Questions
This case study strives to answer the following questions:
· Do the occurrence of floods hazards relate to change in
rainfall and river discharge?
· what are the conditions which influence flood damage in
the study area ?
· what are the most vulnerable villages to flood in the
study area?
1.4. Research
Hypothesis
While the frequency and the intensity of flood hazards in the
study area may be related to change in rainfall and river discharge patterns,
interaction between the human-environment or socio-ecological system could be
the major determinant of households, and communities' vulnerability to such
hazard. Analysing trend in rainfall and discharge time series and understanding
the conditions which influence flood disaster in the study area should be
reliable information to pinpoint local hotspots of flood vulnerability.
1.5. Thesis Structure
Chapter I covers the background information, the problem
statement, the objectives, the justification, significance of the study and its
objectives and the scope of the study. Chapter II discusses the definition
of related concepts to the research topic and literature review on index
approach to measure vulnerability to natural hazards. Chapter III includes both
the research methodology and data collection process to answer the research
questions and to test the research hypothesis. Chapter IV explains the
empirical findings on the assessment of climate change, flood frequency
analysis and flood vulnerability assessment. Finally, the last chapter includes
conclusions as well as way forward for future research and the limitation of
the current study.
CHAPTER II: LITERATURE REVIEW
2.1. Hazards, Disasters, and Vulnerability
The concepts of hazard, disaster and vulnerability have been
extensively used in various disciplines with different meanings. Even for
natural hazards, such as floods, no unique definitions and assessment
procedures have been widely accepted (Pistrika and Tsakiris, 2007, p 1). Hazard
is the probability of occurrence within a specified period of time and within a
given area of a potentially damaging phenomenon (Maiti, 2007, p 10). This
definition adds both spatial and temporal components to the definition of
hazards while another definition from UNISDR (2009, p 17) refers hazard to "a
dangerous phenomenon, substance, human activity or condition that may cause
loss of life, injury or other health impacts, property damage, loss of
livelihoods and services, social and economic disruption, or environmental
damage." Hazard is, in the case of river-floods, a natural event that is
perceived as a threat and not as a resource by humans (Fekete,
2010, p 31). For the author, hazard is revealed in the state of exposure, when
the natural event actually hits the vulnerable elements. In technical settings,
hazards are described quantitatively by the likely frequency of occurrence of
different intensities for different areas, as determined from historical data
or scientific analysis.
Hazard becomes a disaster when it hits a vulnerable community.
It causes disaster when large numbers of people are killed, injured or affected
in some ways (Maiti, 2007, p 10). In the same line of thought FAO (2008, p 16)
points out that disasters of all kinds happen when hazards seriously affect
communities and destroy temporarily or for many years the livelihood security
of their members. Another definition from ISDR refers disaster to «a
serious disruption of the functioning of a community or a society causing
widespread human, material, economic or environmental losses which exceed the
ability of the affected community or society to cope using its own resources".
A disaster results then from the combination of exposure to a hazard,
socio-ecological vulnerability that are present, and the limited capacities of
households or communities to reduce or cope with the potential negative impacts
of the hazard.
Assessing and measuring vulnerability in the context of natural
hazards and climate change requires first and foremost a clear understanding of
the concept (s) of vulnerability (Birkmann, 2013, p 9 ). Vulnerability is an
important concept in human environment research, its conceptualization has been
interpreted in many different ways, according to the perception of the
researchers. The word "vulnerability" has created important links between
different research communities, particularly disaster risk management (DRM),
climate change adaptation (CCA), development and resilience research (Birkmann
,2013, p 9).
Cannon (1990) refers vulnerability only to biophysical exposure,
where vulnerability is described as a measure of the degree and type of
exposure to risk generated by different societies in relation to hazards.
Some studies found that vulnerability only refers to the
susceptibility of a given system; United Nation/ISDR (2004) and the United
Nation Development Programme (UNDP, 2004) view vulnerability as a human
condition or process resulting from physical, social, economic and
environmental factors, which increase the susceptibility of a system to be
damaged from impact of a given hazard.
Other authors, like Blaikie et al.(1994) and Wisner, et al.
(2004) relate vulnerability of a system or a community only to its capacity to
anticipate, cope with, resist and recover from the impact of a hazard.
Adger (1999) views vulnerability as a function of two
components: the effect that an event may have on humans, referred to as social
vulnerability and the risk that such an event may occur, often referred to as
exposure.
According to Chamber (1983), vulnerability has two sides: an
external side of risks, shocks to which an individual or household is subjected
to climate change and an internal side, which is defencelessness, meaning a
lack of means to cope without damaging loss.
Numerous studies define vulnerability as being a function of
exposure, susceptibility or sensitivity, coping capacity or resilience. Watson
et al. (1996), defines vulnerability as the extent to which climate change may
damage or harm a system, depending not only on a system's sensitivity but also
on its ability to adapt to new climatic conditions. Kasperson et al., (2000)
defines vulnerability as the degree to which an exposure unit is susceptible to
harm due to exposure to a perturbation or stress and the ability or lack of the
exposure unit to cope, recover or fundamentally adapt to become a new system or
to become extinct. According to Tuner et al. (2003, p 8075), vulnerability
refers to the degree to which a system, subsystem or system component is likely
to experience harm due to exposure to a hazard be it perturbation or stressor.
For Balica (2007 p 26), vulnerability is the extent to harms, which can be
experienced by a system under certain conditions of exposure, susceptibility
and resilience. For Damm, (2010), the term vulnerability is taken as a function
of exposure, susceptibility, and capacities. According to Fekete (2010, p 31),
vulnerability is both a state and a degree: everyone is vulnerable in the state
of exposure to a hazard and is vulnerable to a certain degree: vulnerability
changes in time and space and aims at identifying and explaining why the object
of research is at risk and how risk can be mitigated.
While, IPCC (2007) relates vulnerability to the character, the
magnitude and the rate of climate change and variation in addition to the
susceptibility and limited coping capacity of a system and IPCC (2012a, p 32)
shows how the concept of vulnerability has served as a guiding element to
address disaster risk in the context of climate change and climate
variability.
The similarity between all of these studies is that
they agree on the three factors that define vulnerability. Thus, the
vulnerability of a system is not only a function of exposure to hazards,
perturbations and stresses alone but also resides in the sensitivity or
susceptibility and in resilience or capacity of the system experiencing such
hazards. Birkmann (2013, p 10) reviews vulnerability concept from various
researchers and concludes that the concept of vulnerability stresses the
fundamental importance of examining the preconditions and the context of
societies and communities and elements at risk to effectively promote risk
reduction and climate change adaptation.
Based on the various views on vulnerability shown above, flood
vulnerability in the current study is viewed as the degree of experienced flood
harms under certain condition of exposure, susceptibility and resilience
factors within the human-environment systems. Therefore, flood vulnerability is
taken here as a function of exposure, susceptibility and resilience.
2.2. Flood Vulnerability
Factors
The vulnerability of any system (at any scale) is a function of
the exposure and susceptibility of that system to hazardous conditions and the
ability, capacity or resilience of the system to cope, adapt and/or recover
from the effects of those conditions (Smit and Wandel, 2006). Core factors of
vulnerability encompass exposure, susceptibility or sensitivity and resilience
or coping and adaptive capacities. Exposure generally refers to the extent to
which a unit or a system of the assessment (community, city, building) falls
within the geographical range of a hazard event (Birkman, 2013, p 25).
According to IPCC (2012a, p 559), exposure describes the
presence of people, livelihoods, environmental services, resources and
infrastructures or other valuable items in place that could be affected.
Exposure to floods could be understood, then, as the presence of valuable items
of human-environment, or socio-ecological systems that are present in
floods-prone areas. The indicators for this component can be put in two
categories; the first one covers the exposure of different elements at risk and
the second one gives details on the general characteristics of the flood. While
the first category of indicators supplies information about the location,
elevation, population density, land-use, their proximity to the river, their
closeness to inundation areas, the second category provides information about
the frequency of floods in floodplains, their duration and magnitude (Balica,
2007, p 31).
Penning-Rowsell and Chatterton (1977) defines susceptibility as
the relative damageability of property and materials during floods or other
hazardous events. According to Turner et al. (2003), susceptibility is mainly
defined by cross-scale interactions of multiple internal stresses and
perturbations. The concept of susceptibility or sensitivity is the
vulnerability factor that describes the human-environmental or socio-ecological
conditions or current state that can worsen the hazard, or trigger an impact.
So, flood susceptibility indicators evaluate the sensitivity of an element at
risk before and during a flood event
"figure 3" .
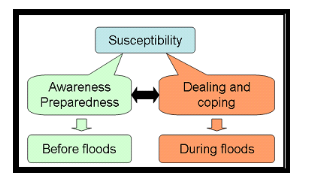
Figure 2 Susceptibility
framework
Source: Balica (2007, p 33)
Buckle (1998) defines resilience as "the capacity that people or
groups may possess to withstand or recover from emergencies and which can stand
as a counterbalance to vulnerability". According to UN/ISDR (2004), resilience
is determined by the degree to which the social system is capable of organizing
itself to increase its capacity for learning from past disasters for better
future protection and to improve risk reduction measures.
For Turner et al (2003), resilience of the system is often
evaluated in terms of the amount of change a given system can undergo and still
remain within the set of natural or desirable states.
Based on the above definitions, flood resilience can be seen as
the ability of a system or a community to mitigate or minimize threats of
floods on itself. Resilience of a system to flood disasters can only be
considered with past flood events as it focuses on elements encountered during
and after the floods "figure 4"
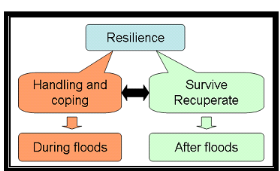
Figure 3 Resilience
framework
Source: Balica (2007, p 35)
2.3. Methodology for Measurement of Vulnerability to Natural
Hazards
2.3.1. Theoretical and Conceptual
Frameworks of Vulnerability
The different views on vulnerability are displayed in various
concepts and frameworks on how to systematize it (Birkmann, 2013, p 41). The
measurement of vulnerability requires for a model, which delivers the
structure, context and objectives of the analysis (Fekete, 2010). The different
concepts and models are essential to the development of methods for measuring
and identifying relevant indicators of vulnerability (Downing, 2004).
According to Birkmann (2013, p 62), the different conceptual
frameworks can be classified into at least six different schools of thought:
(a) school of vulnerability frameworks that is rooted in political economy and
particularly addresses issues of the wider political economy, such as root
causes, dynamic pressures and unsafe conditions that determine vulnerability.
It can be illustrated by , for example, the pressure and release (PAR) model
published in Blaikie et al. (1994) and Wisner et al. (2004); (b) school of
vulnerability that focus on the notion of coupled human -environmental systems
and are linked to a socio-ecological perspective and socio-ecology as research
school. The social-ecology perspective compared to political-economy, puts the
coupled human-environmental system at the centre of the vulnerability analysis
and stresses the transformative qualities of society with regard to nature. It
can be represented by the framework developed and published by Turner et
al.(2003); (c) school of vulnerability that sees vulnerability and disaster
risk assessment from a holistic view. It has tried to develop an integrated
explanation of risk and particularly differentiate exposure, susceptibility and
societal response capacities. A core element of this approaches is a
feedback-loop system that claims that vulnerability is dynamic and that
vulnerability assessment cannot be limited to the identification of
deficiencies. It can be represented by BBC framework published by Birkmann
(2006a); (d) school of vulnerability that emerged within the context of climate
change science and adaptation research. It focuses on exposure, sensitivity and
adaptive capacities as key determinants of vulnerability including physical
characteristics of climate change and climate variability. It can be
illustrated by (Fussel and Klein, 2006); (e) school of vulnerability that
integrates adaptation and coupling processes into a feedback-loop system and
process-oriented perspective of vulnerability. It can be illustrated by Move
framework published by Birkmann et al. (2013) and finally (f) the school of
vulnerability that combines framework of disaster risk research and climate
change adaptation represented by the IPCC SREX concept (IPCC, 2012a). It
stresses the need to differentiate the physical event from vulnerability in
order to maintain the analytic power of the concept vulnerability as a way to
show and examine the social construction risk.
Despite the different points of views reveal by the different
schools of thought, it is important to acknowledge that they also represent
some similarities, such as the understanding that vulnerability is mainly
concerned with the preconditions of a society or community that make it liable
to experience harm and damage from a given hazard.
2.3.2 Indicators for Measuring Vulnerability
Indicators are widely recognized as useful measurement tools in
distinct fields of research (Damm 2010, p 42) but researchers disagree on their
definitions. According to Gallopin (1997, p 14) indicator is defined as a sigh
that summarizes information relevant to a particular phenomenon. Some authors
(Adriaanse, 1995) define indicators in relation to an aggregation process
starting with variables or basic data, followed by processed information and
indicators, finally ending up with highly aggregated indices. While others view
them as a single variable or an output value from a set of data that describes
a system or process. According to Birkman ( 2013, p 88), defining indicator in
terms of the level of aggregation neglects an essential aspect: goals. For this
researcher, every indicator-development process needs to be related to goals,
or at least to a vision which serves as a basis for defining the state or
characteristic of interest.
The Hyogo Framework for Action (HFA) 2005-2015 stresses the need
to develop systems of indicators of disaster risk and vulnerability at national
and sub-national levels that will enable decision-makers to assess the impact
of disasters (UN/ISDR 2005). An indicator, or set of indicators, can be defined
as an inherent characteristic that quantitatively estimates the condition of a
system (Balica et al. 2012). «Indicators necessarily limit themselves to
the sphere of the measurable» (Moldan and Dahl 2007: 9). A vulnerability
indicator can be defined as a variable which is an operational representation
of a characteristic or quality of an object or subject able to provide
information regarding the susceptibility, coping and adaptive capacity and
resilience of a system (Birkman, 2013, p 87).
Vulnerability indicators are widely used in vulnerability
assessment. The first step in an indicator-based vulnerability assessment is
the selection of the study area; second, one has to select indicators based on
criteria, such as the availability of data, personal judgement or previous
research. The procedures for indicator selection follow two general approaches.
These are deductive and inductive approaches (Adger et al.,2004). In deductive
approach, indicators are selected based on relationships established from
theories and conceptual frameworks, whilst inductive approach involves
statistical procedures to relate a large number of variables to vulnerability
in order to identify the factors that are statistically significant. While a
range of widely-accepted relevant characteristics and indicators is being
presented in literature, (Adriaanse, 1995; World Bank, 2005.), the actual
conditions that determine flood vulnerability are, to a certain degree, very
site-specific, location, and hazard-dependent (Muller et al, 2011, p 2113). It
can be expressed in terms of functional relationships between expected damages
regarding all systems and exposure, susceptibility and resilience
characteristics of the affected system, referring to all the different types of
possible flood hazards (Balica, 2007).
A total of 30 indicators have been identified under the three
factors of vulnerability through various literature. Exposure and
susceptibility both have a positive influence on vulnerability, and resilience
has a negative influence on vulnerability "Table 1"
|
Table 1: Flood indicators
information
|
|
|
No
|
Defined indicator
|
Factors
|
Unit
|
Functional relationship with vulnerability
(+ or -)
|
References
|
|
1
|
Flood frequency
|
Exposure
|
year
|
Higher is the number of flood events, higher is the
vulnerability (+)
|
Balica (2007)
|
|
2
|
Flood duration
|
Exposure
|
days
|
The higher the flood duration, the higher the vulnerability
(+)
|
Balica (2007)
|
|
4
|
Flood water depth
|
Exposure
|
m
|
The higher the flood water level, the higher the vulnerability
(+)
|
Balica (2007)
|
|
5
|
Proximity of the village to the water body
|
Exposure
|
m
|
The Closer is the place to the river, the higher is the
vulnerability (+)
|
Balica (2007)
|
|
7
|
population in the flood area
|
Exposure
|
#
|
The higher the number of population, the higher the vulnerability
(+)
|
Balica (2012); Fekete (2009);
|
|
8
|
Heavy rainfall
|
Exposure
|
mm
|
The higher the value of the variance, the higher the
vulnerability (+)
|
Balica (2012)
|
|
9
|
Maximum discharge in the past ten years
|
Exposure
|
m3/s
|
The higher the discharge, the higher the vulnerability (+)
|
Balica (2012);
|
|
10
|
Land use: Farmland
|
Exposure
|
%
|
The higher the %, the higher the vulnerability (+)
|
Balica (2012); Fekete (2010); Bowen and Riley (2003)
|
|
11
|
Gender
|
Susceptibility
|
%
|
The higher the % of women, the higher the vulnerability (+)
|
Wisner et al. (2004); Haki et al. (2004); Cutter et al. (2003);
Muller et al. (2011)
|
|
12
|
Elderly
|
Susceptibility
|
%
|
The higher the % of elderly, the higher the vulnerability (+)
|
Clark et al. (1998); Muller et al (2011); Steinführer and
Kuhlicke (2007); Thieken et al. (2007); Birkmann et al. (2008)
|
|
13
|
Children under 15
|
Susceptibility
|
%
|
The higher the % of children, the higher the vulnerability
(+)
|
Schneiderbauer (2007); Cutter et al. (2003); Muller et al.
(2011); Birkmann et al. (2008)
|
|
14
|
Agriculture workers
|
Susceptibility
|
%
|
The higher the % of household having agriculture activity the
higher the vulnerability (+)
|
Fekete (2010)
|
|
15
|
Female headed household
|
Susceptibility
|
%
|
The higher the %, the higher the vulnerability (+)
|
McLanahan (1983); Snyder et al. (2006);
|
|
16
|
Literacy Level
|
Susceptibility
|
%
|
The higher the %, the higher the vulnerability (+)
|
Fekete (2010); Schneiderbauer (2007); Haki et al. (2004);
Steinführer and Kuhlicke 2007
|
|
17
|
Household size
|
Susceptibility
|
%
|
The higher the %, the higher the vulnerability (+)
|
Haki et al. (2004); Cutter et al. (2003); Muller et al. (2011);
Martens and Ramm (2007)
|
|
18
|
Number of houses with poor material (wall, roof, floor)
|
Susceptibility
|
#
|
The higher the number of houses with poor material, the higher
is the vulnerability (+)
|
Schneiderbauer (2007); Clark et al. (1998);
Cutter et al. (2003); Muller et al (2011)
|
|
19
|
Past experience
|
Susceptibility
|
%
|
The lower the %, the higher the vulnerability (+)
|
Balica (2007); Birkmann (2005a); Velasquez and Tanhueco (2005);
Wisner et al (2004); Muller (2011)
|
|
20
|
Preparedness
|
Susceptibility
|
%
|
The lower the % of people with flood experience, the higher the
vulnerability (+)
|
Balica (2012); Birkmann (2005a); Velasquez and Tanhueco (2005);
Wisner et al. (2004); Cardona (2003); Muller (2011)
|
|
21
|
Awareness
|
Susceptibility
|
%
|
The lower the % of people, the higher the vulnerability (+)
|
Balica (2007)
|
|
22
|
Emergency services
|
Resilience
|
%
|
The higher the % of people reported to get help from government
or institution during and after flood, the lower the vulnerability
(-)
|
Balica (2007)
|
|
23
|
Ability to evacuate
|
Resilience
|
%
|
The higher the %, the lower the vulnerability
(-)
|
Cardona (2003); Muller (2011); Balica (2012); Birkman et al
(2013)
|
|
24
|
Knowledge about private protection measures
|
Resilience
|
%
|
The higher the %, the lower the vulnerability
(-)
|
Muller et al (2011)
|
|
25
|
Knowledge about flood hazard
|
Resilience
|
%
|
The higher the percentage, the lower the vulnerability
(-)
|
Cardona (2003); Muller (2011)
|
|
26
|
Warning system
|
Resilience
|
%
|
The existence of warning system lowers the vulnerability
(-)
|
Balica (2007); Balica(2012); Veenstra (2013)
|
|
27
|
Recovery Time to flood
|
Resilience
|
%
|
The faster the recovery time, the lower the vulnerability
(-)
|
Balica (2012)
|
|
28
|
Emergency service
|
Resilience
|
%
|
The higher the %, the Lower the vulnerability
(-)
|
Balica (2012); Aall and Norland (2005); Veenstra (2013)
|
|
29
|
Long term residents
|
Resilience
|
%
|
The higher the %, the lower the vulnerability
(-)
|
Fekete (2010)
|
|
30
|
Environmental recovery
|
Resilience
|
%
|
The higher the %, the lower the vulnerability
(-)
|
Balica (2007)
|
2.4. The Index Approach to Study
Vulnerability
In literature, quantitative assessment of vulnerability is
usually done by constructing a vulnerability index. This index is based on
several sets of indicators that result in the vulnerability of a region. It
produces a single number, which can be used to compare different regions.
Literature on index number construction specifies that there should be good
internal correlations between these indicators.
Different methodologies have been used to compute a Flood
Vulnerability Index (FVI). All FVI equations have factors for exposure to
hazard, sensitivity or susceptibility of the people, and their resilience or
coping capacity to the hazard. Vulnerability is the result of the combination
of exposure, susceptibility and resilience.
Atkins et al. (1998) studied the methodology for measurement of
vulnerability and constructed a suitable composite vulnerability index for
developing countries and island states. Their composite vulnerability indices
were presented for a sample of 110 developing countries for which appropriate
data were available. The index suggests that small states are especially prone
to vulnerable events when compared to large states. Among the small states,
Cape Verde and Trinidad and Tobago are estimated to suffer relatively low
levels of vulnerability and majority of the states estimated to experience
relatively high vulnerability; and the states like Tonga, Antigua and Barbados
being more vulnerable to external economic and environmental factors.
Chris Easter (2000) constructed a vulnerability index for the
commonwealth countries, which is based on two principles. First, the impact of
external shocks over which the country was affected and, second, the
resilience of a country to withstand and recover from such shocks. The analysis
used a sample of 111 developing countries of which 37 small and 74 large for
which relevant data were available. The results indicate that among the 50
most vulnerable countries, 33 were small states with 27 being least developed
among them.
Moss et al. (2001) identified ten proxies for five sectors of
climate sensitivities which are settlement sensitivity, food security, human
health sensitivity, ecosystem sensitivity and water availability. They equally
established seven proxies for three sectors of coping and adaptive capacity:
economic capacity, human resources and environmental or natural resources
capacity. These proxies are aggregated into sectoral indicators, sensitivity
indicators and coping or adaptive capacity indicators and finally help in
constructing vulnerability resilience indicators to climate change.
Dolan and Walker (2003) discussed the concept of vulnerability
and presented a multi-scaled, integrated framework for assessing
vulnerabilities and adaptive capacity. Determinants of adaptive capacity
include access to and distribution of wealth, technology and information, risk
perception and awareness, social capital and critical institutional frameworks
to address climate change hazards. These are identified at the individual and
community levels and situated within larger regional, national and
international settings.
Katharine Vincent (2004) created an index to empirically assess
relative levels of social vulnerability to climate change-induced variations in
water availability that allow cross-country comparison in Africa. An aggregated
index of social vulnerability was formed through the weighted average of five
composite sub indices, which are economic well-being and stability, demographic
structure, institutional and strength of public infrastructure, global
interconnectivity and dependence on natural resources. The results indicate
that using the current data, Niger, Sierra-Leone, Burundi, Madagascar and
Burkina-Faso are the most vulnerable countries in Africa.
2.4.1.Existing Flood
Vulnerability Index
Connor and Hiroki (2005) presented a
methodology to calculate a Flood Vulnerability Index (FVI) for river basins,
using eleven indicators grouped into four components. The index uses two
sub-indices for its computation: the human index, which corresponds to the
social effects of floods; and the material one, which covers the economic
effects of floods. The purpose of the FVI is to serve as a tool for assessing
flood risks due to climate change in relation to underlying socio-economic
conditions and management policies.
An elaborated methodology to calculate FVI was developed by
Balica (2007), using indicators which aims at assessing the condition that
favour flood damages at various levels: river basin, sub-catchments and urban
area. The methodology focused on two concepts: factors of vulnerability based
on three elements, including exposure, susceptibility and resilience on one
hand, and components of vulnerability including actual flooding and
establishing the elements of a system that suffer from this natural disaster on
the other hand. The methodology has been applied at different scales and has
resulted in interesting observations as to how quantifiable indicators can
reflect backs. Balica defines vulnerability as a function of exposure,
susceptibility, and resilience.
The Seventh Framework Programme (2011) defined the FVI in terms
of the following factors: exposure, susceptibility, and lack of coping
capacity. The methodology included a step of converting the indicators into
non-dimensional units, by interpolating the maximum and minimum of the series
of data obtained. The FVI values oscillate between 0 and 1, where 1 means the
highest flood vulnerability and 0 represents the lowest vulnerability to
floods. The methodology was tested in Japan river basins and in 18 river basins
in Philippines.
Depending on the equation
used, the indicators will have to have a different format, but the result of
the FVI remains the same. The goal of the equation of the FVI is to compare
different communes to one another in overall vulnerability, but also in its
separate factors exposure, susceptibility and resilience. To make it possible
to visualize these separated factors, a summation relationship is more
useful. Also, it is preferred if the resilience is negatively formulated, and a
higher score causes the vulnerability to be higher, conform other factors. With
the chosen equation, the indicators have to be measured on a scale from 0-100%
or 0-1, like Balica et al. (2012). Then, the indicators have to be normalised.
The method of normalization has to take into account the functional
relationship between the variable and vulnerability. If the functional relation
is ignored and if the variables are normalized simply, the resulting index will
be misleading. After computing the normalized scores the index is constructed
by giving either equal weights to all indicators/components or unequal weights.
These factors are then summed up according to the equation, and the result is a
0-100% or
0-1 number for vulnerability.
CHAPTER III: RESEARCH METHODOLOGY
3.1 The area of study
3.1.1 Localisation
Mono River system is the largest river system in Togo with
catchments area of 21500 km2; it serves as eastern boundary between
the Yoto district and the Republic of Benin. The district is located in
South-Eastern Togo, North-East of the Maritime region. It is geographically
bound by latitude 6°30` and 6°60`N, longitude 1°20` and
1°35`E. It is bordered by the Haho district to the north, Bas-Mono and the
Vo districts to the south, the Zio districts to the west and Republic of Benin
to the east. The study was conducted in the downstream area of the Mono River
basin in eight villages of Sedome (Mawussou, Djrekpon, Batoe), Esse-Godjin
(Tofakope, Atikpatafo), and Tokpli (Kpodji, Tchakponou-kondji and Logokpo)
counties, in the Yoto district "Map 1" .The selected villages fall under the
hazard prone area, where populations have been affected, especially during 2010
flood event, providing then a better study population who can help us to
generate a better view on the assessment conducted.
3.1.2. Landscape, soil and
vegetation
The study area is formed by hydromorphous soils which are
rapidly saturates of water. The sand contents decreases, depending on the
closeness of the area to the river. The geology consists of the continental
shelf called the terminal plate which extends from Kouvé area to the
north-western of Sedome.
The vegetation is a savannah and is composed of the classified
and gallery forests and various grassland grasses.
The fauna consists of mammals (buffalo, warthogs, monkeys, deer,
agouti etc.) and various birds of prey, aquatic life, crocodiles and hippos.
Plateau Region
Zio District
Bas-Mono
District
Vo District
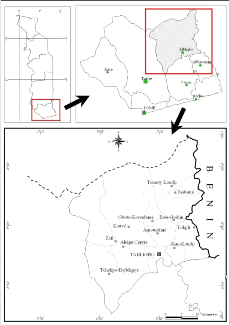
Map 1: Map showing the targeted villages
3.1.3. Climate and Hydrology
The study area, which is at an altitude that ranges from 17 to
55 meters above sea level, has Guinean sub-equatorial climate with two distinct
rainy seasons separated by dry periods which are influenced by the movement of
two (2) types of winds at different times of the year. The mean annual
temperature ranges from 22°C to 30°C and precipitation varies
between 800mm and 1200 mm/year; this usually peaks in May-June and
September-October. The Mono River has a pluvial law which has changed in the
downstream part of the basin due to the construction of Nangbéto dam in
1987 for hydroelectric purposes. Thus, it passed from the irregular to a
relatively regular flow due to the release of water of the dam. Before the
construction of the Nangbéto dam, the Mono River presented the phases of
low water with null flow and height from mid-December to the third week of May,
whereas from May until December the river experienced high flow with average
maximum of (450 m3/s) in September. This is changed after the construction of
the dam with a relatively permanent out-flow at the downstream part ( Ago et al
2005).
3.1.4. Population and
Economic Activities
The study area is made up of three
counties (Sedome, Esse-Godjin and Tokpli). According to the Togo Population and
Housing Census Report in 2010, the total population of the three counties was
estimated at about 34918 with 10803 in Sedome, 9261 in Esse-Godjin and 14854 in
Tokpli. The majority of the population is located in the River floodplains.
Agriculture is the most important activity being carried out in the area with a
majority of the people living practising subsistence farming.
The fertile soils coupled with the abundant rainfall
per year ensure ample yields of food crops. The main crops grown in the area
include maize, cassava, sugarcane, beans, groundnut, palm trees and some
vegetables.
The people in the targeted area also keep animals such
as goats, cattle, pigs and chicken. Other activities in the targeted area
include trading, fishing, palm oil production etc.
3.2. Methods
This chapter describes the methods that are used in
executing this study. Construction of vulnerability index consists of several
steps. First is the selection of study area which consists of several
villages. In each village a set of indicators are selected for each of the
three components of vulnerability.
3.2.1. Study Population and sampling
This study is carried out in eight villages (Mawussou, Drekpon,
Batoe, Atikpatafo, Tofakope, Tchakponou-kondji, Logokpo and Kpodji) from three
counties (Sedome, Esse-godjin, Tokpli) in the Yoto district, popularly known to
be associated with flood. The choice of the counties and the villages is based
on information obtained from literature and further confirmed from Togolese
Red Cross institution which is highly involved in Disaster Risk Reduction and
Adaptation to Climate Change in the Yoto district.
Data were collected through personal interviews from two
hundred and twenty one (221) households randomly sampled from the selected
villages.
3.2.2. Selected
Vulnerability Conceptual Frameworks
The current study relies on Turner et al's
vulnerability framework . It focuses only on the vulnerability part of the
framework in red "figure 5"
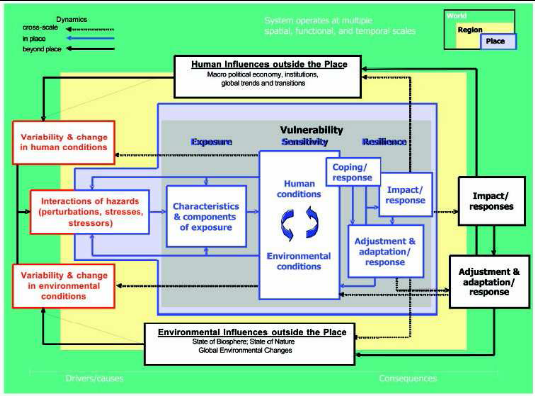
Figure 4: Turner et al's
Vulnerability Framework; Source: Turner et al., 2003, p 8076
The Turner et al's vulnerability framework is
selected for the present study for many reasons. It illustrates the
interactions involved in vulnerability analysis, drawing attention to the array
of factors and linkages that potentially affect the vulnerability of the
coupled human-environment system in a place. It facilitates the identification
of critical interactions in the human-environment system that suggest response
opportunities for decision makers. It is opened to the use of both quantitative
and qualitative data. It also illuminates the nested scales of the
vulnerability problem but provides an understanding of the vulnerability of a
particular place. This study focused on the local level `village' as a unit of
analysis. The main factors of the framework that were tackled in the present
study are presented in "figure 6".
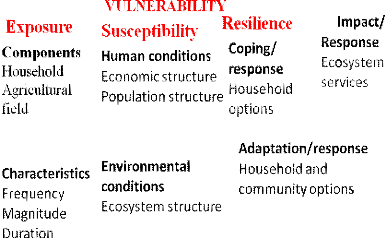
Figure 5: Vulnerability
components extracted from Turner et al., 2003 framework
3.2.3. Flood Vulnerability Indicator Development
In this study, only the deductive approaches were used to select
indicators to serve as proxies of human-environment vulnerability to flood
disasters. The field survey and interviews that were carried out in the scope
of this research showed whether the selected indicators are most relevant for
flood vulnerability analysis in the study area taking into account the local
knowledge and perception of the affected people. Those indicators which fitted
the local conditions best were combined into the composite vulnerability index
"Table 2".
Table 2: Selected
indicators for flood vulnerability
|
No
|
Defined Indicators
|
Factors
|
Abbr
|
Functional relationship
|
|
1
|
Population in flooded area
|
Exposure
|
E1
|
(+)
|
|
2
|
Women (%)
|
Exposure
|
E2
|
(+)
|
|
3
|
Children (%)
|
Exposure
|
E3
|
(+)
|
|
4
|
Elderly (%)
|
Exposure
|
E4
|
(+)
|
|
5
|
Return period ( year)
|
Exposure
|
E5
|
(+)
|
|
6
|
Flood duration (days)
|
Exposure
|
E6
|
(+)
|
|
7
|
Flood depth (m)
|
Exposure
|
E7
|
(+)
|
|
8
|
Flood magnitude (m3/s)
|
Exposure
|
E8
|
(+)
|
|
9
|
Village proximity (m)
|
Exposure
|
E8
|
(+)
|
|
10
|
Farmland in flood area (ha)
|
Exposure
|
E10
|
(+)
|
|
12
|
Education : no schooling (%)
|
Susceptibility
|
S1
|
(+)
|
|
13
|
Household size (more than 10)%
|
Susceptibility
|
S2
|
(+)
|
|
14
|
Female headed (%)
|
Susceptibility
|
S3
|
(+)
|
|
15
|
Farmers (Solely) (%)
|
Susceptibility
|
S4
|
(+)
|
|
16
|
Poor building material (%)
|
Susceptibility
|
S5
|
(+)
|
|
17
|
Household with affected land (%)
|
Susceptibility
|
S6
|
(+)
|
|
18
|
Community Awareness (%)
|
Susceptibility
|
S7
|
(+)
|
|
19
|
Household Coping mechanisms (%)
|
Susceptibility
|
S8
|
(+)
|
|
20
|
Emergency service (%)
|
Susceptibility
|
S9
|
(+)
|
|
21
|
Household Past experience (%)
|
Susceptibility
|
S10
|
(-)
|
|
22
|
Household Preparedness (%)
|
Susceptibility
|
S11
|
(-)
|
|
23
|
Warning system (%)
|
Resilience
|
R1
|
(-)
|
|
24
|
Household perception on flood risk(%)
|
Resilience
|
R2
|
(-)
|
|
25
|
Household Evacuation capability (%)
|
Resilience
|
R3
|
(-)
|
|
26
|
Household flood Training (%)
|
Resilience
|
R4
|
(-)
|
|
27
|
Recovery capacity (%)
|
Resilience
|
R5
|
(-)
|
|
28
|
Recovery Time (%)
|
Resilience
|
R6
|
(-)
|
|
29
|
Long term resident 10 years + (%)
|
Resilience
|
R7
|
(-)
|
|
30
|
Environmental recovery (%)
|
Resilience
|
R8
|
(-)
|
3.3. Data collection and Analysis
This
part describes data collection processes as well as data analysis methods.
3.3.1. Primary Data
Collection
Field work plays a very important role in collecting
primary data. By applying simple random sampling technique, information were
collected through questionnaire-based interviews at household levels and
personal observation. The questionnaires are designed based on selected
indicators developed under Turner et al (2003) vulnerability framework "Table
2". One question for every indicator under each factor is displayed "Annexe
8".
They were
obtained by directly talking to the interviewees at household level so as to
get very reliable and accurate information because they were the ones directly
affected by the flood disasters and whose livelihood was being disrupted. The
households were interviewed from their individual homes.
To ensure the primary data quality, research assistants were
recruited and trained on how to administer questionnaires and collect quality
data. They were familiar with the study area and fluent in the local language
(Ewe) and French. The questionnaires were pre-tested and edited to cover
identified gaps. The researcher and the research assistants were together in
the field during the data collection period. Additionally, supervision was done
continuously and meetings were held with research assistants on a daily basis
to address any challenges that were met during the data collection process.
3.3.2. Secondary Data
The secondary data included rainfall and river discharge data;
topographical sheet. "Table 3 ".
Table 3: Description of
secondary data use
|
Data
|
Sources
|
Zone
|
Data period
|
|
Documents, articles, reports; theses
|
Library; Different offices (e.g: MERF); Online sites
|
Mono basin; Yoto district
|
Not determined
|
|
Monthly and annual rainfall data
|
Meteorological service of Togo (DNM)
|
Tabligbo
|
1971-2010
|
|
Monthly and annual Mono Discharge data
|
Hydrological service of Lomé
|
Athieme
|
1971-2010
|
|
Topographical Sheets
|
Cartography service of Lomé
|
The Yoto district
|
IGN 1984
|
3.3.3. Data Analysis
Articles, theses, reports etc... processing consisted in the
reading of documents in order to come up with a consistent literature review.
After this first step, the trend detection analysis in the annual and seasonal
datasets was accomplished to assess climate change over the study area. In
addition, the analysis of vulnerability's determinants under exposure,
susceptibility and resilience and computation of flood vulnerability index were
carried out. Moreover, an accurate flood vulnerability maps were created using
ArcGIS techniques.
3.3.3.1. Trend Analysis of Rainfall And River Discharge to
Assess Climate Change.
This study examines trend in river discharge and rainfall in the
downstream part of the Mono basin, using Mann-Kendall statistic test. Athieme
flow gauging station (downstream) and Tabligbo rainfall gauging station were
selected "Table 4". Each station had a long record of 40 years (1971-2010) of
data to determine whether or not there have been any significant changes in
those variables over the downstream part of the river basin using Mann-Kendall
test run at 5% significance level on time series data. Available monthly
rainfall and daily river discharge data were first grouped into monthly,
seasonal and annual average data. Missing data were filled through linear
interpolation of the same months data of the contiguous years on either side of
the missing value.
Table 4: Reference of
meteorological and hydrological stations
|
Stations
|
Latitude
|
Longitude
|
Altitude
|
Creation date
|
Data period
|
|
Tabligbo
|
06°30' N
|
01°37' E
|
70 m
|
1937
|
1971-2010
|
|
Athieme
|
06°34'44'' N
|
01°39'53 E
|
8.2 m
|
1944
|
1971-2010
|
- Mann-Kendall Test
Mann-Kendall test was formulated by Mann (1945) as non-parametric
test for trend detection and the test statistic distribution was given by
Kendall (1975) for testing non-linear trend and turning point. This test, is
widely employed in various studies to ascertain the presence of statistically
significant trend in hydrologic and climatic variables with reference to
climate change (Yu et al.1993; Douglas et al. 2000; Hess et al.2001; Burn and
Elnur 2002; Yue et al. 2003; Burn et al.2004; De Toffol et al., 2008; Singh et
al. 2008). There are two advantages of using this test. First, it is a
non-parametric test and does not require the data to be normally distributed.
Second, the test has low sensitivity to abrupt breaks due to inhomogeneous time
series. According to this test, the null hypothesis H0 assumes that there is no
trend and under the alternate hypothesis, it is assumed that a significant
change has occurred over time, or that an increasing or decreasing trend is
evident in the time series.
In this study, trend analysis has
been done by using non-parametric Man-Kendall test together with the Sen's
Slope Estimator (Qi) for the determination of trend and slope magnitude to
find out the annual and monthly variability of rainfall and discharge data over
the Mono basin.
The null hypothesis is tested at 95% confidence level for both
rainfall and discharge data. If the p value is less than the significance level
á (alpha) = 0.05, H0 is rejected. Rejecting H0 indicates that there is a
trend in the time series, while accepting H0 indicates no trend was obtained.
Positive value of Qi indicates an upward or increasing trend and
a negative value of Qi gives a downward or decreasing trend in the time series.
Statistical Mann-Kendall test and Sen's Slope Estimator Test were performed,
using Addinsoft's XLSTAT 2014 software.
3.3.3.2. Analysis of the determinants of communities'
vulnerability to flood
1) Analysis of Flood Characteristics
a) Flood frequency and magnitude
analysis
The magnitude of an extreme event is inversely related to its
frequency of occurrence, very severe events occurring less frequently than more
moderate events (Maiti, 2007, p 44). The objective of frequency of occurrence
is obtained through the use of probability distributions. Some of the commonly used probability distributions
are: Gumbel's or Extreme Value type 1 distribution (EV1); Log-Normal
distribution; Log-Pearson type III distribution (LP3), and Method of plotting
position.
For this study, further insight into flood frequency is provided
by the return period analysis. The return period was obtained using the most
efficient formula for computing plotting positions for unspecified
distributions and now commonly used for most sample data: the Weibull equation
(1). The objective of the method is to build the relation between the
probability of the occurrence (return period) of a certain event and its
magnitude. Frequency is how often an event of a given magnitude may be expected
to occur in the log-run average.
The annual peak discharge data of the Mono River at Athieme
station (1971-2010, N= 40 years) is selected for flood frequency analysis. A
simple technique was to arrange the given peak in descending order of magnitude
and assigned an order number (m). The probability of occurrence for each observation is
given by:
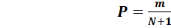
 (1) (Sreyasi Maiti 2007, p 45)
Where: P= Probability of occurrence; m= order number of the
event; N= Total number of events in the data; The return period for each
observation was determined using the following formula:

 (2) (Sreyasi Maiti 2007, p 45)
Where: T = return period (Recurrence interval or frequency)
Depending on the flood peaks recorded in 2010 for the study area
and the average flood peaks for the examined period, floods are classified
according to their magnitude.
b) Flood duration and flood water level
assessment
Data on flood duration and flood water levels were obtained from
each household from interview. The interviewed household could recall the peak
duration of flooding during the latest more severe flood (2010). The average
days recorded from household interviews was calculated for each village. Flood
water levels were measured inside the house as revealed by marks on building
walls with reference to the ground floor during the interviews. Only houses in
the main village (populated area) were considered. The flood water levels were
ranged from the lowest level to the highest level for each village.
3.3.3.3 Analysis of
human-environmental condition
Statistical analyses were used as the methods for
human-environmental condition components analysis. It includes descriptive
statistics to describe all the data in general.
3.3.3.4 Computation of
Flood Vulnerability Index (FVI)
The collected data were arranged in the form of a
rectangular matrix with rows representing villages and columns representing
indicators. In order to obtain figures which are free from the units and also
to standardize their values, the indicators were normalized so that they all
lie between 0 and 1. After computing the normalized scores the index is
constructed by giving unequal weights to all indicators.
1) Normalisation of
Indicators Using Functional Relationship
Two types of functional relationships are possible:
vulnerability increases with increase (decrease) in the value of the
indicator. The study used then two formula to normalise indicator, depending on
their functional relationship with vulnerability. Then, in case that the
indicator has an increase functional relationship with vulnerability (positive
indicators), the normalisation is done using the following formula:
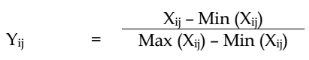
(3)
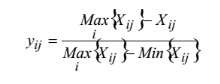
On the other hand, in case that the indicator has a decrease
functional relationship with vulnerability (negative indicators), the
normalized score is computed using the formula:
(4)
Xij denotes the value of j indicator (j=1, 2, .........30) in the
i village (i=1, 2-, ....8).
Yij is the matrix corresponding to the normalised score;
Wj and Yij lie between 0 and 1; Ó Wi = 1
It is obvious that the scaled values of Yij lies between 0 and
1. The value 1 corresponds to that village with maximum value and 0
corresponds to the village with minimum value. Through those formula the
normalised scores for each indicator were obtained using MS-EXCEL Max() and
Min() functions.
2) Method of Weighting
and Aggregation of Indicators into Vulnerability Index
After computing the normalized scores, the index is
constructed by giving an unequal weight to all indicators. In literature,
several methods are used to give weight to indicators either equal weights
(simple average of the scores and Patnaik and Narain Methods) or unequal
weights (Expert judgement and Iyengar and Sudarshan's methods) or multivariate
statistical techniques (Principal components and cluster analysis method).
The present study uses an unequal method of Iyengar
and Sudarshan's to give weight to all indicators. Iyengar and Sudarshan (1982)
developed a method to work out a composite index from multivariate data and it
was used to rank the districts in terms of their economic performance. This
methodology is statistically sound and equally suited for the development of
composite index of vulnerability to climate change. In Iyengar and Sudarshan's
method, the weights are assumed to vary inversely as the variance over the
regions in the respective indicators of vulnerability.
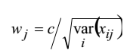
That is, the weight wj is determined by:
(5)
where c is a normalizing constant: equation 6
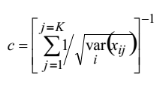
(6)
The choice of the weights in this manner would ensure that large
variation in any one of the indicators would not unduly dominate the
contribution of the rest of the indicators and distort inter regional
comparisons. It is well known that, in statistical comparisons, it is more
efficient to compare two or more means after equalizing their variances.
The overall village index, Yi , also varies from zero
(0) to one (1) with 1 indicating maximum vulnerability and 0 indicating no
vulnerability at all. the higher the district index, the more the level of
vulnerability .
The composite indicator for flood vulnerability factors
(exposure, susceptibility and resilience) for the ith village was
obtained as:
Yi= ?Wj Yij
(7)
where: Yi is the composite indicator of ith village;
Wj is the weight for each indicator lies between 0 and 1; ?Wj= 1; and Yij is
the normalised scores of indicators.
To ensure that the indices calculated for each vulnerability
factor can be compared, the sum for each factor of exposure, susceptibility and
resilience are divided by their respective number of indicators that describe
each vulnerability factor. The composite vulnerability index for exposure
factor is given as:

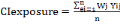 (8)
(8)
Where: 
 is the composite vulnerability index of exposure factor,
Wj is the weight a single indicator, ei is exposure indicators;
Yij is the normalised value of exposure indicator; n is the number of
indicators.
Susceptibility and resilience factors can all be represented in
similar way.
Any flood vulnerability analysis requires information regarding
these factors, which can be specified in terms of exposure indicators,
sensitivity indicators and resilience indicators. Finally, the vulnerability of
a system to flood events can be expressed with the following general equation
(Balica, 2007, p 37). This equation is used in the present study to compute
Flood Vulnerability Index (FVI).
Vulnerability = Exposure + Susceptibility -
Resilience (9)
3.3.3.5. Flood vulnerability maps
The composite index values of the three factors
of vulnerability and total flood vulnerability index values were integrated in
ArcGIS 10.1 software with all relevant input data being available in a digital
spatial database (polygon shape file) to produce exposure, susceptibility,
resilience and vulnerability maps. The maps were classified and colour coded
green-yellow-red, indicating low-moderate-high areas, respectively.
CHAPTER IV: PRESENTATION AND DISCUSSION OF RESULTS
This chapter presents and discusses results of the research
based on the primary and secondary data collected. The results presented in
this chapter have been arranged in sections which include finding on trend in
rainfall and river discharge of the study area, determinants of vulnerability
and Flood Vulnerability index and mapping of vulnerable areas results.
4.1. Empirical Finding on Trend and Variability Analysis
4.1.1. Precipitation Time Series Analysis
Statistical properties of the annual and monthly rainfall series
were tested and presented in "Annexe 1". The result shows that April, May, June
and October represent the smallest Coefficient of Variation (CV): 0.486, 0.388,
0.353, and 0.439, respectively which means that they were the homogenous months
in terms of rainfall variations during the period of record. On the other hand,
December, January and February show the largest CV with 2.122, 1.586 and 1.06,
respectively. The rest of the months present similar rainfall pattern
representing similar variation during the study period. The annual maximum
rainfall occurred in the year 1999 with the total precipitation of around
1341.5 mm approximately and the minimum rainfall occurred in the year 1977 with
the total of around 674 mm.
On running the Mann-Kendall test on precipitation data, the
Sen's slope shows an evidence of a positive trend in annual series. The rate of
annual rainfall change is about 3.434 mm/year. The result indicates that the
null hypothesis was accepted for the annual rainfall trend (p-value= 0.159).
Thus, statistically significant positive trend is not found for annual rainfall
over the time period.
On plotting the linear trend line for the 40 years rainfall
data, the following results in "Figure 7" were obtained.
Annual rainfall-plot
y = 3.434x + 943.6
R² = 0.053
Rainfall (mm)
Linear fit
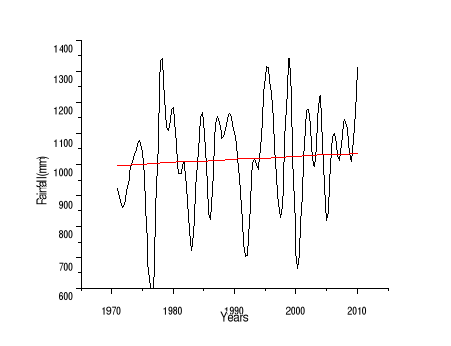
Figure 6: Linear trend line
corresponding to rainfall data (1971-2010:Tabligbo station)
The "figure 7" represents the graph for the twelve (12) months
average rainfall for the time period (1971-2010). It shows two peaks in the
year one in June (159.647mm) and another one in October (130.06 mm) which
reveals the bimodal pattern of rainfall in the study area.
Monthly Average Rainfall
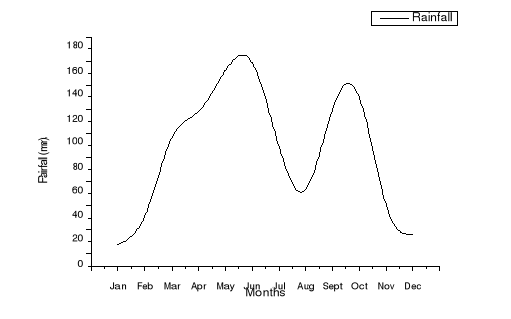
Figure 7: Monthly Average
Rainfall (1971-2010)
In the Mann-Kendall test, the Sen's slope estimator reveals the
trend of the series for 40 years for individual 12 months from January to
December which are -0.073, -0.560, -0.069, 0.353, 0.285, 1.134, 0.980, 0.153,
-0.480, 1.307, 0.699, and -0.191, respectively. For April, May, June, July,
August, October and November, there is an evidence of a rising trend while the
result is displaying negative trend in January, February, March, September and
December. Thus Sen's slope estimator shows a positive trend for eight months
and for other four months it shows a negative one representing almost
non-significant condition. The Null hypothesis was accepted for all the twelve
(12) months "annexe 2". Therefore, statistically significant trends are not
found for precipitation on monthly basis, at 95 % confidence level, even though
there are negative and positive trends for the record of period (1971-2010)
considered.
Annual Rainfall Cumulative Deviation
Figure 8: Annual rainfall cumulative deviation
(1971-2010) (Tabligbo station)
To be able to determine normal, wet and dry years, cumulative
deviation from mean of rainfall pattern were computed for the periods of
record. "The figure 8" reveals that a cyclic pattern of variations with
alternating drier and wetter years is suggested. Two main phases of different
lengths were detected (1971-1977 and 1978-2010). The first phase covering eight
(8) years shows six negatives anomalies that let to conclude a dry phase. It is
followed by a long period from 1978-2010 characterized by variations with
alternating drier and wetter years. This result explains rainfall variability
over the study area during the period under examination.
4.1.2. Discharge Time
Series Analysis
Trend analysis of the downstream part of the Mono River basin
has been done also with 40 years of river discharge data from 1971 to 2010.
Statistical properties of the annual and monthly flow series were tested and
presented in "annexe 3". The results show positive skewness which means the
data were normally distributed. According to the results, all the individual
months show the largest CV representing similar variation during the study
period. The annual average discharge for these 40 years is 114.985
m3/s. During the record period,
the maximum discharge occurred in the year 2001 with the total
discharge of 262.408 m3/s approximately and a minimum discharge in
the year 1984 with the total of around 19.09 m3/s.
On running the Mann-Kendall test on river discharge data, the
Sen's slope shows an evidence of a positive trend in annual series. The rate of
annual rainfall change is about 2.462m3/s/year. The result indicates
that the null hypothesis was rejected for the annual discharge trend (p-value=
0.002) "annexe 4". Thus, statistically significant positive trend is found for
annual river discharge over the time period.
On plotting the linear trend line for the 40 years river
discharge data, the following results in "Figure 9 " were obtained.
Annual discharge plot
Discharge
Linear fit
Y= 2.625x + 61.173
R2 = 0.2706
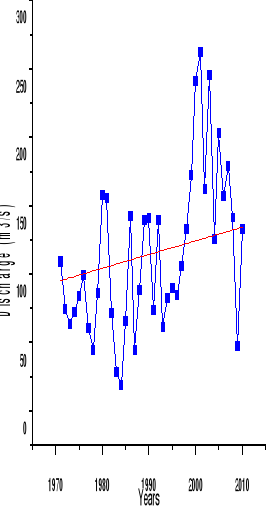
Figure 9: Average annual
discharge variation (1971-2010)
The "figure 10" shows the monthly discharge distribution of 40
years. It shows one peak in September (333.442 m3/s)
Monthly Average Discharge
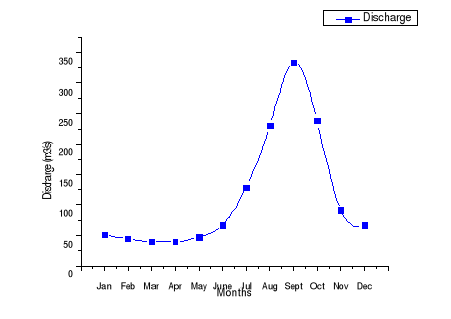
Figure
10: Monthly discharge Average(1971-2010)
In the non-parametric Mann-Kendall test, monthly
trends of river flow for 40 years have been calculated for each month
individually together with the Sen's magnitude of slope (Q). The Sen's
slope reveals the trend of the series for 40 years for individual 12 months
from January to December which are 2.653, 2.13, 2.233, 2.031, 2.289, 0.910,
-1.354, -3.391, -4.697, -0.047, 2.295, and 3.433 respectively. While
July, August, September and October show an evidence of negative trend, the
others months show evidence of positive trend. The Null hypothesis was accepted
for July, August and October months and rejected for the others months "annexe
4".
Annual Discharge Cumulative Deviation
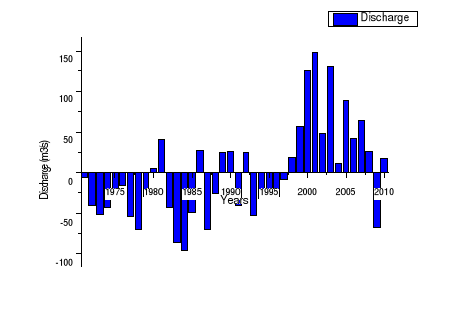
Figure 11: Annual discharge
cumulative deviation (1971-2010)
The "figure 11" shows the cumulative deviation from mean that
reveals a cyclic pattern of variations with alternating low and high discharge
years. Three main phases of different lengths were detected (1971-1978,
1979-1997 and 1998-2010). The first phase shows negative anomalies that let to
conclude a low discharge phase. It is followed by a period (1979-1997)
characterized by variations with alternating low and high discharge years. The
last period (1998-2010) shows a phase of high discharge years. This result
explains river discharge variability over the study area during the period of
record.
The application of the trend analysis reveals an overall upward
trend in annual rainfall and river discharge. It is well known that rainfall is
one of the major inputs into runoff processes while river discharge shows a
composite response of the whole basin. The upward trend in the two variables
may show a causal effect of rainfall on river discharge and an evidence of
climate variability. The evidence of positive trend in the river discharge and
the rainfall characteristics suggest that the study area may be exposed to
either river flood or flash flood.
The result equally shows that even though there is an evidence
of upward trend in annual rainfall and river discharge in the study area , the
trend in the rainfall series is not significant compared to the one of the
river discharge. This may be explained by these studies (Rossi 1996, Klassou
1996, Amoussou and al.2012, ) which show that the Mono River is under the
influence of downstream and upstream rainfall and besides, under the effect of
the Nangbéto dam put in service since 1988 for hydropower production
reasons which confers to the river an artificial character at the downstream
part. According to the interview carried out in the scope of this study, the
increase of flood hazards in the area is not only due to change in
precipitation patterns causing overflow of the river but also to man-made
actions such as: the regular opening of Nangbeto dam at the upstream of the
basin. Clearly, flood hazard in the study area is a natural phenomenon which
was exacerbated by anthropogenic factors.
From the result, river flood peaks may occur in September. The
increase of river discharge causing flood hazards in the study area calls up
the need to describe past floods magnitudes in order to predict design floods
for the targeted area. To this end, calculation of the return period as well as
the probability of occurrence of past flood magnitude to estimate the likely
values of discharges to expect in the river at various recurrence intervals
based on the available historical record was carried out.
4.2. Determinants of
Communities' Vulnerability to Floods
4.2.1. Flood Frequency and Magnitude Analysis
The maximum instantaneous flow of 736.70 m3/s was
recorded at Athieme during the 1999/ 2000 hydrological year while the lowest
flood flow of 69.16m3/s was recorded in 1983/1984 hydrological year.
The 40-years mean instantaneous maximum flood flow is 372.34m3/s
with a CV of 40.6% and a standard variate of 182.757m3/s "table
5". The coefficient of variation was applied to measure the consistency and the
steepness for the frequency curves in the river flow data. The CV value
obtained indicated that the distribution of flood flows was not highly
variable.
Table 5: Annual Maximum
flow basic statistics
|
Basic statistics
|
Values
|
|
Mean
|
372.34
|
|
Maximum
|
736.70
|
|
Minimum
|
69.16
|
|
Std. Deviation
|
182.757
|
|
Coef. of Variation (CV)
|
0.491
|
|
Skewness
|
0.406
|
The return period and the probability of occurrence for each
observation of the Mono River have been computed, using Weibull's formula, for
the period 1971- 2010 which generally starts to peak in the month of July with
the maximum in the month of September. according to flood hydrology data of
Athieme station.
The Mono River discharge at the downstream reveals that
the study area has been affected 22 times by low intensity flood with return
periods of 1 or 2 years with high probability of occurrence. The low intensity
is ranged between (69.16-372.33m3/s). The study area experienced
nine times moderate intensity flood with return period of 2, 3 or 4 years with
probability of occurrence less than 50% and magnitude between (372.34-549.64
m3/s). The study area was challenged with high flood event nine
times ranging between (549.65-736.70 m3/s) "figure 18" and "table
6".
The latest more severe flood for the downstream part of the
Mono basin is the one that occurred in 2010. Its return period is 5 years and
the probability of occurrence of the 2010 flood (as a same magnitude) would be
once in five years (Probability=0.22) "annexe 5". During the period, the
recurrence interval of high flood based on the 2010 flood magnitude has ranged
from 5 to 41 years. There are eight recurrence intervals covering a total
period of 40 years between the first and the last occurrence of high flood
events.
Low hazard
High Hazard
Moderate hazard
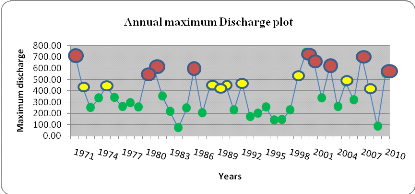
|
Discharge
|
Frequency
|
Magnitude of flood
|
|
549.65-736.70
|
9
|
High
|
|
372.34-549.64
|
9
|
Moderate
|
|
69.16-372.33
|
22
|
Low
|
Figure 12:Flood Frequency
and Flood Magnitude
4.2.2 Flood Duration and Flood Water Level
Assessment
The water level as well as flood duration were
different for the targeted villages "table 7". The result reveals that the
higher the flood water level, the higher the flood duration.
It was noticed that villages such as Kpodji,
Tchakponou and Logokpo have the highest flood level and highest flood duration
although they are the most distant of the Mono River. This can be explained by
the fact that these villages are surrounded by Mono River's sub-branches. They
are not directly inundated by the Mono river itself but rather by the Mono's
sub-branches. Then, when water comes from all the sub-branches, the total areas
is highly inundated. In addition, the area is made up by heavy soil which can
decrease the flood water infiltration capacity and increase the duration of
flood water in the area.What about the soil types in the affected
villages?????
Table 6: Depths of flood
water (2010) as revealed by marks on building walls and average flood duration
(2010) from household
|
Flooded areas
|
Depth of flood marks on walls (2010)
|
Proximity to the river body (m)
|
Flood duration (days) (2010)
|
|
Djrekpon
|
63- 99cm
|
470.35
|
58
|
|
Batoe
|
50-118 cm
|
303.79
|
82
|
|
Logokpo
|
70-100cm
|
909.28
|
88
|
|
Tchakponou
|
50-106cm
|
626.13
|
80
|
|
Kpodji
|
57-170 cm
|
1874.22
|
95
|
|
Tofacope
|
30-45cm
|
112.54
|
41
|
|
Atikpatafo
|
65- 70 cm
|
165.55
|
71
|
|
Mawussou
|
45-65cm
|
435.55
|
51
|
In addition, all the eight surveyed villages lie in
the low altitude level of the Yoto district comprised between (12-58m) which
makes them to be highly exposed to flood hazards "Map 2".
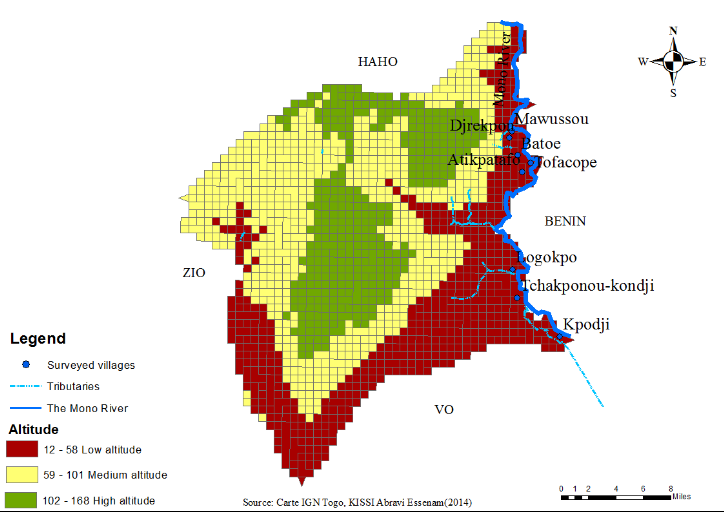
Map 2: Map of Yoto district
showing the surveyed villages in low altitude
4.2.3. Elements at Risks
The study focuses on two main elements at risks: households and
their agriculture croplands. The total population from the surveyed sample is
about 2124 composed of children, young, elderly, and adult. 42.74% of the total
population are children, 4.61% are elderly and 17.14% are women. As it is shown
in various studies and confirmed by the majority of the respondents 72.36%,
women, children and elderly are considered as the most exposed to flood due to
their fragility. The little high proportion of children under 15 years in the
study area may increase the communities' vulnerability to flood disasters.
Based on information collected through the simple random survey,
it was found that those surveyed households were having agriculture croplands
of about 506 ha of which the majority is very closer to the river body (less or
equal to 200m). The crop production activity in the study area depends on
rainfall and practices which is still traditional with rudimentary tools.
Farmers are faced with problems of storage and preservation of harvested crops.
Thus, when flood came, before and even after harvesting period, the majority of
crops are destroyed.
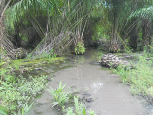
Photo 1: Oil palm farm under water since the 2010
flood, Photograph taken during field work
4.2.4. Assessment of
communities' vulnerability : Human-environmental conditions
This section consists in identifying the different
characteristics of a Human-Environment system which would make the surveyed
villages vulnerable to floods.
4.2.4.1. Socio-Demographic
Characteristics of Households
The total sample comprised of 221 respondents who were
household heads. The social demographic features of households are as shown in
(Table 7). The majority of the respondents were male (86.9%) while females
constituted 12.2%. Most of the respondents were aged between 40 and 59 years
(47.1%). The level of education was assessed because it was an important
factor in understanding household vulnerability to disasters. The majority of
the respondents (39.8%) attained only primary education as their highest level
with 38.9% having no schooling at all. 14.5% had secondary level education and
only 0.09% had attained tertiary level of education. The majority of the
households heads are married (90.5%) with 7.2% of widowed. Most of households
that is 62.90% had more than 10 members.
4.2.4.2 Location of
settlement and type of construction
The location of settlements in the targeted area led to increase
household vulnerability to flood disasters. As observed during the field
survey, most of the settlements are located near the river as the river is the
main source of water in the study area. The proximity to the river body
facilitates the access to water for their various activities.
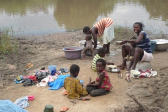
Photo 2: Use of water in the community, Photograph
taken during field work
The field survey carried in the scope of this study shows that
the vulnerability of the building structure depends on the building materials.
A total sample comprised of 221 respondents were household heads .The majority
of the households interviewed (74.7%) lived in building made up of clay walls
with thatched roof. Of the households, 13.1% lived in clay walls with
iron/tiles sheet roof's building, while 4.5% and 5.9% of the respondents lived
in brick walls with iron/tiles sheet roof and hurdle or banco walls with
thatched roof buildings, respectively. The majority of households therefore
lived in the type of houses that make them susceptible to floods.
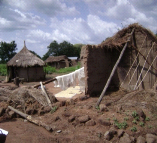
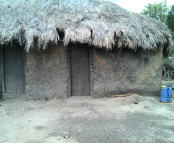
Photo 3: House made in Banco and straw Photo
4: House made by clay wall with destroyed by the 2010 flood in Tokpli county
thatched roof, Photograph taken during Source: PDNA, 2010
field work
4.2.4.3. Livelihood patterns of respondents
The socio-economic status of this community constitutes another
source of vulnerability. The social economic status of households is an
important factor in assessing their vulnerabilities to disasters (Wisner, et
al. 2004:12). Almost all people of the community in the study area depend on
agriculture. The interview reveals that the main source of income for the
assessed households are agriculture activities (crop production) 90% and 7.2 %
of respondents who do not have agriculture as main activities have it as
secondary activities. 65.05% of the total respondents depend solely on
agriculture activities. Most of the surveyed households have a limited
livelihood options, for most of them indicate having no secondary livelihood
sources. Those who have a secondary activity mention second livelihood sources
such as trading, breeding, fishing, hunting, palm oil production.
The marital status of household head played an important role in
determining the livelihood strategy. Those who are married have a diversity of
livelihoods as opposed to singles, and widowed household heads "figure ".
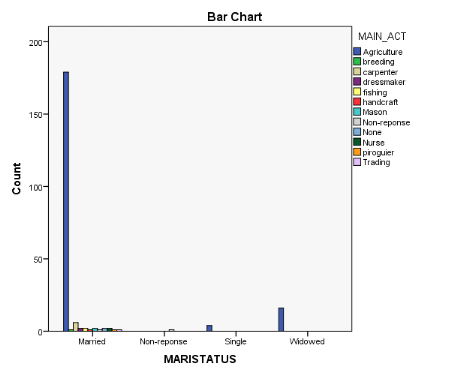
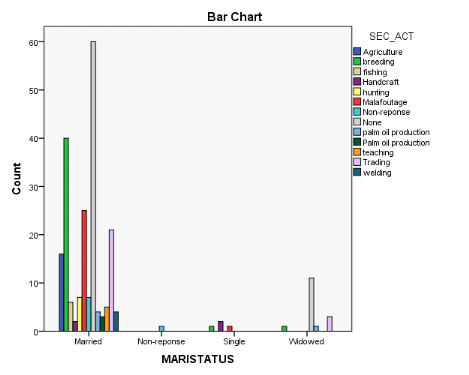
Figure 13: Livelihood Strategies by Marital Status of
Heads of Households
4.2.4.4. Awareness and impacts of flood
The awareness to flood hazards may raise the attention of
population on how to manage flood risks. According to the key informants (NGOs
and Public institutions) that were interviewed in the field, the occurrence of
flood in the area does not take the residents by surprise because even though
it is a natural phenomenon, the residents know when the river may overflow and
they received warning on radio and through the sign posts implanted to
indicate the water level. Equally, they are aware of flood-related risks in the
area. The analysis shows that the majority, 94.1% is aware of the flood risks,
while only 4.5% said they are not aware. A majority of the households (84.6%)
said they had warnings about the threat of flood and how to handle its effects,
while 13.6% said they did not have any prior warning about the impending threat
of flood. Looking at the 2010 flood which was exceptional in the area according
to the population, 86.9% were aware of the 2010 flood occurrence while only
9.5% said they were not aware.
Regarding the different ways for passing information on flood
threat, 77.8% of the total respondents said they received information by
radio, while 2.7% and 0.09% said they received warnings about floods by
traditional ways and through volunteers of the Red Cross, respectively.
Furthermore, despite the threats caused by flood in those communities, they
still live in the same area for several reasons. The majority of the
respondents (47.5%) reported they have nowhere to go, 22.2%, 12.7%, and 8.6%
reported respectively that it is hard to find farmland elsewhere, that the
lands are for their ancestors, and the lands of the area are fertile.
In terms of the impact of 2010 flood, 96.4% of the
respondents had been affected in various ways (loss of crops, destruction of
houses, loss of animals, loss of important assets etc.) and 2.7% said they had
not been affected.
4.2.4.5 Environmental
conditions
The extent of environmental degradation has also an important
role to play in exacerbating community vulnerability. The field survey revealed
that the study area is subjected to the fragmentation of the river bank digging
and widening the river channel, the soil degradation "photo 6 and 7" and
removing of vegetation along the river bank which leaves the soil exposed and
increase surface runoff and then flood extent. AGO et al (2005) observed that,
the soil degradation, the deforestation of the floodplain, the increase in the
number of human settlements in the river boundary increases the vulnerability
of population to flood hazard.
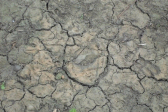
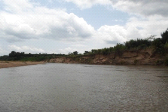
Photo 5: Dehydrate soil in Batoe village,
Photo 6: Mono River bank fragmentation Photograph taken during field work
in Mawussou village, Photograph taken during field
work
4.2.4.6. Household coping
mechanisms
The occurrence of flood hazard affects people in different ways.
The affected people are forced to employ coping strategies. Various
preparedness and coping mechanism are adopted by the surveyed households.
Advanced preparation, training and planning will facilitate the evacuation
processes (Ekotu, 2012:101). The majority of the respondents of the total
sample (58.4%), reported they employed preparedness measures to reduce flood
impact and (48%) have used reactive measures to cope during. They employed
pro-active measures such as the use of short cycle seeds (6.3%), early harvest
(13.1%), preparation of evacuation place (9%), protection of food supply (5%),
putting of important assets in safe place (12.2%). Respondents reported to
employ reactive measures, such as tire track (1.8%), sandbag track (11.8%),
backfilling with sand (22.6%), backfilling with palm kernel shells (5.9%), and
pumping (0.09%). The use of those pro-active measures as well as the reactive
measures by the population were confirmed by Red cross institution of the Yoto
district that is highly involved in disaster risk reduction in the targeted
areas.
During and after flood disasters, most of households do not have
any assistance from government and there is no policy to help the communities
out. Each household, then, relies on itself and on their families and relatives
in non-flooded area to cope with flood.
Despite the existing anticipatory information in the study
area there is no adequate strategy to increase population's resilience to flood
disaster. This calls to think on alternative solution to increase adaptive
capacities of population. According to the key informant interview, population
in vulnerable areas should firstly change their mentality in order to accept
their relocation in a safe areas, they should build strong houses and adopt an
appropriate agricultural practices adapted to their area and the use of short
cycle seeds to increase their resilience.
4.2.4.7. Anticipative measures of
flood occurrence
The anticipative measures play a great role in the reduction of
flood impacts. The field survey reveals some anticipative measures used by the
population to predict the occurrence of flood. The population combines sign
post markers to control the level of water with local indicators of flooding
(massive presence of ants coming out from ground, and snail climbing trees,
transport of mud, presence of hippopotamus and some type of bird so called
"Tolem" in local language) to anticipate the occurrence of flood. The majority
of the respondents of the total sample (82.8%) reported they are aware of
anticipative measures such as local indicators (78.7%) and sign post marking
possible flooding levels (4.5%)
Low level
Medium level
High level
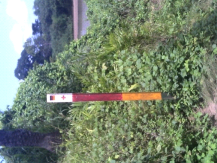
Photo 7: Implantation of Sign post marking possible
flooding levels
(Early Warning system)
4.2.4.8. Training on flood hazard
management
In terms of training on flood hazard management, 82.8% of the
total respondents said they have received some training on flood hazard
management while, 14% have never received any training . Of those who have some
training, 1.8% indicated they received information on how to control river
water level, 20% reported they received information on hygiene and water
purification measures, 12.21% reported they received information on local
indicators and a small number 3.1% said they were informed on evacuation
areas.
4.2.4.9. Household recovery time and positive effects of
flood on household
The majority of respondents (36.2%) said it takes long time for
them to recover from flood disasters, while 24.9% reported they recover quick
from flood disasters. 75.11% of respondents of the total sample said flood had
no positive effects on their household while 24.9% reported flood had some
positive effects on them. Of all those who reported having experienced positive
effect of flood, 11.31% said their farmlands become more fertile after flood,
7.2 % said they experienced increase of crop yield after flood, 4.07% said they
were able to practice garden activity after flood because the soil become
suitable for such activity and a small number 2.3% said they experienced
increase in fish population, which is good for fishing activity.
4.2.5 Household adaptation options
4.2.5.1 Household's perception of Government and NGOs
role in flood management
The perception of households on the role of Government and NGOs
in flood management was assessed, based on the three phases of disaster
management cycle. The majority (15.83%) of the total respondents interviewed
indicated that government and non government organisations should increase
awareness and educate people about the causes, risks and warning signs
of floods; 11.31% said government and NGOs should build dams
and reservoirs or dikes and levees, and health centres. Others
reported that government and non government organisations should build
retaining ponds, flood channels, safe heaven places, construct roads,
distribute boats; install more sign posts marking possible flooding levels in
the community, plant trees along the river bank and control of Nangbeto dam
opening, as mitigation and preparedness measures to control flood disasters. As
response measures during flood, the majority (54.30%) of respondents reported
that government and NGOs should assist the affected communities with food and
non-food -items, however 36.20% and 9.50% said the government and NGOs should
take appropriate measures to evacuate affected people in the
safe havens and provide health assistance. 52.03% respondents of the total
sample reported government and NGOs should provide seeds, fertilizers and
animals; 13.57% suggested assisting people in returning to their home and
distribution of building materials while 11.31% said government and NGOS should
provide advice and training to flood victims and 9.50% proposed to assist
affected people with financial support for their recovery after floods.
4.2.5.2. Household `s perception
of communities role in flood management
A part from the role of government and NGOs in flood management,
the interviewed households recognized the role of communities in managing flood
disasters. 33.94% reported they should adopt early harvest option in order to
reduce impact of flood on their livelihood; 22.63% said the importance of
planting trees in reducing flood extent, while 13.57% reported they should
install collective food storage in order to assist affected
people with food items. Others suggested diversification of economic activities
(11.31%), group farming (7.24%); building of strong house (3.16%), avoiding
cultivation close to the river (2.26%), flood management committee (2.26%),
collective saving (3.62%).
To sum up, besides the extreme variability in terms of flood
magnitude and frequency in the Mono River in the study area, which may be due
to the increasing in the precipitation and the river discharge patterns, the
proximity of the villages and the closeness of households' farmlands to the
river body, the type of construction and the position of settlements, the
structure of the populations (high number of children; high household size),
low level education of household, the lack of the diversification of livelihood
strategies, the lack of adequate flood warning system and lack of willingness
and ability to take responsive actions coupled with inadequate emergency
services during and after flood, may increase the communities' vulnerability to
flood disasters.
The low level education coupled with the limited livelihood
strategies and the low incomes have resulted in poor agricultural practices. In
addition, since the crop production is the main source of income and food added
to the high number household member, increased exposure to floods will
exacerbate the population vulnerabilities to flood hazards by compromising
their food security. This situation proves that the research hypothesis is
verified.
4.3 Computation of Flood
Vulnerability Index
The Flood Vulnerability Index (FVI), in the present study,
aimed to identify the most vulnerable village related to flood events in the
three selected counties in the downstream area of the Mono River basin in the
Yoto district.
4.3.1 Identifying key indicators of developed FVI
Thirty (30) indicators were used in the present study. Those
indicators were categorised under the three factors of vulnerability and were
included in the FVI computation.
4.3.2. Normalised Scores and Weight Values of Indicators
A system at risk is more vulnerable when it is more exposed to a
hazard. However, it will be less vulnerable the more resilient it is. From the
vulnerability equation, high exposure and high susceptibility lead to
increases in vulnerability. On the other hand, high resilience levels
decreases vulnerability. To this end, the normalization method takes into
account the functional relationship between the variable and vulnerability in
order to avoid misleading issue in the construction of the indices. The
normalised values of each indicator is given in annexe (6). Iyengar and
Sudarshan (1982) method were used to calculate weight of each indicator. The
calculated weights for each of the flood vulnerability indicators are given in
"annexe "7.
4.3.4. Composite
vulnerability index of vulnerability factors
4.3.4.1. Exposure
factor
Exposure considers the indicators which explain how social
entities such as households or economic activities like agriculture, etc., are
exposed to flood events. Ten (10) indicators are used to explain the
determinant of communities' vulnerability to flood disaster under exposure
factor. Two main determinants are found: flood characteristics composed of
flood frequency, magnitude, depth and duration as well as elements at risks
composed of households and their farmland. Flood characteristics are quite the
same for all the surveyed village but the difference is related to the elements
at risk in each village. The composite vulnerability index of this factor is
calculated for each village. By considering the composite index of exposure
factor, the most exposed villages are Djrekpon and Kpodji with high indices
ranging from 0.0451 to 0.0651 "Map 3". The most exposed villages have the
highest scores for most of the considered indicators under the elements at risk
compared to the other villages : high population and farmland in flooded area,
high percentage of women and children and elderly in flooded area "annexe 6".
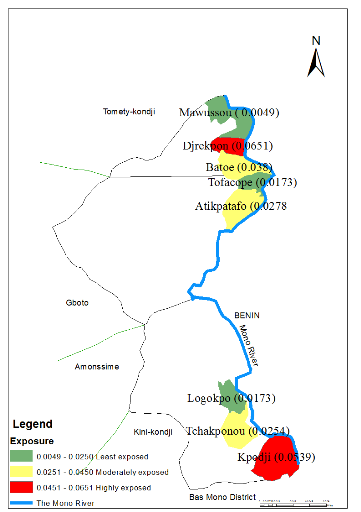
Map 3: Flood Exposure map
of the study area
4.3.4.2 Susceptibility
Factor
Susceptibility considers the indicators which evaluate the
sensitivity of an element at risk before and during a flood event. Eleven (11)
indicators are also equally used to explain the determinants of communities'
vulnerability to flood disasters under susceptibility factors. The composite
index of susceptibility factor for each village is computed. By considering the
composite index of susceptibility factor, the most susceptible villages are
Batoe and Atikpatafo with high indices ranging from 0.0058 to0.0065 "Map 4".
The most susceptible villages have the highest scores for most of the
considered indicators :high female headed household, low education level,
limited livelihood strategies, high household size, low coping capability, low
access to emergency service, low preparedness capability "annexe 6".
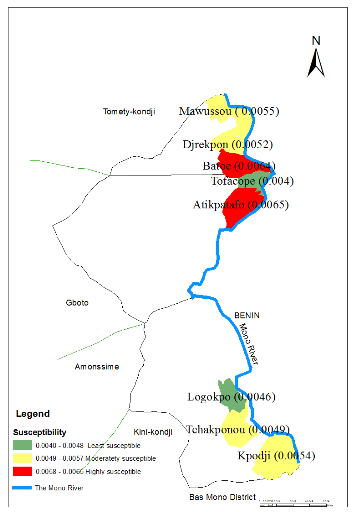
Map 4: Flood Susceptibility
Map of the study area
4.3.4.3 Resilience
Factor
Resilience factor considers indicators which clarify the ability
of a Human-Environment system to persist if exposed to flood by recovering
during and after the event. Eight (08) indicators have been used to explain the
determinants of communities' vulnerability to flood disasters under resilience
factor. The composite index of susceptibility factor for each village is
computed. By considering the composite index of resilience factor, the least
resilient villages are Djrekpon, Tchakponou and Kpodji with indices ranging
from (0.0059- 0.0069 ) "Map 5". The least resilient villages have the lowest
scores for most of the considered indicators :Low knowledge on warning system,
low evacuation capability, low recovery capacity "annexe 6".
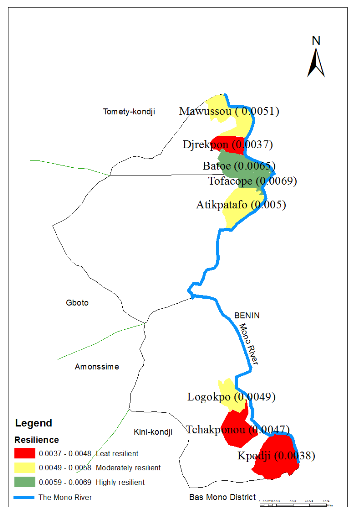
Map 5: Flood resilience map
of the study area
4. Composite vulnerability index of
components
The values of the indicators were used in the following general
equation of vulnerability to determine the overall flood vulnerability index.
Among the eight villages surveyed, Djrekpon and Kpodji are found to experience
relatively high vulnerability with indices ranging from (0.0048-0.0225) ,
Batoe, Atikpatafo, Logokpo and Tchakponou are found to be moderately vulnerable
with indices ranging from (0.0256-0.461) and Mawussou and Tofacope are
estimated to suffer relatively low level of vulnerability to flood disaster
with indices ranging from (0.462-0.668) "Map 6".
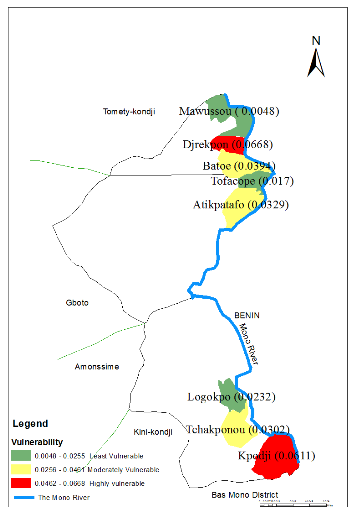
Map 6 Flood vulnerability
map of the study area
This section compares the vulnerability of the selected villages
by computing the composite vulnerability index of the three factors of
vulnerability, using indicators identified under the different determinants of
Human-Environment system and the overall flood vulnerability index. The overall
FVI has shown two most vulnerable villages: Djrekpon and Kpodji. It is found
that Djrekpon and Kpodji villages were highly exposed, Djrekpon was highly
susceptible and Kpodji was moderately susceptible while the two villages were
found to be least resilient. Some justification can be found in these results
by looking at the number of households affected by floods during the last ten
years, the high percentage of household heads with no education level, the lack
of livelihood strategies option of those households, the highly susceptible
building materials, the lack of adequate coping capacity and recovery capacity
from floods. However, the low values found in the different results of the
three factors of flood vulnerability as well as in the overall vulnerability
index for some villages can be misinterpreted as not being vulnerable to
floods. This may not be the case since all determinants of human-environment or
socio-ecological system can be damaged under certain conditions.
CHAPTER V: CONCLUSION AND POLICY
RECOMMENDATION
This chapter presents the conclusions, and policy recommendation,
of the current study and areas for further study based on the discussion of
results presented in Chapters 4. This study was conducted in the district of
Yoto, South-eastern Togo, in three counties: Sedome, Esse-godjin and Tokpli.
The study covered the villages of Mawussou, Djrekpon, Batoe, Tofacope,
Atikpatafo, Logokpo, Tchakponou-kondji and Kpodji. The main objective of
the study was to analyse the long term trend of rainfall and river discharge
series for the study area, to identify the determinant of communities'
vulnerability to flood disasters and to compute flood vulnerability index in
order to easily understand and compare the vulnerability of the different
villages.
The data analysis results suggested the evidence of change in
precipitation and in the river discharge which may be the major contributing
factor of vulnerability to flood hazards. The increase of river discharge over
the years calls up the need to describe flood hazards by computing the return
period of the different intensities recorded over the record period of
1971-2010 and especially for 2010 flood which was exceptional in the targeted
area and in the whole country. Flood disasters in the target area is not only
due to the increase of precipitation and river discharge, but also to the
interaction between human and the environment; the vulnerability analysis
reveals that the communities' vulnerability to flood in the targeted area may
mostly be caused by lack of coping mechanisms, the insufficient emergency
response or service during and after floods from public and private
institutions, the closeness of households' farmlands and settlements to the
river body, lack of diversification of livelihood strategies, poor building
materials, low education level etc...
The computation of Flood Vulnerability Index (FVI) suggests that
communities' vulnerability to flood can be reflected by the three factors
(exposure, susceptibility and resilience). The FVI offers easy comprehensive
results, with the use of a composite values to characterise high, moderate and
low vulnerability communities. It is found that out of the eight surveyed
village, two were highly vulnerable (Djrekpon and Kpodji); Four were moderately
vulnerable (Batoe, Atikpatafo, Logokpo and Tchakponou-kondji) while two were
least vulnerable (Mawusssou and Tofacope).
To alleviate the vulnerability of those surveyed villages, the
study recommends some prior actions that can be taken to prevent homes and
communities from the damage caused by flooding. Based on the current research,
it is recommended to build awareness, preparedness and knowledge of communities
about the importance of flood risk management and particularly, what actions
should be taken as preparation and coping mechanisms. It recommends to educate
the populations in risk reduction by putting in a place local flood management
committee in order to enable preparation of community action plans that explain
what to do in flood case. The study recommends putting in place a good early
warning system, that local and regional weather information can use to
sensitize about flooding. Regarding advance warning, it is suggested to
associate the public and private media in the diffusion of the alerts related
to the seasonal forecasting of flood hazards, to install sign posts marking
possible flooding levels in the community and educate people about warning
signs of floods in order to limit the impacts of flood in the communities prone
to flood disasters.
This study is an attempt to assess communities' vulnerability
to flood in the Yoto district. For timing and limited funding purposes, it was
difficult to expand the area of assessment beyond the eight selected villages.
The results may not be totally extrapolated for the whole district as each
community has its own conditions. Since the methodology is based on indicators,
its main weakness is the accuracy of data to compute the equation. The results
of Flood vulnerability index in this study depend in majority on information
from communities. Some information was derived from sources that can be
considered as non-reliable, for example the village distance of contact with a
river, which was taken from Google Earth, by computing the distance using the
ruler tool in the software. For the results to be valid, all data must be
derived from other reliable sources.
Based on the present study, there is clearly a need for more
research into communities resilience, and adaptive options to the flood hazard,
particularly communities traditional knowledge and perceptions, experiences and
historical processes used to mitigate floods. Also, the aspect of communities'
behavioural response toward flood awareness especially household private
decisions in flood risk management should be investigated. It is also
recommended to conduct local risk assessment for building and agriculture
croplands using the engaging technique of flood-depth-analysis to work out the
structural and agricultural vulnerability that different levels of flood water
could bring.
REFERENCES
1. Aall, C., and I.T. Norland .2005. Indicators for
Local-Scale climate vulnerability assessments, Oslo: University of
Oslo.
2. Adger, W.N. .1999. Social Vulnerability to Climate Change and
Extremes in Coastal Vietnam. World Development 27: 249-269.
3. Adger, W. N., N. Brooks, G. Bentham, M. Agnew, and S. Eriksen
.2004. New Indicators of Vulnerability and Adaptive Capacity, Tyndall
Centre for Climate Change Research: Technical Report 7, Norwich.
4. Adriaanse, A..1994. In Search of Balance: A Conceptual
Framework for Sustainable Development Indicators, London: Network seminar
on sustainable
5. Ago E. E., F. Petit and P. Ozer .2005. Analyse des
inondations en aval du barrage de Nangbéto sur le fleuve Mono
(Togo-Bénin). Géo-Eco-Trop 29 :1-14
6. Atkins, J., S. Mazzi, and C. Ramlogan .1998. A Study on
the Vulnerability of Developing and Island States: A Composite Index,
Commonwealth Secretariat: UK
7. Amoussou, E., P. Camberlin and G. Mahé
.2012. Impact de la variabilité climatique et du barrage Nangbéto
sur l'hydrologie du système Mono-Couffo (Afrique de l'Ouest),
Hydrological Sciences Journal: 805-817.
8. Balica, S. F. . 2007. Development and Application f Flood
Vulnerability Indices for Various Spatial Scales, Unpublished Masters
thesis: UNESCO-IHE Institute for Water Education, the Netherlands.
9. Balica, S. F., N. Douben, N. G. Wright .2009. Flood
vulnerability indices at varying spatial scales. Water Science and
Technology 60(10): 2571-2580.
10. Balica, S. F., N. G. Wright, F.Vander Meulen .2012. A flood
vulnerability index for coastal cities and its use in assessing climate change
impacts. Natural Hazards 64(1): 73-105.
11. Birkmann, J.. 2006. Measuring vulnerability to natural
hazards: Towards disaster resilient societies, UNU press.
http://i.unu.eduf (consulted on 20 march 2014).
12. Birkmann, J. .2008. Assessing Vulnerability Before,
During and After a Natural Disaster in Fragile Regions. Case Study of the 2004
Indian Ocean Tsunami in Sri Lanka and Indonesia, Research Paper No.
2008/50, United Nations University: World Institute for Development and
Economics Research (UNU-WIDER).
13. Birkmann J. .2013. Measuring Vulnerability to Natural
Hazards: Towards Disaster Resilient Societies, United Nation University
(second edition)
14. Blaikie, P., T. Cannon, I. David and B.Wisner .1994. At
Risk: Natural Hazards, People' s Vulnerability, and Disasters, Routledge :
London.
15. Bowen, R. E., and C. Riley .2003. Socio-economic indicators
and integrated coastal management. Ocean and Coastal Management:
199-312.
16. Buckle, P. .1998. Re-defining Community and Vulnerability in
the context of Emergency Management. Australian Journal of Emergency
Management 13(1):21-26.
17. Burn, D.H. and M.A. Hag Elnur. 2002. Detection of Hydrologic
Trends and Variability Journal of Hydrology 255 (2002):107 -122.
18. Cannon, T. .1990. Vulnerability Analysis and the
Explanation of Natural Disasters. In A. Varley, Disasters, Development and
Environment, New York: John Wiley and Sons Ltd.
19. Cardona, O. .2003. A need for Rethinking the concept of
vulnerability an risk from a holistic perspective: A Necessary Review and
Criticism for effective risk management,
http://www.deservredando.org/public/articulos/2003/nrcvrfhp/nrcvrfhp_ago-04-2003.pdf
(consulted on 20 August 2013)
20. Carter, W. N. .1991. Disaster Management, Disaster
Managers' Handbook, Manila, Philippines: Publication of the Asian Development
Bank.
21. Chamber, R. .1983. Rural Development: Putting the Last
First, Essex: Longman.
22. Chris, Easter. 2000. The Common Wealth Vulnerability
Index, Ministerial Conference on Environment and Development in Asia and
the Pacific, Kitakyushu: Japan.
23. Clark, G. E., S. Moser, S. Ratick, K. Dow, W. B. Meyer, S.
Emani, W. Jin, . J.X., Kasperson, R. E. Kasperson, and H. E. Schwarz .1998.
Assessing the vulnerability of coastal communities to extreme storms: the case
of Revere, MA., USA , Mitigation and Adaptation Strategies for Global
Change 3( 1), 59-82.
24. Connor, R.F., and K. Hiroki .2005. Development of a method
for assessing flood vulnerability, Water Science and Technology
51(5):61-67
25. Cutter, S.L., B.J. Boruff, and W.L.Shirley.2003. Social
vulnerability to environmental hazards. Social science quarterly
84(22):242-261 http://www.colorado.edu (Consulted on 05 August 2014).
26. De Toffol , S., A.N. Laghari, and W. Rauch .2008. Are
extreme rainfall intensities more frequent? Analysis of trends in rainfall
patterns relevant to urban drainage systems, 11th International
Conference on Urban Drainage, Edinburgh, Scotland: UK.
27. Damm, Marion. 2010. Mapping Social-Ecological
Vulnerability to Flooding. A sub-national approach for Germany, Graduate
Research series, PhD dissertation (Vol3), Bonn, Germany: United Nation
University-IEHS.
28. Downing, T. .2004. What Have we Learned Regarding a
Vulnerability Sciencein Support of Adaptation to Climate Change?
Recommendations for an Adaptation Science Agenda and a Collection of Papers
Presented at a Side Event of the 10th Session of the Conference of the
Parties to the United Nations Framework Convention on Climate Change:
Buenos Aires. www.aiaccproject.org (Consulted on 20 March 2014)
29. Dolan, A.H., and I.J. Walker .2003. Understanding
Vulnerability of Coastal Communities to Climate Change Related Risks
Journal of Coastal Research SI 39: 0749-0208.
30. Douglas, E. M., R. M. Vogel, and C. N. Knoll .2000. Trends in
flood and low flows in the United States: impact of spatial correlation.
Journal of. Hydrology: 90-105
31. Ekotu John Juventine. 2012. Landslide Hazards: Household
Vulnerability, Resilience and Coping in Bududa District, Eastern Uganda,
Unpublished Master's thesis, University of the Free State
32. EM-DAT: The OFDA/CRED International Disaster Database,
Université catholique de Louvain: Brussels, Belgium
33. FAO .2008. Disaster risk management systems
analysis, A guide book, Rome: Italy. (consulted on 16 February 2014).
34. Fekete, A. 2009.Validation of a social vulnerability index in
context to river-floods in Germany. Natural Hazards Earth System.
Sciences: 393-403.
35. Fekete, A. .2010. Assessment of Social Vulnerability for
River Floods in Germany, Graduate Research Series vol. 4, UNU-EHS: Bonn
36. Füssel, H. M. , and R.J.T. Klein .2006. Climate change
vulnerability assessments: an evolution of conceptual thinking. Climatic
Change 75 (3): 301-329.
37. Guha-Sapir, D., D. Hargitt, P. Hoyois .2004. Thirty Years
of Natural Disaster 1974-2003: The Numbers. Belgium: Presses
Universitaires de Louvain. http://www.cred.be. ( Consulted on 15 October
2013).
38. Gallopín, G.1997. Indicators and Their Use:
Information for Decision-Making. In: Moldan, B.; Billharz, S. ed:
Sustainability Indicators: Report of the project on indicators of sustainable
development. New York:John Wiley.
39. Haki, Z., Z. Akyuerek, and S. Duezguen .2004. Assessment
of social vulnerability using geographic information systems: Pendik, Istanbul
case study, In 7th AGILE Conference on Geographic Information Science
413-423, Heraklion, Greece: Middle East Technical University of Ankara,
Turkey.
40. IPCC .2007. Climate Change 2007: Impacts, adaptation and
vulnerability. Contribution of Working Group II to the fourth assessment report
of the Intergovernmental Panel on Climate Change, Cambridge: Cambridge
University Press.
41. IPCC.2012a. Managing the risks of extreme events and
disasters to advance climate change adaptation
42. Iyengar, N.S. and P. Sudarshan. 1982. A Method of
Classifying Regions from Multivariate Data , Special Article:
2047-2052.
43. Jonkman, S. N. .2005. Global Perspectives on Loss of Human
Life Caused by Floods. Natural Hazards 34(2):151-175
44. Kasperson, J.X., R.E. Kasperson, B.L. Turner, W. Hsieh,
and A. Schiller .2000. Vulnerability to Global Environmental Change, The
Human Dimensions of Global Environmental Change, Cambridge: MIT Press.
45. Kendall, M.G. .1975. Rank Correlation Methods, 4th
edition, Charles Griffin: London U.K.
46. Katharine , Vincent .2004. Creating an Index of
Social Vulnerability to Climate Change for Africa, Tyndall: Centre for
Climate change Research Working
47. Klassou K. S. .1996. Evolution Climato-hydrologique
récente et ses conséquences sur l'environnement: l'exemple du
bassin versant du fleuve Mono (Togo-Bénin),Phd Dissertation
(Géog. Phys.), Bordeaux III:Université Michel de Montaigne
48. Maiti, Sreyasi. 2007. Defining a Flood Risk Assessment
Procedure Using Community Based Approach with Integration of Remote Sensing
and GIS- Based on the 2003 Orissa Flood, Unpublished Master's thesis,
India Institute of Remote Sensing.
49. Mann, H.B .1945. Non-parametric test against trend.
Econometrica 13: 245-259
50. Martens, T.; Ramm, K. (2007): Newsletter 2:
http://innig.rtens.net/modules/Downloads/hjiu3443/INNIG_TP3_Newsletter_2.pdf,
accessed: 25 April 2014.
51. McLanahan, S. .1983. Family Structure and Stress: A
Longitudinal Comparison of Two Parent and Female-Headed Families. Journal
of Marriage and Family 45(2): 347-357.
52. MERF, World Bank and UNDP.2010. Evaluation Des Dommages,
Pertes et Besoins de Reconstruction Post Catastrophes des Inondations de 2010
au Togo
53. MERF and UNDP. 2013. Strategie Nationale de Reduction des
Risques de Catastrophes Naturelles 2013-2017.
54. Moldan, B., A. L. Dahl .2007. Challenges To Sustainability
Indicators in Hák. Sustainability Indicators: A Scientific Assessment
ed, Moldan, B and Dahl, A. L. Washington DC: Island Press.
55. Moss R.H., A.L. Brenkert and E.L. Malone .2001.
Vulnerability to Climate Change: A Quantitative Approach, Department
of Energy: U.S.
56. Muller, A., J. Reiter, and U. Weiland .2011. Assessment of
urban vulnerability towards floods using an indicator-based approach - a case
study for Santiago de Chile Natural. Hazards Earth System. Sciences
11: 2107-2123.
57. Pistrika Aimilia and George Tsakiris.2007. Flood Risk
Assessment: A Methodological Framework Centre for the Assessment of Natural
Hazards & Proactive Planning, National, Greece :Technical University
of Athens.
58. Rossi G. .1996. L'impact des barrages de la vallée
du Mono (Togo-Benin). La gestion de l'incertitude.
Géomorphologie:relief, processus, environnement 2(2): 55-68.
59. Sadiq I. K., Y. Hong, J. Wang, K. Koray, J. Yilmaz, J.
Gourley, F. Robert, G. Adler, R. Brakenridge, P. Fritz, H. Shahid, and D. Irwin
.2011. Satellite Remote Sensing and Hydrologic Modeling for Flood Inundation
Mapping in Lake Victoria Basin: Implications for Hydrologic Prediction in
Ungauged Basins. Transactions on Geoscience and Remote Sensing 49(1):
85-95
60. Schneiderbauer, S. 2007: "Risk and vulnerability to natural
disasters -rom broad view to focused perspective. Theoretical background and
applied methods for the identification of the most endangered populations in
two case studies at different scales", Phd, Freie Universit· at
Berlin,.
61. Sen, P. K. .1968. Estimates of the regression coefficient
based on Kendall's tau. J. Am. Stat. Assoc. 63:1379-1389.
62. Seventh Framework Programme. 2011. Review and evaluation
of existing vulnerability indicators in order to obtain an appropriate set of
indicators for assessing climate related vulnerability, Seventh Framework
Programme: project CLUVA.
63. Singh, P., V. Kumar, T. Thomas, and M. Arora. 2008. Changes
in rainfall and relative humidity in different river basins in the northwest
and central India. Hydrol. Process 22: 2982-2992
64. Snyder, AR. DK. McLaughlin, and J. Findeis .2006. Household
Composition and Poverty among Female-Headed Households with Children:
Differences by Race and Residence. Rural Sociology 71(4): 597-624.
65. Smit, B. and J. Wandel .2006. Adaptation, capacity and
vulnerability. Global Environ Change 16:282-292
66. Steinführer, A.; Kuhlicke, C. (2007): Social
vulnerability and the 2002 flood. Country Report Germany (Mulde River),
Floodsite Report Number T11-07-08, UFZ Centre for Environmental Research,
Leipzig.
67. Thieken, A.; H. Kreibich, M. Müller, B. Merz .2007.
Coping with floods: preparedness, response and recovery of flood-affected
residents in Germany in 2002. Hydrological Sciences - Journal
52(5):1016-1037.
68. Turner, B.L., R.E. Kasperson, P.A. Matson, J.J. McCathy,
R.W. Corell, L. Christensen, B. Wisner, P. Blaikie, T. Cannon, and I.
Davis. 2003. At Risk: Natural Hazards, Peoples' vulnerability and
Disasters, London: Routledge.
69. UN/ISDR .2004. Living with Risk, a Global Review of
Disaster Reduction Initiatives, Geneva: United Nations.
70. UN/ISDR .2005b. Hyogo Framework for Action (HFA),
2005-2015: Building the resilience of nations and communities to disasters,
Geneva: United Nations,.
71. Veenstra, Jelmer .2013. Flood vulnerability assessment on
a commune level in Vietnam, Unpublished Bachelor thesis, Vietnam: VNU
University of Science in Hanoi,
72. Velasquez, G., and R. Tanhueco .2005. Know Risk.
United Nations `World Conference on Disaster Reduction', Chapter: Incorporating
social issues in disaster risk assessment.
73. Villagran de Leon . 2006. Vulnerability - A conceptual
and Methodological review, Germany: UNU - EHS, no 4/2006, Bonn,
74. Wisner, B., P., Blaikie, T. Cannon, and I. Davis
.2004. At Risk: Natural Hazards, Peoples' Vulnerability and
Disasters, London: Routledge.
75. World Bank .2005. African Development Indicators
http://www4.worldbank.org/afr/stats/adi2005/adi05_booklet_rev_061505.pdf,
(Consulted on 23 July 2014).
76. Yamane T. .1967. Statistics, an introductory
analysis, 2nd ed, New York: Harper and Row.
77. Yue, S., P. Pilon, B. Phinney, G. Cavadias .2002. The
influence of autocorrelation on the ability to detect trend in hydrological
series Hydrological Processes 16(9): 1807-1829.
78. Yu, Y. S., S. Zou, and D., Whittemore .1993. Non-parametric
trend analysis of water quality data of rivers in Kansas. J. Hydrol
150: 61-80.
ANNEXES
Annexe 1 : Statistical
summary of Annual and monthly precipitation for Tabligbo
|
Tabligbo station
|
Minimum
|
Maximum
|
Median
|
Mean
|
Stdev
|
Variance
|
CV
|
Skewness
|
|
Annual
|
674
|
1341.5
|
1005.1
|
1016.258
|
179.610
|
32259.59
|
0.177
|
-0.165
|
|
Jan
|
0
|
50
|
1.45
|
7.967
|
12.64
|
159.77
|
1.586
|
1.851
|
|
Feb
|
0
|
121.5
|
24.15
|
31.8
|
33.716
|
1136.79
|
1.06
|
1.313
|
|
Mar
|
0.1
|
309.6
|
93.850
|
96.262
|
60.612
|
3673.82
|
0.630
|
1.050
|
|
Apr
|
24.3
|
264.3
|
107.3
|
118.378
|
57.584
|
3315.97
|
0.486
|
0.641
|
|
May
|
45.3
|
325.5
|
142.75
|
152.712
|
59.196
|
3504.16
|
0.388
|
0.514
|
|
Jun
|
44.8
|
288.9
|
165.95
|
159.647
|
56.391
|
3179.93
|
0.353
|
0.015
|
|
Jul
|
4.8
|
209.7
|
79.75
|
89.19
|
52.361
|
2741.71
|
0.587
|
0.526
|
|
Aug
|
2.2
|
213.6
|
46.55
|
53.655
|
44.726
|
2000.44
|
0.834
|
1.562
|
|
Sept
|
0.2
|
291.3
|
109.500
|
120.9
|
69.310
|
57.122
|
35.206
|
33.334
|
|
Oct
|
28
|
313.3
|
135.55
|
130.06
|
57.122
|
3262.92
|
0.439
|
0.701
|
|
Nov
|
0
|
161.4
|
29.950
|
39.980
|
35.206
|
1239.45
|
0.881
|
1.347
|
|
Dec
|
0
|
194.1
|
3.5
|
15.705
|
33.334
|
111.123
|
2.122
|
4.263
|
Annexe 2: Mann-Kendall test
results of annual, monthly and seasonal precipitation
|
Mann Kendall
Statistic (S)
|
p-value (two tailed test)
|
alpha
|
Sen's slope estimate
|
Test Interpretation
|
|
Jan
|
10
|
0.153
|
0.05
|
-0.073
|
Accept H0
|
|
Feb
|
-123
|
0.291
|
0.05
|
-0.560
|
Accept H0
|
|
Mar
|
- 31
|
0.651
|
0.05
|
-0.069
|
Accept H0
|
|
Apr
|
39
|
1.000
|
0.05
|
0.353
|
Accept H0
|
|
May
|
53
|
1.000
|
0.05
|
0.285
|
Accept H0
|
|
Jun
|
114
|
0.291
|
0.05
|
1.134
|
Accept H0
|
|
Jul
|
115
|
1.000
|
0.05
|
0.980
|
Accept H0
|
|
Aug
|
57
|
0.651
|
0.05
|
0.153
|
Accept H0
|
|
sept
|
-20
|
0.451
|
0.05
|
-0.480
|
Accept H0
|
|
Oct
|
122
|
0.175
|
0.05
|
1.307
|
Accept H0
|
|
Nov
|
119
|
0.760
|
0.05
|
0.699
|
Accept H0
|
|
Dec
|
-33
|
0.532
|
0.05
|
-0.191
|
Accept H0
|
|
Annual
|
122
|
0.159
|
0.05
|
3.434
|
Accept H0
|
|
High rainy season
|
-16.
|
0.861
|
0.05
|
-0.063
|
Accept H0
|
|
High dry season
|
119
|
0.169
|
0.05
|
0.703
|
Accept H0
|
|
Small dry season
|
61
|
0.484
|
0.05
|
0.349
|
Accept H0
|
|
Small rainy season
|
52
|
0.552
|
0.05
|
0.468
|
Accept H0
|
Annexe 3 : Statistical
summary of Annual and monthly Flow for Athieme
|
Athieme Station
|
Minimum
|
Maximum
|
Median
|
Mean
|
stdev
|
Variance
|
CV
|
skewness
|
|
Annual
|
19.089
|
262.408
|
102.970
|
114.985
|
58.998
|
3480.749
|
0.513
|
0.725
|
|
Mar
|
0.180
|
132.952
|
20.762
|
40.509
|
43.749
|
1913.998
|
1.080
|
0.662
|
|
Apr
|
0.380
|
136.863
|
21.648
|
369.902
|
39.073
|
1526.688
|
0.979
|
0.560
|
|
May
|
0.790
|
141.390
|
28.752
|
47.229
|
47.705
|
2275.808
|
1.010
|
0.779
|
|
Jun
|
1.928
|
257.758
|
56.581
|
67.245
|
59.815
|
3577.842
|
0.890
|
1.213
|
|
Jul
|
6.094
|
359.385
|
105.551
|
128.895
|
91.771
|
8421.840
|
0.712
|
1.055
|
|
Aug
|
21.945
|
588.352
|
221.125
|
230.096
|
141.150
|
19923.299
|
0.613
|
0.953
|
|
Sept
|
35.190
|
731.677
|
302.805
|
333.442
|
189.934
|
36074.800
|
0.570
|
0.435
|
|
Oct
|
19.369
|
736.705
|
214.869
|
237.667
|
155.241
|
24099.804
|
0.653
|
1.153
|
|
Nov
|
1.589
|
281.567
|
75.072
|
91.686
|
75.570
|
5710.826
|
0.882
|
0.867
|
|
Dec
|
0.966
|
490.532
|
31.336
|
66.880
|
89.258
|
7967.078
|
1.335
|
2.934
|
|
Jan
|
0.429
|
248.383
|
35.203
|
51.203
|
56.458
|
3187.500
|
1.094
|
1.269
|
|
Feb
|
0.389
|
225.486
|
37.751
|
44.683
|
49.629
|
2463.063
|
1.111
|
1.409
|
Annexe 4: Mann-Kendall
results of annual , monthly and seasonal flow for the study area
|
Months
|
Mann Kendall test
|
|
Mann Kendall
Statistic (Zc)
|
p-value (two tailed test)
|
alpha
|
Sen's slope estimate
|
Test Interpretation
|
|
Mar
|
62.000
|
< 0,0001
|
0.05
|
2.233
|
Reject H0
|
|
Apr
|
50.000
|
< 0,0001
|
0.05
|
2.031
|
Reject H0
|
|
May
|
52.000
|
< 0,0001
|
0.05
|
2.289
|
Reject H0
|
|
June
|
26.000
|
0.014
|
0.05
|
0.910
|
Reject H0
|
|
Jul
|
14.000
|
0.202
|
0.05
|
-1.354
|
Accept H0
|
|
Aug
|
-14.000
|
0.202
|
0.05
|
-3.391
|
Accept H0
|
|
Sept
|
-26
|
0.014
|
0.05
|
-4.697
|
Reject H0
|
|
Oct
|
6.000
|
0.624
|
0.05
|
-0.047
|
Accept H0
|
|
Nov
|
30.000
|
0.0004
|
0.05
|
2.295
|
Reject H0
|
|
Dec
|
48.000
|
< 0,0001
|
0.05
|
3.433
|
Reject H0
|
|
Jan
|
50.000
|
< 0,0001
|
0.05
|
2.653
|
Reject H0
|
|
Feb
|
56.000
|
< 0,0001
|
0.05
|
2.135
|
Reject H0
|
|
Annual
|
262
|
0.002
|
0.05
|
2.462
|
Reject H0
|
|
High rainy season
|
456
|
0.000
|
0.05
|
3.416
|
Reject H0
|
|
High dry season
|
436
|
0.000
|
0.05
|
2.663
|
Reject H0
|
|
Small dry season
|
80
|
0.357
|
0.05
|
1.392
|
Accept H0
|
|
Small rainy season
|
54
|
0.537
|
0.05
|
1.125
|
Accept H0
|
|
Feb
|
56.000
|
< 0,0001
|
0.05
|
2.135
|
Reject H0
|
|
Annual
|
262
|
0.002
|
0.05
|
2.462
|
Reject H0
|
|
High rainy season
|
456
|
0.000
|
0.05
|
3.416
|
Reject H0
|
|
High dry season
|
436
|
0.000
|
0.05
|
2.663
|
Reject H0
|
|
Small dry season
|
80
|
0.357
|
0.05
|
1.392
|
Accept H0
|
|
Small rainy season
|
54
|
0.537
|
0.05
|
1.125
|
Accept H0
|
Annexe 5: calculation for
Return Period of 2010 Flood, Mono River
|
Water Year
|
Rank
|
Ranked discharge
|
Return period
|
Exceedence probability
|
|
2000
|
1
|
736.70
|
41
|
0.02
|
|
1971
|
2
|
731.68
|
21
|
0.05
|
|
2007
|
3
|
709.11
|
14
|
0.07
|
|
2001
|
4
|
665.12
|
10
|
0.10
|
|
2003
|
5
|
615.93
|
8
|
0.12
|
|
1981
|
6
|
591.77
|
7
|
0.15
|
|
1986
|
7
|
588.35
|
6
|
0.17
|
|
1980
|
8
|
552.91
|
5
|
0.20
|
|
2010
|
9
|
549.65
|
5
|
0.22
|
|
1999
|
10
|
526.23
|
4
|
0.24
|
|
2005
|
11
|
471.37
|
4
|
0.27
|
|
1992
|
12
|
463.27
|
3
|
0.29
|
|
1975
|
13
|
444.23
|
3
|
0.32
|
|
1988
|
14
|
440.94
|
3
|
0.34
|
|
1990
|
15
|
436.73
|
3
|
0.37
|
|
1972
|
16
|
425.99
|
3
|
0.39
|
|
1989
|
17
|
424.81
|
2
|
0.41
|
|
2008
|
18
|
402.60
|
2
|
0.44
|
|
1982
|
19
|
350.72
|
2
|
0.46
|
|
1976
|
20
|
337.38
|
2
|
0.49
|
|
2002
|
21
|
331.09
|
2
|
0.51
|
|
1974
|
22
|
329.98
|
2
|
0.54
|
|
2006
|
23
|
315.35
|
2
|
0.56
|
|
1978
|
24
|
289.35
|
2
|
0.59
|
|
1977
|
25
|
257.10
|
2
|
0.61
|
|
2004
|
26
|
256.97
|
2
|
0.63
|
|
1979
|
27
|
252.48
|
2
|
0.66
|
|
1995
|
28
|
251.82
|
1
|
0.68
|
|
1973
|
29
|
247.67
|
1
|
0.71
|
|
1985
|
30
|
240.60
|
1
|
0.73
|
|
1991
|
31
|
227.13
|
1
|
0.76
|
|
1998
|
32
|
225.49
|
1
|
0.78
|
|
1983
|
33
|
212.32
|
1
|
0.80
|
|
1987
|
34
|
200.91
|
1
|
0.83
|
|
1994
|
35
|
196.56
|
1
|
0.85
|
|
1993
|
36
|
166.30
|
1
|
0.88
|
|
1997
|
37
|
139.64
|
1
|
0.90
|
|
1996
|
38
|
137.94
|
1
|
0.93
|
|
2009
|
39
|
80.17
|
1
|
0.95
|
|
1984
|
40
|
69.16
|
1
|
0.98
|
Annexe 6:normalised scores
of flood vulnerability indicators of each village
|
Indicators
|
Djrekpon
|
Batoe
|
Logokpo
|
Tchakponou
|
Kpodji
|
Tofacope
|
Atikpatafo
|
Mawussou
|
|
E1
|
0.9007
|
1.0000
|
0.8278
|
0.0000
|
0.6821
|
0.4967
|
0.4967
|
0.8675
|
|
E2
|
0.6855
|
0.3918
|
0.4378
|
0.0000
|
0.3877
|
0.1526
|
0.4127
|
1.0000
|
|
E3
|
1.0000
|
0.2454
|
0.3152
|
0.2179
|
0.3865
|
0.9689
|
0.5672
|
0.0000
|
|
E4
|
0.0946
|
0.0054
|
0.0000
|
1.0000
|
0.4482
|
0.0518
|
0.2750
|
0.1679
|
|
E5
|
1.0000
|
0.5000
|
0.0000
|
0.0000
|
0.5000
|
1.0000
|
1.0000
|
0.0000
|
|
E6
|
0.0000
|
0.7593
|
0.8704
|
0.7222
|
1.0000
|
0.3148
|
0.5556
|
0.1852
|
|
E7
|
1.0000
|
0.5932
|
0.2712
|
0.3729
|
0.8729
|
0.0508
|
0.2542
|
0.0000
|
|
E8
|
0.2031
|
0.1080
|
0.4523
|
1.0000
|
0.2915
|
0.0000
|
0.0301
|
0.1834
|
|
E9
|
0.5986
|
0.9010
|
1.0000
|
0.7790
|
0.8236
|
0.8605
|
0.0000
|
0.0906
|
|
E10
|
0.8581
|
1.0000
|
0.6782
|
0.0000
|
0.6910
|
0.4334
|
0.0800
|
0.1172
|
|
S1
|
0.5101
|
0.1376
|
0.5694
|
0.1376
|
1.0000
|
0.0000
|
0.7974
|
0.5926
|
|
S2
|
0.5101
|
0.1376
|
0.5694
|
0.1376
|
1.0000
|
0.0000
|
0.7974
|
0.5926
|
|
S3
|
0.1601
|
0.8204
|
0.8521
|
0.4392
|
0.0000
|
0.6931
|
0.7949
|
1.0000
|
|
S4
|
0.3811
|
0.0000
|
0.8147
|
0.4072
|
1.0000
|
0.2264
|
0.2769
|
0.0983
|
|
S5
|
0.0645
|
0.5163
|
0.7737
|
1.0000
|
1.0000
|
0.4627
|
0.7099
|
0.0000
|
|
S6
|
0.7921
|
0.7850
|
1.0000
|
0.7850
|
1.0000
|
0.8808
|
0.8711
|
0.0000
|
|
S7
|
0.6235
|
0.4833
|
0.0000
|
0.0000
|
0.0000
|
0.1788
|
0.0000
|
1.0000
|
|
S8
|
0.0000
|
0.6071
|
0.3928
|
0.7500
|
0.5714
|
0.3928
|
1.0000
|
0.5357
|
|
S9
|
0.0000
|
0.6071
|
0.3928
|
0.7500
|
0.5714
|
0.3928
|
1.0000
|
0.5357
|
|
S10
|
0.8645
|
1.0000
|
0.0000
|
0.5803
|
0.0939
|
0.8252
|
0.8321
|
0.4392
|
|
S11
|
0.7742
|
1.0000
|
0.0624
|
0.1334
|
0.0000
|
0.0740
|
0.0000
|
0.3448
|
|
R1
|
0.5913
|
0.6613
|
0.0471
|
0.0233
|
0.0000
|
0.4768
|
0.9418
|
1.0000
|
|
R2
|
0.8461
|
1.0000
|
0.3903
|
0.5435
|
0.0000
|
0.7925
|
0.5102
|
0.5205
|
|
R3
|
0.9033
|
1.0000
|
0.2031
|
0.0000
|
0.6364
|
1.0000
|
0.0400
|
0.3276
|
|
R4
|
0.9033
|
1.0000
|
0.2031
|
0.0000
|
0.6364
|
1.0000
|
0.0400
|
0.3276
|
|
R5
|
0.5482
|
1.0000
|
0.0000
|
0.4712
|
0.5672
|
0.3538
|
0.6299
|
0.9361
|
|
R6
|
0.2944
|
0.1667
|
0.4141
|
0.0625
|
0.2898
|
1.0000
|
0.0000
|
0.2995
|
|
R7
|
1.0000
|
0.8307
|
0.1272
|
0.1538
|
0.0000
|
1.0000
|
0.7969
|
0.7375
|
|
R8
|
0.9240
|
0.8821
|
0.4475
|
0.4500
|
0.0000
|
0.9122
|
1.0000
|
1.0000
|
|
R9
|
0.4300
|
1.0000
|
0.1040
|
0.0000
|
0.0000
|
0.6173
|
0.4000
|
0.9197
|
Annexe 7: Calculated
weights of flood vulnerability indicators
|
No
|
Indicators
|
Weight
|
|
1
|
E1
|
0.00234
|
|
2
|
E2
|
0.03905
|
|
3
|
E3
|
0.0162
|
|
4
|
E4
|
0.06061
|
|
5
|
E5
|
0.12353
|
|
6
|
E6
|
0.00601
|
|
7
|
E7
|
0.5302
|
|
8
|
E8
|
0.0002
|
|
9
|
E9
|
0.01099
|
|
10
|
E10
|
0.00449
|
|
11
|
S1
|
0.01011
|
|
12
|
S2
|
0.01217
|
|
13
|
S3
|
0.01398
|
|
14
|
S4
|
0.00812
|
|
15
|
S5
|
0.02167
|
|
16
|
S6
|
0.01148
|
|
17
|
S7
|
0.01462
|
|
18
|
S8
|
0.00434
|
|
19
|
S9
|
0.00483
|
|
20
|
S10
|
0.00596
|
|
21
|
S11
|
0.01078
|
|
22
|
R1
|
0.00459
|
|
23
|
R2
|
0.00404
|
|
24
|
R3
|
0.0143
|
|
25
|
R4
|
0.0058
|
|
26
|
R5
|
0.00698
|
|
27
|
R6
|
0.00371
|
|
28
|
R7
|
0.00972
|
|
29
|
R8
|
0.00846
|
|
30
|
R9
|
0.02333
|
Annexe 8: Questionnaire for
Household Interview
|
|
Date:
|
___ ___ / ___ ___ / 2014
|
|
County : ___________________
|
Team ID:____________
|
|
Village:____________
|
Questionnaire No!____ ! !____ !
!____ !
|
INTRODUCTION
I am a student at the University of Lome , Togo pursuing a
Masters in Climate Change and Human Security. I am collecting data for a
research study in Yoto District. The study focuses on assessing population
vulnerability to flood in the area. I would like to ask you some questions
about your family. The data that you provide is for academic purpose and it
will be kept strictly confidential. This is voluntary, you can refuse to answer
to some of the questions but I hope you will accept as your views are very
important.
Section 1: Exposure
1.What are the main climate hazards that have affected your
community during the last ten years?
1. Flooding |__| 2. Drought |__|; 3. Storm |__|; 4.
Bushfire |__|
2.Among those hazard, what was the most damageous?
1. flooding |__|; 2. drought |__|; 3. Storm |__|; 4.
Bushfire |__|
3.What are the causes of flood in your locality?
1. heavy rainfall |__|; 2. overflow of Mono river |__|; 3.
Other, specify..... ........................|__|
4.Do you think the frequency of occurrence and impacts of
flooding have increased during this decade compared to previous decades ?
1. Yes |__|; 2. No |__|
5. Number of flood event during the past ten years
..................................................................
..................................................................................
6. Was your household affected by the 2010 flood?
1. Yes |__|; 2. No |__|
7. Flood duration (the number of flood days during the 2010
flood)
..............................................................................................................................................
8. What is the height of the 2010 flood in your household?
(Flood depth)
............................................................................................................................................
9.How could you appreciate the 2010 flood magnitude compared
to the others floods?
|__| 1. Less; 2. Equal |__| ; 3. more |__|
10. The size of household's agricultural land
.............................................................................................................................................
11. Does your household's farmlands often affected by
floods?
1. Yes |__|; 2. No |__|
12. Proximity of the farmland to the water body
1. <1km |__|; 2. 1-2km |__|; 3. >2km |__|
13. Number of women in your household
................................................................................................................................................
14. Number of children under 15 years in your household
................................................................................................................................................
15. Number of elderly in your household
..............................................................................................................................................
Section 2 : Susceptibility
14.Sex of household head
|__| 1. Male; 2. Female |__|
15.Age of head of household
1. <20ans |__|; 2. 20-39 |__|; 3. 40-59 |__|; 4. 60+ |__|
16.Marietal Status of household head
1. Single|__|; 2. Married |__|; 3. Widowed |__|
17.Education status: highest level of education attained
1. No schooling |__| ; 2. Functional literacy |__|; 3. Primary
schooling |__|; 4. Secondary schooling |__|; 5. Tertiary schooling|__|; 6.
University |__|
18.Household size
.................................................................................................................................................................
19.Type of dwelling for the household
1. brick walls with iron/tiles sheet roof |__|; 2. Mud walls with
iron/tiles sheet roof |__|;
3. Mud walls with thatched roof |__| ; 4. hurdle walls with
thatched roof |__|
20. What are the main sources of income for the household?
1. None |___|; 2. Agriculture |___|; 3. breeding |___| ; 4.
fishing |___|; 5. handcraft |___|
6. Palm oil production |___|; 7. Trading |___| other specify
...................................... |___|
21. What are the secondary source of income of the household?
1. None |___|; 2. Agriculture |___|; 3. breeding |___| ; 4.
fishing |___|; 5. handcraft |___|
6. Palm oil production |___|; 7. Trading |___| other specify
.................................. |___|
22.Are you aware of the risk of floods in your locality?
1. yes |__|; 2. No |__|
23.if yes why do you still live in such an area?
......................................................................................................................................................
24.Was there any information or announcement or warning about the
threat of floods?
1. yes |__|; 2. No |__|
25.if yes, from which ways the information is passed
1. TV|__|; 2. Radio|__|; 3. traditional ways|__|; 4.
volunteers|__|
26. Were you aware of the 2010 flood:
1. yes |__|; 2. No |__|
27. Were you affected by the 2010 flood or any other flood in
your locality?
1. yes |__|; 2. No |__|
27.Are you prepared for floods?
1. Yes |__|; 2. No |__|
28.If yes what are the methods used?
29. Do you use any method to reduce the effect of flood
disasters to your household when they occur?
1. yes |__|; 2. No|__|
30.If yes, what are those methods?
..................................................................................................................................................................
31.Do you get help from the government or other institutions
during floods?
|__| 1. yes; |__| 2. No
32.If yes what type of help?
....................................................................................................................................................................
33.How do you value the government response during and after the
flooding in your area?
1. belated|__| ; 2. immediat|__|; 3. inadequate|__|; 4.
adaquate|__|, other specify.................. |__|
Section 3: Resilience
34.Did you attend any training on flood management?
1. yes |__|; 2. No |__|
35.If yes, what information did you receive during the
training?
..............................................................................................................................................................
36.Which structures provide the information/warning/training?
|__| 1. Croix rouge; |__| 2. NGOs; |__| 3. locale
government
37.Was the information you received useful during and after flood
disaster?
1. yes |__|; 2. No|__|
38. Is there a committee of flood management in your
community?
1. yes; |__| 2. No|__|
39.if yes, are you member?
1. yes; |__| 2. No |__|
40.Are you able to anticipate the occurrence of the floods?
1. yes |__|2. No|__|
41.if yes how?
1. Local indicators|__|; 2. early warning system |__|; 3 other
specify................................................ |__|
42.Is your household able to evacuate, in case of a flood?
1. yes|__|; 2. No|__|
43.Are there any place where you can seek shelter during
flood?
1. yes; |__| 2. No |__|
44.If yes where is that area?
1. Public school building |__|; 2. Neighbours or relatives in
non flooded area |__|;
3. church building|__| 4. public evacuation site |__|; 5.
migrate temporarily to other areas less vulnerable |__|; 6. Other
Specify......................................................................................
|__|
45.Does the government or others institutions provide prevention
and protection measures?
1. yes |__| ; 2. No |__|
46.if yes what are those measures?
.......................................................................................................................................................
47.How do you value the ability of anticipation and preparation
of the government or other institution to floods?
1. bad|__|; 2. inadequate|__|; 3. Good|__|
48.Do you get help from the government or other institution after
the flood?
1. Yes|__|; 2. No|__|
49.If yes what type of help?
..................................................................................................................................................................
50.Do you have community's support mechanisms to address the
flood risks?
1. yes |__|; 2. No |__|
51.If yes what are those mechanisms?
................................................................................................................................................................
52.Are you able to recover to the previous efficient state
1. yes |__|; 2. No |__|
53.Do experience environment recovery after flood ? ( positive
effect of flood on the environment)?
1. yes |__|; 2. No|__|
54.if yes what are those effects
...................................................................................................................................................................
55.What do you think the government or NGOs should do as
prevention measures to reduce flood impacts on your community?
................................................................................................................................................................
56.What do you think the government or NGOs should do to respond
to flood during flood disaster
.................................................................................................................................................................
57.What do you think government or NGOs should to after flood to
help you recover?
....................................................................................................................................................................
58.What do you think the government or other institution should
do to control flood disaster
....................................................................................................................................................................
59.What do you think your community itself should do to reduce
flood impact on your locality?
Annexe 9: Key Informants
Interview Guide.
1. What do you think are the causes of flood? Why?
2. How do you usually deal with flood occurrences and the
effects?
3. In which areas of life have floods affected you?
4. How were you affected?
5. Why do you think your community was more affected than any
other communities?
6. Were you able to tell that flood would occur?
7. How did you know?
8. Is there any way you are being prepared to deal with hazards
9.Which relief organizations assisted you to deal with floods?
10. Do you think relief organizations are important during
disaster situations?
11. How and when do they usually help during floods?
12. Do they ever seek your ideas before, during and after helping
in disaster situations?
13. Does the district have a disaster management committee?
14. How do you think the community can help itself in managing
floods?
VITA
KISSI Abravi Essenam received his Bachelor of Science degree in
Environment Sciences at the Faculty of Sciences from Université de
Lomé (Togo) in 2011. After three months of Proficiency in English at
University of Cape Coast (Ghana) in 2012, she entered the Climate Change and
Human Security program at Université de Lomé October 2012 and
received her Master of Science degree in November 2014.
Her research interests include Environmental impact assessment,
Disaster Risk Reduction, Risk and Vulnerability Assessment, Climate Change,
Human security and Mapping.
Her email is elvire.kissi@yahoo.com
Tel: 00228 92 60 94 25/ 99 40 77 48


