3.2. Methods
This chapter describes the methods that are used in
executing this study. Construction of vulnerability index consists of several
steps. First is the selection of study area which consists of several
villages. In each village a set of indicators are selected for each of the
three components of vulnerability.
3.2.1. Study Population and sampling
This study is carried out in eight villages (Mawussou, Drekpon,
Batoe, Atikpatafo, Tofakope, Tchakponou-kondji, Logokpo and Kpodji) from three
counties (Sedome, Esse-godjin, Tokpli) in the Yoto district, popularly known to
be associated with flood. The choice of the counties and the villages is based
on information obtained from literature and further confirmed from Togolese
Red Cross institution which is highly involved in Disaster Risk Reduction and
Adaptation to Climate Change in the Yoto district.
Data were collected through personal interviews from two
hundred and twenty one (221) households randomly sampled from the selected
villages.
3.2.2. Selected
Vulnerability Conceptual Frameworks
The current study relies on Turner et al's
vulnerability framework . It focuses only on the vulnerability part of the
framework in red "figure 5"
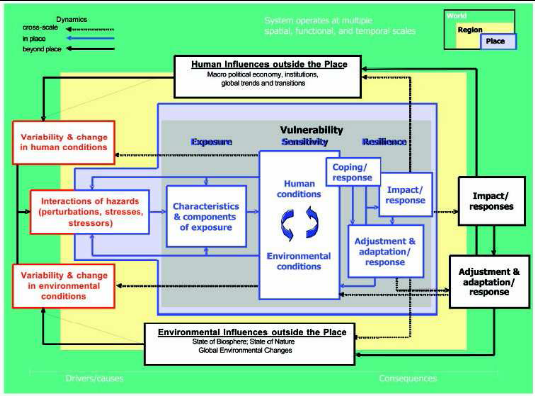
Figure 4: Turner et al's
Vulnerability Framework; Source: Turner et al., 2003, p 8076
The Turner et al's vulnerability framework is
selected for the present study for many reasons. It illustrates the
interactions involved in vulnerability analysis, drawing attention to the array
of factors and linkages that potentially affect the vulnerability of the
coupled human-environment system in a place. It facilitates the identification
of critical interactions in the human-environment system that suggest response
opportunities for decision makers. It is opened to the use of both quantitative
and qualitative data. It also illuminates the nested scales of the
vulnerability problem but provides an understanding of the vulnerability of a
particular place. This study focused on the local level `village' as a unit of
analysis. The main factors of the framework that were tackled in the present
study are presented in "figure 6".
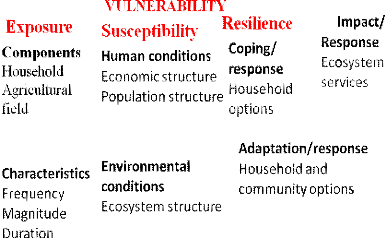
Figure 5: Vulnerability
components extracted from Turner et al., 2003 framework
3.2.3. Flood Vulnerability Indicator Development
In this study, only the deductive approaches were used to select
indicators to serve as proxies of human-environment vulnerability to flood
disasters. The field survey and interviews that were carried out in the scope
of this research showed whether the selected indicators are most relevant for
flood vulnerability analysis in the study area taking into account the local
knowledge and perception of the affected people. Those indicators which fitted
the local conditions best were combined into the composite vulnerability index
"Table 2".
Table 2: Selected
indicators for flood vulnerability
|
No
|
Defined Indicators
|
Factors
|
Abbr
|
Functional relationship
|
|
1
|
Population in flooded area
|
Exposure
|
E1
|
(+)
|
|
2
|
Women (%)
|
Exposure
|
E2
|
(+)
|
|
3
|
Children (%)
|
Exposure
|
E3
|
(+)
|
|
4
|
Elderly (%)
|
Exposure
|
E4
|
(+)
|
|
5
|
Return period ( year)
|
Exposure
|
E5
|
(+)
|
|
6
|
Flood duration (days)
|
Exposure
|
E6
|
(+)
|
|
7
|
Flood depth (m)
|
Exposure
|
E7
|
(+)
|
|
8
|
Flood magnitude (m3/s)
|
Exposure
|
E8
|
(+)
|
|
9
|
Village proximity (m)
|
Exposure
|
E8
|
(+)
|
|
10
|
Farmland in flood area (ha)
|
Exposure
|
E10
|
(+)
|
|
12
|
Education : no schooling (%)
|
Susceptibility
|
S1
|
(+)
|
|
13
|
Household size (more than 10)%
|
Susceptibility
|
S2
|
(+)
|
|
14
|
Female headed (%)
|
Susceptibility
|
S3
|
(+)
|
|
15
|
Farmers (Solely) (%)
|
Susceptibility
|
S4
|
(+)
|
|
16
|
Poor building material (%)
|
Susceptibility
|
S5
|
(+)
|
|
17
|
Household with affected land (%)
|
Susceptibility
|
S6
|
(+)
|
|
18
|
Community Awareness (%)
|
Susceptibility
|
S7
|
(+)
|
|
19
|
Household Coping mechanisms (%)
|
Susceptibility
|
S8
|
(+)
|
|
20
|
Emergency service (%)
|
Susceptibility
|
S9
|
(+)
|
|
21
|
Household Past experience (%)
|
Susceptibility
|
S10
|
(-)
|
|
22
|
Household Preparedness (%)
|
Susceptibility
|
S11
|
(-)
|
|
23
|
Warning system (%)
|
Resilience
|
R1
|
(-)
|
|
24
|
Household perception on flood risk(%)
|
Resilience
|
R2
|
(-)
|
|
25
|
Household Evacuation capability (%)
|
Resilience
|
R3
|
(-)
|
|
26
|
Household flood Training (%)
|
Resilience
|
R4
|
(-)
|
|
27
|
Recovery capacity (%)
|
Resilience
|
R5
|
(-)
|
|
28
|
Recovery Time (%)
|
Resilience
|
R6
|
(-)
|
|
29
|
Long term resident 10 years + (%)
|
Resilience
|
R7
|
(-)
|
|
30
|
Environmental recovery (%)
|
Resilience
|
R8
|
(-)
|
| 

