Annexe IV
Test de cointegration de Johansen pour les
séries annuelles :
|
Sample(adjusted): 1972 2006
|
|
Included observations: 35 after adjusting endpoints
|
|
Trend assumption: Linear deterministic trend
|
|
Series: LINF LPP IMEX LPPIMP LPPEXP
|
|
Lags interval (in first differences): 1 to 1
|
|
Unrestricted Cointegration Rank Test
|
|
Hypothesized
No. of CE(s)
|
Eigenvalue
|
Trace
Statistic
|
5 Percent
Critical Value
|
1 Percent
Critical Value
|
|
|
None
|
0.458224
|
57.82384
|
68.52
|
76.07
|
|
|
At most 1
|
0.310450
|
36.37224
|
47.21
|
54.46
|
|
|
At most 2
|
0.256802
|
23.36218
|
29.68
|
35.65
|
|
|
At most 3
|
0.210856
|
12.97443
|
15.41
|
20.04
|
|
|
At most 4 *
|
0.125315
|
4.686198
|
3.76
|
6.65
|
|
|
*(**) denotes rejection of the hypothesis at the 5%(1%) level
|
|
Trace test indicates no cointegration at both 5% and 1%
levels
|
|
Hypothesized
No. of CE(s)
|
Eigenvalue
|
Max-Eigen
Statistic
|
5 Percent
Critical Value
|
1 Percent
Critical Value
|
|
|
None
|
0.458224
|
21.45160
|
33.46
|
38.77
|
|
|
At most 1
|
0.310450
|
13.01006
|
27.07
|
32.24
|
|
|
At most 2
|
0.256802
|
10.38775
|
20.97
|
25.52
|
|
|
At most 3
|
0.210856
|
8.288228
|
14.07
|
18.63
|
|
|
At most 4 *
|
0.125315
|
4.686198
|
3.76
|
6.65
|
|
|
*(**) denotes rejection of the hypothesis at the 5%(1%) level
|
|
Max-eigenvalue test indicates no cointegration at both 5% and 1%
levels
|
Estimation du modèle VAR(1) pour les
séries annuelles :
|
Vector Autoregression Estimates
|
|
Date: 09/19/07 Time: 11:27
|
|
Sample(adjusted): 1972 2006
|
|
Included observations: 35 after adjusting endpoints
|
|
Standard errors in ( ) & t-statistics in [ ]
|
|
D(LINF)
|
D(LPP)
|
D(IMEX)
|
D(LPPIMP)
|
D(LPPEXP)
|
|
D(LINF(-1))
|
-0.673783
|
0.146250
|
-0.044063
|
0.020177
|
0.042643
|
|
(0.08148)
|
(0.11311)
|
(0.03657)
|
(0.09316)
|
(0.06803)
|
|
[-8.26944]
|
[ 1.29299]
|
[-1.20481]
|
[ 0.21659]
|
[ 0.62678]
|
|
D(LPP(-1))
|
0.556400
|
0.116582
|
-0.056557
|
0.132894
|
0.217385
|
|
(0.18156)
|
(0.25205)
|
(0.08150)
|
(0.20758)
|
(0.15160)
|
|
[ 3.06450]
|
[ 0.46254]
|
[-0.69397]
|
[ 0.64020]
|
[ 1.43390]
|
|
D(IMEX(-1))
|
-1.461713
|
-0.076578
|
-0.199980
|
0.617312
|
0.663078
|
|
(0.47499)
|
(0.65938)
|
(0.21320)
|
(0.54306)
|
(0.39661)
|
|
[-3.07737]
|
[-0.11614]
|
[-0.93797]
|
[ 1.13673]
|
[ 1.67186]
|
|
D(LPPIMP(-1))
|
0.343766
|
-0.051400
|
-0.028818
|
-0.558920
|
-0.334210
|
|
(0.27220)
|
(0.37787)
|
(0.12218)
|
(0.31121)
|
(0.22729)
|
|
[ 1.26291]
|
[-0.13603]
|
[-0.23586]
|
[-1.79595]
|
[-1.47043]
|
|
D(LPPEXP(-1))
|
-1.260647
|
-0.139653
|
0.235840
|
0.212745
|
0.040447
|
|
(0.33727)
|
(0.46820)
|
(0.15139)
|
(0.38560)
|
(0.28162)
|
|
[-3.73782]
|
[-0.29828]
|
[ 1.55785]
|
[ 0.55172]
|
[ 0.14363]
|
|
C
|
-0.093508
|
0.077769
|
0.038896
|
0.007921
|
-0.068061
|
|
(0.04723)
|
(0.06556)
|
(0.02120)
|
(0.05399)
|
(0.03943)
|
|
[-1.98000]
|
[ 1.18622]
|
[ 1.83488]
|
[ 0.14670]
|
[-1.72596]
|
|
R-squared
|
0.750562
|
0.071027
|
0.201073
|
0.132070
|
0.144974
|
|
Adj. R-squared
|
0.707555
|
-0.089141
|
0.063327
|
-0.017573
|
-0.002445
|
|
Sum sq. resids
|
1.595439
|
3.074637
|
0.321448
|
2.085497
|
1.112362
|
|
S.E. equation
|
0.234553
|
0.325610
|
0.105283
|
0.268167
|
0.195850
|
|
F-statistic
|
17.45226
|
0.443453
|
1.459735
|
0.882564
|
0.983416
|
|
Log likelihood
|
4.380633
|
-7.100023
|
32.41681
|
-0.306882
|
10.69225
|
|
Akaike AIC
|
0.092535
|
0.748573
|
-1.509532
|
0.360393
|
-0.268128
|
|
Schwarz SC
|
0.359166
|
1.015204
|
-1.242901
|
0.627024
|
-0.001497
|
|
Mean dependent
|
-0.006977
|
0.096363
|
0.019334
|
0.012237
|
-0.044158
|
|
S.D. dependent
|
0.433730
|
0.312001
|
0.108783
|
0.265842
|
0.195611
|
|
Determinant Residual Covariance
|
2.15E-08
|
|
|
|
|
Log Likelihood (d.f. adjusted)
|
60.66293
|
|
|
|
|
Akaike Information Criteria
|
-1.752167
|
|
|
|
|
Schwarz Criteria
|
-0.419012
|
|
|
|
Test de non causalité au sens de Granger pour
les séries annuelles :
|
Pairwise Granger Causality Tests
|
|
Date: 09/19/07 Time: 22:36
|
|
Sample: 1970 2006
|
|
Lags: 1
|
|
Null Hypothesis:
|
Obs
|
F-Statistic
|
Probability
|
|
D(LPP) does not Granger Cause D(LINF)
|
35
|
3.65538
|
0.06488
|
|
D(LINF) does not Granger Cause D(LPP)
|
1.95396
|
0.17178
|
|
D(IMEX) does not Granger Cause D(LINF)
|
35
|
5.46758
|
0.02578
|
|
D(LINF) does not Granger Cause D(IMEX)
|
1.85596
|
0.18260
|
|
D(LPPIMP) does not Granger Cause D(LINF)
|
35
|
0.04212
|
0.83869
|
|
D(LINF) does not Granger Cause D(LPPIMP)
|
0.04134
|
0.84018
|
|
D(LPPEXP) does not Granger Cause D(LINF)
|
35
|
0.99245
|
0.32662
|
|
D(LINF) does not Granger Cause D(LPPEXP)
|
0.41768
|
0.52270
|
|
D(IMEX) does not Granger Cause D(LPP)
|
35
|
0.03407
|
0.85472
|
|
D(LPP) does not Granger Cause D(IMEX)
|
0.02037
|
0.88739
|
|
D(LPPIMP) does not Granger Cause D(LPP)
|
35
|
0.21867
|
0.64322
|
|
D(LPP) does not Granger Cause D(LPPIMP)
|
0.19343
|
0.66304
|
|
D(LPPEXP) does not Granger Cause D(LPP)
|
35
|
0.37431
|
0.54498
|
|
D(LPP) does not Granger Cause D(LPPEXP)
|
0.84575
|
0.36464
|
|
D(LPPIMP) does not Granger Cause D(IMEX)
|
35
|
0.60872
|
0.44100
|
|
D(IMEX) does not Granger Cause D(LPPIMP)
|
0.64501
|
0.42783
|
|
D(LPPEXP) does not Granger Cause D(IMEX)
|
35
|
2.66012
|
0.11270
|
|
D(IMEX) does not Granger Cause D(LPPEXP)
|
0.96721
|
0.33275
|
|
D(LPPEXP) does not Granger Cause D(LPPIMP)
|
35
|
0.06192
|
0.80507
|
|
D(LPPIMP) does not Granger Cause D(LPPEXP)
|
0.09538
|
0.75945
|
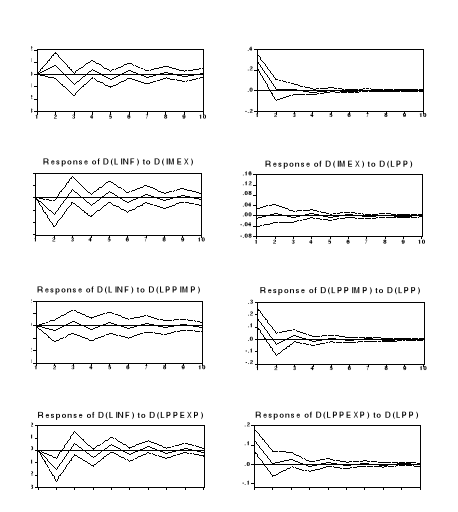
Fonctions de réponse impulsionnelles pour les
séries annuelles :
Décomposition de la variance pour les
séries annuelles :
|
Variance Decomposition of D(LINF):
|
|
|
|
|
|
|
|
Period
|
S.E.
|
D(LINF)
|
D(LPP)
|
D(IMEX)
|
D(LPPIMP)
|
D(LPPEXP)
|
|
1
|
0.234553
|
100.0000
|
0.000000
|
0.000000
|
0.000000
|
0.000000
|
|
2
|
0.336730
|
56.85692
|
4.764127
|
14.91821
|
1.328016
|
22.13273
|
|
3
|
0.366532
|
52.29157
|
8.428892
|
16.13626
|
2.092500
|
21.05078
|
|
4
|
0.386544
|
50.31889
|
8.893047
|
17.08671
|
2.450847
|
21.25050
|
|
5
|
0.398763
|
49.05070
|
9.328837
|
17.60375
|
2.698246
|
21.31846
|
|
6
|
0.406246
|
48.38135
|
9.550380
|
17.87605
|
2.852615
|
21.33961
|
|
7
|
0.410975
|
47.97151
|
9.675225
|
18.03845
|
2.951190
|
21.36362
|
|
8
|
0.413950
|
47.72057
|
9.751919
|
18.13457
|
3.014852
|
21.37809
|
|
9
|
0.415832
|
47.56506
|
9.798246
|
18.19292
|
3.055809
|
21.38797
|
|
10
|
0.417024
|
47.46752
|
9.826915
|
18.22883
|
3.082181
|
21.39455
|
|
Cholesky Ordering: D(LINF) D(LPP) D(IMEX) D(LPPIMP)
D(LPPEXP)
|
|
|
|
|
|
|
| 
