2.4 Zio Hydrological characteristics
Zio river, with its arms Edin in Togblé and Adougba in
Tonoukouti, shows a small dense hydrographic network in the coastal sedimentary
basin.
2.4.1 Hydrographic network and catchments area
- Hydrographic network, Zio river, inside
type belongs to the hydrographic system of the South-Togo has North-South
direction. The basin develops an alluvial plain in the shape of funnel which is
spread out towards the mouth characteristic of the silting phenomenon.
Depending of the sedimentary structure, Zio valley little boxing shows very
weak unevenness of gradients which values ranging between 0, 5 and 2%;
- Zio catchments area, with these effluents,
the river runs in a mixed area catchments crystalline structure separated
upstream from the sedimentary basin by a change of incline altitudinal to the
latitude in Mission-Tové. From the supply point of view water of the
bed, Zio collects its water according to the diagram hereafter:

Evapotranspiration
(Vegetation)
River bed (talweg)
Groundwater
Rain
Stream
Infiltrations
Hydro-
network
Figure 5: Water supply of the Zio river
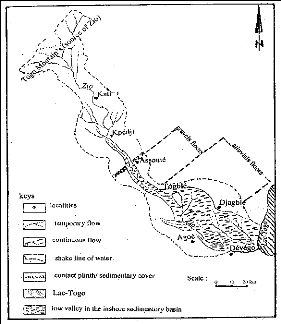
Figure 6: Zio catchment area and hydrographic network
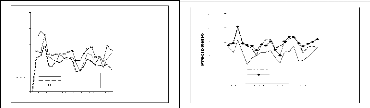
- Rain mode, the data of table (4) show the
rate/rhythm of evolution of annual average rainy in the area catchments of the
South to North; the annual cycle of precipitations in the various stations
appears irregular.
2500
2000
1500
1000
500
0
1 4 7 10 13 16 19
Assanhoun Mission Togblékopé
2500
2000
1500
1000
500
0
1 3 5 7 9 11 13 15 17 19
Anné e s
Adéta Kati Kpédji
Figure 7: Curves of evolution of annual average precipitations
over 20 years
Over 20 years' period, it is notes that the catchments area
records the strong and weak rains. This variation of the fallen quantities of
water explains also the behavior of hydrological flows of Zio.
Table 4: Annual averages rain stations of the Zio catchments
area (in mm)
|
High valley
|
Low valley
|
Stations years
|
Adéta
|
Kati
|
Kpédji
|
Assanhoun
|
Mission-T
|
Togblékopé
|
1980
|
1415,1
|
1395,5
|
1323,4
|
1678,7
|
1079,4
|
1276,5
|
1981
|
1484,0
|
1462,8
|
1138,5
|
1905,4
|
1109,7
|
1237,0
|
1982
|
1979,7
|
2037,4
|
1570,2
|
1789,6
|
1450,6
|
1800,9
|
1983
|
1443,0
|
1450,6
|
1126,5
|
1125,4
|
0818,3
|
1175,2
|
1984
|
1359,3
|
1397,5
|
0730,8
|
1022,3
|
0800,0
|
1148,8
|
1985
|
1262,9
|
1367,4
|
0950,3
|
0949,2
|
0958,1
|
1190,2
|
1986
|
1027,4
|
1217,6
|
1031,8
|
1218,8
|
0907,9
|
1133,7
|
1987
|
1385,5
|
1418,9
|
1150,0
|
1040,1
|
1039,8
|
1201,0
|
1988
|
1577,0
|
1375,8
|
1146,6
|
1034,9
|
1081,6
|
1257,4
|
1989
|
1588,0
|
1531,0
|
1201,1
|
1103,2
|
0984,8
|
1293,2
|
1990
|
1273,6
|
1234,3
|
0971,7
|
0935,6
|
0646,8
|
0996,4
|
1991
|
1362,3
|
1048,1
|
0782,1
|
0650,1
|
0613,7
|
0978,3
|
1992
|
1451,1
|
1527,2
|
1149,1
|
0924,2
|
0798,5
|
1206,8
|
1993
|
1596,0
|
1689,0
|
1184,0
|
1205,7
|
1024,5
|
1341,3
|
1994
|
1701,2
|
1674,2
|
1351,7
|
1171,1
|
0945,4
|
1414,2
|
1995
|
1446,7
|
1463,1
|
0832,8
|
0903,3
|
0840,3
|
1089,5
|
1996
|
1118,3
|
1357,2
|
0863,6
|
1097,7
|
0830,1
|
1113,4
|
1997
|
1327,0
|
1440,6
|
0995,0
|
0762,0
|
0805,8
|
0963,9
|
1998
|
1346,3
|
1508,1
|
1126,5
|
1051,2
|
0856,9
|
1460,5
|
1999
|
1322,6
|
1596,9
|
1319,0
|
1192,1
|
0697,5
|
1319,7
|
|
Source: Météorologie Nationale -
Lomé
- Zio hydrological mode, it is characterized
by the succession high and low waters periods. The high waters correspond the
rains seasons while low waters coincide with the dry seasons. It is rises from
this water periodic distribution, the seasonal variations of the flow gives of
the river a subequatorial functionally mode.
Analysis curves (fig.8) of interannual average monthly Zio
flows with Kati, Kpédji and Togblé make it possible to identify
and to know its hydrological characters: increase and low water level.
. Season of swell waters and floods, the
period of high waters is approximately 5 months with two maximum. It goes from
July to November; the first maximum is recorded towards the end of July where
the height of water is important and causes the great rising; the flow
overflows the average bed and occupies the major bed on several meters; it is
the period of strong flows; the erosive action of water is accelerated. The
second maximum is between September and October with relatively low heights of
water;
. Season of low waters, it is spread out over
6 to 7 months, from December to May or June; the period of low waters is copied
almost on that of the great dry season. The minor bed undergoes a low water
level or a draining which is accentuated during February, January and March.
It comes out from these observations that the Zio
hydrological mode is seasonal and characterized by one high waters period in
July and low waters in January. There is thus a similarity between the climatic
seasonal mode of the sector and the behavior of river hydrological flows. The
basin is thus subjected to a subequatorial rainy mode with the rather irregular
seasonal characteristics justifying the interannual variability flow.
- Interannual variability of Zio flow, flow
values (tabl.5) of Zio over the period considered, show that the flow knows
hydrologic variations which related to the rate/rhythm of rain; the high flows
correspond to years of strong rains.
Table 5: Zio annual average flows on 21 years (in
m3)
Stations
years
|
Kati
|
Kpédji
|
Togblé
|
1980
|
4,48
|
7,26
|
9,26
|
1981
|
4,98
|
9,43
|
9,35
|
1982
|
8,11
|
24,10
|
18,88
|
1983
|
4,82
|
8,52
|
6,35
|
1984
|
4,49
|
3,47
|
5,83
|
1985
|
4,42
|
7,37
|
6,65
|
1986
|
3,12
|
4,49
|
5,68
|
1987
|
4,62
|
5,60
|
6,18
|
1988
|
4,31
|
6,58
|
7,96
|
1989
|
5,77
|
8,66
|
9,29
|
1990
|
3,88
|
3,82
|
3,26
|
1991
|
1,82
|
1,91
|
1,40
|
1992
|
4,96
|
4,35
|
4,92
|
1993
|
6,28
|
14,53
|
10,51
|
1994
|
6,19
|
15,36
|
10,55
|
1995
|
4,24
|
6,18
|
7,59
|
1996
|
4,52
|
3,20
|
4,56
|
1997
|
4,72
|
0,40
|
1,06
|
1998
|
4,80
|
10,66
|
12,69
|
1999
|
3,25
|
11,24
|
7,67
|
2000
|
3,20
|
11,36
|
7,75
|
|
Source: Service Hydrologie-Lomé
Curves analysis (fig.8 and 9) concludes that the Zio water
reaction is closely related to the rain mode of the study zone.
|
|

