|
Analyzing how to shift Informal Unit of Production
(IUP) to formality:
the case of Cameroon
Ramses ZANG and Chadeney NDAPOU1
Contact:
zang_omer@yahoo.fr
Abstract
For a country like Cameroon witnessing an informal employment
rate of more than 90%, the shift towards formality requires an effective public
assistance. This paper attempts to prescribe a way by which public funds could
be less riskily and more efficiently allocated to IUPs according to their
dynamism measured here by their profitability. The methodology used in this
paper is the construction of a frame for assessing IUPs effectiveness with some
of their positive core characteristics like education attainment of the owner
and the sales, and a negative one, the costs. The main variables have been
selected through a principal components analysis. A logistic regression has
been used to estimate parameters necessary to complete the scoring equation
aimed at identifying less risky and more efficient IUPs. As a perspective, it
comes out that IUPs might be very motivated if a policy aimed at effectively
allocating them public funds according to their dynamism is put in place. They
could find more rationales to gather themselves for more effectiveness and
greater probability to benefit from these funds, expand and then get access to
bank credits.
1. Introduction
In Cameroon, the unemployment rate in 2005 was 4.4% according
to the International Labor Organization definition. Besides how impressive this
figure may appear, it hides a tremendous amount of precariousness and
underemployment. Actually, underemployment touches more than three quarters of
the potential working force in Cameroon. Underemployment and precariousness
comprise both the unemployed and the employed population earning less than the
legal minimum wage or working less than 35 hours a week. This underemployment
is essentially nurtured by the informal sector that employs more than 90% of
the actual working force. In fact, the underemployment rate was 70.6% in the
non-farming sector and 86.8% in the informal farming sector. It is important to
notice that this situation has been favored by the economic crisis of the 80s.
Moreover, many evidences now show that one of the huge unanticipated drawbacks
of the Structural Adjustment Policy focusing on the reduction of public
spending has deeply affected the labor force in the sense that it has led to
the reduction of the Government' s staff, so far the main formal employer. The
private sector was at that time too under-expanded to absorb the bounce of job
seekers. The country has therefore witnessed the development of an
uncontrollable urban informal sector and the rise of precarious jobs. It is
more than a necessity nowadays to try to cancel all this precariousness and
informality that not only entertains harsh labor conditions and poverty but
also perpetuate disconnection between public policies and people in real need.
A way of doing that is to accompany dynamic informal units susceptible to earn
the status of small formal production units to do so faster and comfortably.
Cameroonian authorities, in the global framework of fighting against poverty
have put in place in 2002 a structure, «Projet Integre d'Appui aux Acteurs
du Secteur Informel (PIAASI)» aiming at ensuring the promotion of the
informal economy. This action, managed by the Ministry in charge of labor and
professional training is translated into the financing and training of actors
of the sector in concern. Thanks to resources from the Heavily Indebted Poor
Countries Initiative, the PIAASI was launched in 2005. It was essentially
focusing on very small projects for self employment and
1 Engineers in Statistics and Economist
microenterprises like artisanal activities, very small scale
esthetics, catering, shoes repairs, farming, etc. The authors of this paper
want to show that such an action must be extended to the IUPs the most dynamic
in order to take them to the scale of small formal enterprises. With This
purpose, the present paper will realize a partition of IUPs in Cameroon using
the survey 1-2-3, phase 2 of 2005 to distinguish stagnant units from dynamic
units that could potentially evolve to become formal enterprises. We will
therefore design a set of characteristics that could allow a public policy to
efficiently finance such IUPs. We will use discriminatory procedures from SPAD
software and logistic analysis from STATA software to make available the more
relevant variables that differentiate stagnant from dynamic IUPs. Moreover, we
intend to provide a set of parameters and characteristics gathered in a scoring
equation that could allow any anonymous IUP to be appropriately ranked in each
group provided some of its characteristics.
2. Methodological issues
Methodological issues in this paper stand on the concept of
informality and the identification of dynamism amongst the IPUs through
discriminatory and multivariate analyses.
The concept of informality
The debate on a universal definition of informality is still
pending. The term «informal» was used for the first time by Hart in
1971. It has been reemployed by the ILO in its report on Kenya in 1972. This
evocation has underlined seven criterions to identify IUPs: exclusive use of
local resources, family ownership of the unit, reduced scale of the activity,
use of techniques that are essentially man power demanding, skills of the
manpower are acquired out of formal training institutions and highly
competitive markets without regulation. These characteristics were too numerous
for a single unit to meet them all. Further criterions were therefore
restricted to the scale and the lawfulness of the unit. The criterion of scale
is the most easy to mobilize because it requires just a unit to have less that
a threshold of employees (usually, 10). The scale criterion is not
appropriate for international comparisons though, and doesn't take into account
the smallness of enterprises like attorney offices, notaries, accountants that
are modern and most of the time very profitable. To avoid that insufficiency,
the criterion of legality has been settled. According to this criterion, an IUP
is the one that does not respect the law, the pending question here still
being; which laws among the numerous existing are required? This led to the ILO
combining the criterions of smallness in terms of employment and non
registration of the unit or of the regular workers. The survey 1- 2-3 that we
will use in this paper has considered informal, any activity without a tax
payer identification number and/or not handling written accounts according to
the scheme required by the law.
Measuring the economic dynamism of
IUPs
Among the possible variables like sales, numbers of employees,
etc, profits have been chosen as the variable to discriminate between the
less and the more effective. The less effective group will be
constituted of IUPs that make monthly profits which are less than the
nationwide median, the more effective being those with monthly profits which
are more than the nationwide median. The profit is defined as the difference
between sales and costs (mainly salaries and taxes). After we decided on the
discrimination criterion, the concern was now to extract from the huge database
the more relevant variables likely to explain the ranking in one group or
another. The Principal components analysis (PCA) has been operated to realize
the variable specification. The PCA like the factorial analysis are statistical
tools that summarize the variability among a set of numerous variables. In
fact, they seek to describe the variation of a given set of variables as linear
combinations of the original variables in which each linear
combination is aimed at explaining a maximum of variation of
original variables without being correlated to the other linear combinations.
Most of the time, analysts just focus on the first two linear combinations that
by definition explain most of the variability. It is therefore possible to
scatter plot the IUPs according to the two axes obtained from the first two
linear combinations and to represent the variables in the circle of correlation
comprising the above mentioned axes.
The next step was to apply the multivariate discriminatory
analysis techniques to differentiate the two groups of IUPs so that an
anonymous IUP could be ranked in the appropriate group knowing only some core
characteristics. For this purpose we both operated the so called credit scoring
techniques and the logistic regression. The credit scoring is used in several
areas like medicine, meteorology or finance, the latest using it to identify
solvable clients. It consists of performing comparison tests using the Wilks'
Lambda (£) as statistics' test on the core variables identified
through the PCA process. Its applicability requires the observance of two
hypotheses that are the equality of the covariance matrix of the two groups and
the normality of the distribution of each population group. If £
tends towards 1 its influence on the differentiation is not relevant,
in the contrary, the further it goes below 1, the more it influences
the differentiation. Mindful that the Credit score technique requires the
observance of these strong hypotheses, it is easier to cross over those
requirements by applying a logistic
p
regression. The Logit function is defined as
LogitP fi fi X
= + where designates the
i i
i = 1
coefficients, i the index of the variable, X
the variable, p the number of variables and P the probability
of being ranked in the effective group. The above equality corresponds to the
expression: P(Y=1/X=x) = 1/(1 +e-(/31x1+...+
/3pxp).
The estimation of coefficients uses the maximum likelihood.
The normality of the distributions of variables is required. We ranked an IUP
in the effective group if its probability was more than 0.5. From the
above process we could deduce the score of effectiveness defined as S(x) =
/31x1+... + /3pxp and then rank the IUP according to
their results in the scoring process.
We have deliberately chosen just to display the results
obtained from the logistic regression because they have been found more
relevant than the credit scoring method. In fact, the matrix of confusion of
the logistic regression was stronger than the credit scoring one.
3. Data and variables specification
Data were obtained from the National Institute of Statistics
of Cameroon2 and were resulting from the 2005 survey 1-2-3 which had
as objectives the follow-up of employment, informal sector and household
consumption. We used the phase 2 that focuses on the informal sector by
collecting data on the working conditions, manpower, contribution of the
informal sector to the economy and issues and perspectives of that sector. The
phase 2 is theoretically supposed to happen every four years. It will then be
possible to update the parameters of the model we are proposing according to
that periodicity.
As we mentioned above, the PCA was used for the variables
specification. 4,815 IUPs were involved in the process. The first two
axes were representing 58.5% of the total variability. When plotting
the IUPs according to these two axes, the results suggested that they were
relatively very close each other as shown on the graph 1 below. In
fact almost all IUPs are surrounding the mean point.
2
www.statistics-cameroon.org
Graph 1: Two way scatter of IUPs in the factorial plan
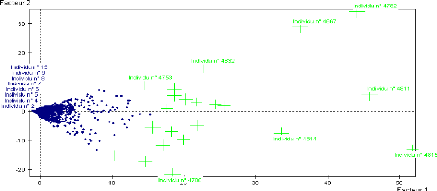
Nevertheless, some points are found very far from the mean
point suggesting that they are witnessing a relatively high level of activity
with sales cros sing the threshold of the FCFA 1,000,000 (US$ 2,500).
Theses points are represented by crosses proportional to the size of their
activities. Variables were also represented in the correlation circle (see
graph 2). This graph shows that almost the whole variables are very well
represented, the arrows designating each being very close to the borders of the
circle on the factorial plan. We can observe four groups of variables. The
first is the set raw materials and intermediary consumption, the
second, number of worked hours and the salaries, the third,
variables indicating the gross benefice and the fourth, sales and
costs.
Graph 2: Variables correlation in the factorial plan
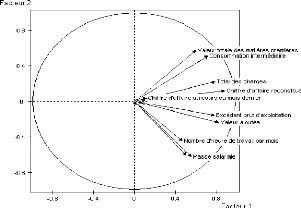
We will finally keep only three variables representing each
group: the sales, the number of hours worked and the costs per month. To these
variables we will add control variables like education level of the owner, his
age and the age of the IUP.
4. Findings and Results
The dynamic of job creation in
Cameroon
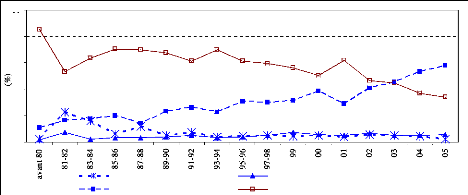
From the curves below, we can notice that the informal
non-farming sector (60%) has become since 2003 the main occupation of the
population, crossing over the farming informal sector (38%). The public and the
private formal sectors are stagnating since the 90s.
Graph 3: Job creation according to the institutional sector over
20 years
Source: NIS, Surveys 1-2-3, 2005, Phase 1
100
40
60
20
80
0
Secteur public Entreprise privée formelle
Entreprise privée informelle non agricole Entreprise
informel agricole
Structure of employment in Cameroon
Table 1: Structure of employment according to institutional
sector and the area
|
Employment
%
|
Mean age
|
Females (%)
|
Male (%)
|
Years of
di
|
Experience within h i
|
|
Urban
|
|
|
|
|
|
|
|
Public
|
10.5
|
39.7
|
31.8
|
81.1
|
12.3
|
9.6
|
|
Private formal
|
11.8
|
36.1
|
20.4
|
79.1
|
10.9
|
5.9
|
|
Informal non-farming
|
67.4
|
31.2
|
45.4
|
66.4
|
7.0
|
4.5
|
|
Informal farming
|
10.3
|
37.2
|
57.4
|
52.0
|
5.2
|
12.6
|
|
Overall
|
100
|
33.3
|
42.2
|
67.9
|
7.8
|
6.0
|
|
Rural
|
|
|
|
|
|
|
|
Public
|
2.6
|
39.4
|
25.8
|
79.7
|
11.3
|
7.5
|
|
Private formal
|
2.0
|
35.9
|
15.4
|
79.3
|
7.6
|
6.7
|
|
Informal non-farming
|
22.5
|
31.9
|
55.0
|
44.3
|
4.3
|
6.2
|
|
Informal farming
|
72.9
|
33.3
|
52.7
|
35.3
|
3.2
|
12.2
|
|
Overall
|
100
|
33.2
|
51.8
|
39.3
|
3.8
|
10.6
|
|
Cameroon
|
|
|
|
|
|
|
|
Public
|
4.9
|
39.6
|
29.5
|
80.6
|
11.9
|
8.8
|
|
Private formal
|
4.7
|
36.0
|
18.9
|
79.1
|
9.9
|
6.2
|
|
Informal non-farming
|
35.2
|
31.5
|
49.8
|
56.3
|
5.8
|
5.3
|
|
Informal farming
|
55.2
|
33.5
|
53.0
|
36.2
|
3.4
|
12.2
|
|
Overall
|
100
|
33.2
|
49.1
|
47.4
|
4.9
|
9.3
|
Source: NIS, Surveys 1-2-3, 2005, Phase
1
Table 1 shows that across the country, more than one
worker out of two is a business owner
working as a self-employer or with
very few employees. In the rural area, almost one third of
the working population is family helping without effective
salaries. The working class which is the more representative in developed
countries accounts only for 8% in the whole country and 20.3% in urban area.
Not surprisingly, the formality of positions goes side by side with the number
of years of schooling.
Underemployment in Cameroon
Visible underemployment is a situation characterizing workers
unwillingly involved in less than 35 hours a week in their main activity for
reasons linked to their employer or to a bad economic situation. It was
touching 12.2% of the working class in Cameroon in 2005. It is twice higher in
the non-farming working sector than in all other sectors. It increases
according to the level of education. A high working time could be also
translated by a form of underemployment occasioned by the lowness of the
productivity. This form of underemployment is called invisible underemployment
and is usually estimated by the level of income. In Cameroon, the invisible
underemployment rate is defined as the percentage of the working class earning
less than FCFA 23,500 (US$ 65) a month for 40 hours worked a week. This rate is
estimated at 69.3% of the actual manpower. It is within the informal sector
that underemployment is more crucial with more than six persons out of 10. The
underemployment affects more the rural area than the urban area. In the
contrary of visible underemployment, invisible underemployment decreases with
the level of education. The sum of these two forms of underemployment and the
unemployment yields the global underemployment that touches three quarters of
the potential working class in Cameroon. This problem is the more critical of
the Cameroon employment issues because many trained young people declare
exercising informal jobs to survive while hoping for a more stable and better
rated job corresponding to their qualification and/or their level of
studies.
Table 2: Rates of underemployment according to institutional
sector, the gender and the area
|
Institutional sectors
|
|
Visible
|
|
|
Invisible
|
|
Overall
|
|
|
Urban
|
Rural
|
Cameroon
|
Urban
|
Rural
|
Cameroon
|
Urban
|
Rural
|
Cameroon
|
|
|
|
|
|
|
|
|
|
|
Public
|
7.3
|
10.1
|
8.4
|
3.1
|
17.4
|
8.6
|
10.3
|
26.8
|
16.7
|
|
Private formal
|
6.4
|
5.6
|
6.2
|
13.6
|
31.8
|
19.0
|
19.3
|
34.2
|
23.7
|
|
Informal non-farming
|
17.1
|
23.1
|
19.9
|
54.4
|
66.8
|
60.1
|
64.8
|
77.5
|
70.6
|
|
Informal farming
|
15.6
|
7.6
|
8.0
|
70.2
|
85.7
|
84.8
|
75.1
|
87.5
|
86.8
|
|
Gender
|
|
|
|
|
|
|
|
|
|
|
Male
|
12.1
|
11.8
|
11.9
|
37.8
|
71.5
|
60.7
|
50.9
|
77.2
|
68.3
|
|
Female
|
18.2
|
10.5
|
12.4
|
56.6
|
85.2
|
78.2
|
70.9
|
88.3
|
83.6
|
|
Overall
|
14.7
|
11.1
|
12.1
|
45.7
|
78.6
|
69.3
|
68.3
|
83.6
|
75.8
|
Source: NIS, Surveys 1-2-3, 2005, Phase
1
Effectiveness of IUPs
The effectiveness of an IUP corresponds to its ability to
create jobs in order to raise its production and make profits. The level of
gross profit has therefore been considered in this paper to categorize IUPs.
Meanwhile, table 3 below shows other possible criterions that we could
have taken. The nationwide gross profit median is FCFA 28,000 (US$70)
per month; a very low profit which mainly characterizes IUPs in Cameroon. But
this median profit is stretched from a minimum of FCFA 82,000
(US$165) losses to a maximum of FCFA
8,899,000 (US$18,000) earnings with a standard
deviation of FCFA 199,429 (US$400). We can also notice that those with
employees are the more performing. A qualitative criterion could be settled on
that aspect if credits have to be attributed to IUPs.
Table 3: Performances of IUPs per type of occupation and per
type of area (monthly in ,000 FCFA)
|
|
Sales
|
Production
|
Added value
|
Gross profit
|
|
Mean
|
Median
|
Mean
|
Median
|
Mean
|
Median
|
Mean
|
Median
|
|
Type of occupation
|
|
|
|
|
|
|
|
|
|
Self employment
|
133.8
|
47
|
77
|
36
|
43.7
|
19
|
43
|
19
|
|
Non salary job
|
173
|
65
|
110.9
|
46
|
58.2
|
22
|
54.7
|
21
|
|
Salary job
|
704.3
|
300
|
529.9
|
200
|
328.3
|
122
|
254.3
|
85
|
|
Mixt
|
650.6
|
255
|
601.9
|
255
|
304.8
|
171
|
226.7
|
112
|
|
Overall
|
173.8
|
57
|
110.2
|
41
|
62.4
|
28
|
57
|
28
|
|
Urban area
|
|
|
|
|
|
|
|
|
|
Self employment
|
206.5
|
90
|
112.3
|
56
|
66.9
|
34
|
65.6
|
32
|
|
Non salary job
|
283.3
|
117
|
187.2
|
84
|
96.5
|
44
|
89.9
|
38
|
|
Salary job
|
897.1
|
301
|
625
|
280
|
360.7
|
172
|
274.1
|
112
|
|
Mixt
|
683.7
|
311
|
643.7
|
311
|
326.9
|
197
|
241.1
|
120
|
|
Overall
|
275.2
|
105
|
168.3
|
69
|
95.5
|
41
|
86.5
|
37
|
|
Rural area
|
|
|
|
|
|
|
|
|
|
Self employment
|
83.2
|
31
|
52.4
|
26
|
27.6
|
12
|
27.2
|
12
|
|
Non salary job
|
109.1
|
45
|
68.9
|
37
|
37.2
|
16
|
35.3
|
15
|
|
Salary job
|
463.5
|
200
|
411.2
|
150
|
287.8
|
100
|
229.5
|
61
|
|
Mixt
|
504.3
|
113
|
445.9
|
113
|
222.5
|
69
|
172.7
|
41
|
|
Overall
|
104.6
|
37
|
70.5
|
30
|
39.8
|
14
|
36.9
|
13
|
Source: NIS, Surveys 1-2-3, 2005, Phase
2
Table 4 displays some of the characteristics of the
two groups generated. The more effective group is in almost all aspects
averagely greater than the less effective except in terms of age of the owner
and duration of exploitation where we could not find significant
disparities.
Table 4: Group's statistics (means)
Hours worked Education Age of the duration of
last month level Sales Costs owner exploitation
|
Less effective IUPs
|
136.6
|
5.0
|
44.0
|
33.0
|
36.6
|
6.6
|
|
More effective IUPs
|
210.5
|
7.7
|
384.7
|
263.9
|
35.4
|
6.2
|
|
Overall
|
173.6
|
6.4
|
214.7
|
148.6
|
36.0
|
6.4
|
Logistic analysis
The parameters of the logistic regression are shown on
table 5. The second column provides the estimated coefficients; the
fourth one displays the probability of rejecting the nullity of the
coefficients; and the last one shows the marginal effects of every variable.
Sales, hours spent at work, costs and to a lesser extent, education levels are
all significant at a threshold of 5%. As expected, costs affect negatively the
effectiveness of IUPs; this should be interpreted cautiously though, because
great expenses sometimes mean higher production for higher sales and higher
profits. This means also that the Government can effectively alleviate (0.24)
the informal sector by reducing or canceling some of their taxes to favor their
entrance into formality. The variable that influences the most is the amount of
sales with an odd ratio of 0.25. The time spent at work is almost neutral in
terms of impact on the effectiveness. As we can notice from the last column,
marginal effects are very low for all the variables at stake.
Table 5: Parameters of the logistic regression of the
effectiveness of IUPs
S.E Wald Signif. Exp ( ) Marg. Eff.


Education level
|
0.03
|
0.01
|
5.44
|
0.02
|
1.03
|
1. 12 x 10-6
|
|
Sales
|
0.25
|
0.01
|
646.58
|
0.00
|
1.28
|
8. 34 x 10-6
|
|
Charges
|
-0.24
|
0.01
|
618.23
|
0.00
|
0.79
|
-8. 14 x 10-6
|
|
# hours at work during last month
|
0.00
|
0.00
|
42.16
|
0.00
|
1.00
|
1. 60 x 10-7
|
|
Intercept
|
-7.85
|
0.32
|
617.26
|
0.00
|
0.00
|
---
|
Number of observations = 4809 ; Prob > chi2 = 0.000; Log
likelihood = -5 17.70446; Pseudo R2 = 0.8447
Table 6 below shows that 96.9% of the IUPs have been
well ranked from the logistic regression while only 72.3% were so with the
Wilks' test approach.
|
Table 6: Confusion matrix
|
|
|
|
|
Attributed groups
Real Groups
|
Less effective IUPs
|
More effective IUPs
|
Total
|
|
Less effective IUPs More effective IUPs
|
2,346 95
|
54
2,3 14
|
2,400
2,409
|
|
Total
|
2,441
|
2,368
|
4,809
|
We can therefore easily compute for any anonymous IUP the score
of effectiveness S;
S = 0.03Education + 0.25Sales - 0.24Costs,
and rank it according to it final score in order to efficiently
allocate them credit for their expansion to a formal activity.
5. Discussion
Cameroon is witnessing a historical increase in informality
mostly touching the non-farming sector. Its contribution to the GDP has evolved
from 22% in 1993 to almost 50% 12 years later. This sector provides 90.4% of
jobs in the country. Most of these jobs are precarious and casual. One of the
biggest issues that this sector faces is that, it doesn't have access to the
credit market; this hampers its process of comfortably evolving to the formal
sector. The PIAASI has an approach of promoting the informal sector by
allocating credits to selfemployment projects. We analyzed through this paper
how it would have been more efficient for the PIAASI to allocate funds to IUPs
according to their dynamism in order to accompany them in the formal sector
which is legally more advantageous (protection, credit access, accountability,
sales...) and in the long run, economically safer than the informal sector.
These advantages are mostly ignored by informal sector operators. Through the
scoring of IUPs, the Government could allocate them promoting funds that would
encourage small IUPs to gather and be more efficient in order to fulfill the
requirements and benefit from that unprecedented opportunity. The sectors of
the microfinance and banking could therefore treat more respectfully the IUPs
which otherwise pay huge interests for very few loans due to the high level of
risk that constitute their portfolio.
Acknowledgements
We thank the National Institute of Statistics (NIS) of Cameroon
which has granted us the data
and supervised us in partnership with the
«Institut Sous-regional de Statistiques et
d'Economie Appliquee» (ISSEA). We also thank Mr. GOUNE
TEKOMBONG Russel Romeo for his critical reading of this paper.
References
Lantier B., L'économie informelle dans le tiers
monde, collection reperes, Edition La Découverte, Paris, 1994 ;
Bry X., Analyses factorielles multiples, Economica,
Paris, 1996 ;
INS, Rapport principal de l'enquête sur l'emploi et le
secteur informel au Cameroun, Janvier 2006 ;
Lachaud J.-P., Le secteur informel urbain et
l'informalisation du travail en Afrique : rhétoriques : le cas de la
Côte d'Ivoire ;
Jacquet P., A l'école du secteur informel dans les
pays en développement, Le monde du 26 juin 2007 ;
Barthelemy P., Le secteur urbain informel dans les pays en
developpement : une revue de littérature ;
SAPORTA G., Probabilité, Statistique, Analyse des
données, Éditions TECHNIP, Paris 1997.
BIKOUN B. M., 71 millions d'appui au secteur informel,
Quotidien Mutations du 20 octobre 2006.
| 

