C- P / P = R
C = Current Year Revenue
P = Past Year Revenue
R = Rate of Growth in Revenue
This is the most popular way of tracking revenue as a change
from year to year in percentage terms. If a company's annual growth remains the
same or consistent, it's a very positive thing since the company is well
managed is not just riding a current trend.
Where It Can Be Found: This number can also be found on a number
of stock screeners and financial sites such as Yahoo! Finance and Google
Finance as well as the Scottrade stock screener.
Sales per Share.
Sales are the main driver of revenue for most companies.
Therefore, it is necessary to calculate sales per share for the company as well
as look at the trend of this ratio. Here is how to obtain it
SPS = R / S
SPS = Sales Per Share
R = Past Year Revenue
S = Average Shares Outstanding.
|
|
For growth companies, it is good to look for increasing sales
over the past five years. 23 On the contrary, value companies whose
shares have gone down in price but are still showing a positive SPS trend are
wonderful bargains.
Where It Can Be Found: This number can also be found on a number
of stock screeners and financial sites such as Yahoo! Finance and Google
Finance as well as the Scottrade stock screener.
23 John D., CFA Stowe, Thomas R., CFA Robinson, Jerald E., CFA
Pinto, and Dennis W., CFA McLeavey, Equity Asset Valuation
Tracking Earnings
In order to fully analyze growth trends, it is necessary to
look not only at revenue growth, but also at earnings growth. If the company
reports increases in revenue, but is at the same year losing earnings, it's not
a company an investor wants to be interested in. Traditionally, earnings growth
is measured with this formula
C- P / P = E
C = Current Year Net Earnings
P = Past Year Net Earnings
E = Rate of Growth in Net Earnings
|
|
Where It Can Be Found: This number can also be found on a number
of stock screeners and financial sites such as Yahoo! Finance and Google
Finance as well as the Scottrade stock screener.
However, as previously mentioned before, the net earnings
from a company's income statement can be manipulated and is not always the most
accurate one. To get a clearer picture, it is better to utilize core earnings
found on the S&P stock report.
CC- PC / PC = E CC = Current Year Core Earnings
PC = Past Year Core Earnings
E = Rate of Growth in Core Earnings
|
|
It is also necessary to compare the difference between net
earnings growth and core earnings growth, as previously stated in order to
gauge how honest the company is and how honest the management of the company is
and if there is any creative accounting going on.
Earnings per Share
Earnings per Share is considered to be a key ratio is deemed
instrumental in judging the value of a stock. It is calculated by this formula
traditionally
N / S = E
N = Net Earnings (Year) S = Shares Outstanding E = Earnings
Per Share or EPS
|
|
To further clarify this, since the shares outstanding fluctuate
throughout the year, the shares outstanding number should be calculated as an
average. 24
Where It Can Be Found: This number can also be found on a
number of stock screeners and financial sites such as Yahoo! Finance and Google
Finance as well as the Scottrade stock screener. Some data sources may use the
number of shares outstanding at the end of the year to simplify their
calculation, so be careful to get the correct number.
24 Investopeda
However, as previously mentioned, in order to get a clear
picture, in calculating earnings per share it is necessary to use core net
earnings.
CN / S = E
CN = Core Net Earnings (Year)
S = Shares Outstanding
E = Core Earnings Per Share or EPS
|
|
The EPS is a representation of a company's profit divided by
a share of common stock and is often tracked by analysts as the most important
indicator of the price of a share, but can be easily manipulated, so in this
paper it will be considered a bit further down the line. Companies have EPS
estimates that they try to reach every quarter and price may fall if they are
not reached.
Comparing Revenue to Direct Cost and expenses
In order to understand why the revenue has increased or
decreased as well as why the earnings have gone up or down, the investor should
look at the relationship between the revenue and gross profit.
R - DC = GP
R = Revenue
DC = Direct Costs
GP = Gross Profit
Direct costs include anything that relates to the generation
of revenue. They should remain constant from year to year unless a specific
event such an acquisition, change in mix of business or valuation methods for
inventory will change. Therefore, the trend for revenue and growth profit
should correlate from year to year.
The percentage of growth profit to revenue is called growth
margin. This number should stay about level from year to year unless one of the
aforementioned events happens in the company.
G / R = M
G = Gross Profit
R = Revenue
M = Gross Margin
|
|
Where It Can Be Found: This number can also be found on a number
of stock screeners and financial sites such as Yahoo! Finance and Google
Finance as well as the Scottrade stock screener.
Expenses to Revenue
The picture becomes even clearer when expenses are compared
to revenue. Even though expenses do not directly influence revenue, because
they can include factors such as interest expense, electricity bills and
salaries of employees that are not directly related to generating revenue, the
movement of expenses should correlate on some level with the fluctuations in
revenues. The rate of growth in expenses can be calculated as
C- P / P =E
C = Current Year Expenses
PC = Past Year Expenses
E = Rate of Growth in Expenses
|
|
Once this has been calculated, the investor can compare the
ratio of expenses to revenues using this
formula
E / R = P
E = Expenses
R = Revenue
P = Ratio (Percentage)
|
|
The consistency in this over the years can mean several
different things. It means a good internal control system and efficiency, and
that management is keeping expense level well and overhead costs down in order
to generate revenue.
Where It Can Be Found: These numbers must be calculated
Operating Profit Analysis
The operating profit is the profit from all core activities,
or continuing operations. This is the number that should be watched in order to
quantify growth potential. The first formula to look at in this case is the
rate of growth in operating profit. It's very similar to the rate of growth in
net earnings, but it excludes all other income and expenses and focuses only
earnings from operations.
C - P / P = R C = Current Year Operating Profit
P = Past Year Operating Profit
R = Rate Of Growth In Operating Profit
|
|
Where It Can Be Found: While most financial websites will not
have it, brokerages a lot of times provide a research report for a stock
compiled by Reuters which will provide this number. If not, it can be
calculated.
Cash Flow Statement Analysis
Free Cash Flow
On a statement of cash flow, the investor should look for
companies that produce a lot of free cash flow. This can be calculated by the
following formula:
NI + (A or D) - C- E= FCF
NI= Net income A= Amortization D= Depreciation C= Changes in
working capital
E= Capital expenditure
FCF= Free Cash Flow
|
|
This is the money that allows the company to pay debt,
dividends, repurchase stock and increase business growth. It is the excess cash
produced by the company and can be either returned to share holders in terms of
dividends or invested in new growth opportunities.
It's good if a company can pay for the investing figure out
of operations cash flow without having to rely on outside financing. This
signals very strong fundamentals.
Where It Can Be Found: While most financial websites will not
have it, brokerages a lot of times provide a research report for a stock
compiled by Reuters which will provide this number. If not, it can be
calculated.
Net Cash Flow per Share
Cash flow is the stream of money through a company. It
measures how the company is receiving its money and if they get paid as they
sell or if they sell a lot on credit to make their revenues look bigger. This
number should be looked at as a trend over five years, and the investor would
want it to increase. It is calculated as follows
C / S = R
C = Current Year Net Cash Flow
S = Average Outstanding Number Of Shares Over The Year R = Net
Cash Flow Per Share
|
|
Where It Can Be Found: Most financial websites will have it, and
brokerages a lot of times provide a research report for a stock compiled by
Reuters which will provide this number. If not, it can be calculated.
Estimating Intrinsic Value Using DCF
There are several ways to estimate the intrinsic value of a
company, and we found the Discounted Cash Flows formula to be used by Warren
Buffet. The formula is complicated, and calculating it is out of scope of the
average investor's expertise, but a formula calculator can be found here.
http://www.moneychimp.com/articles/valuation/dcf.htm
Figure 6 - Discounted Cash Flow Calculator Screen
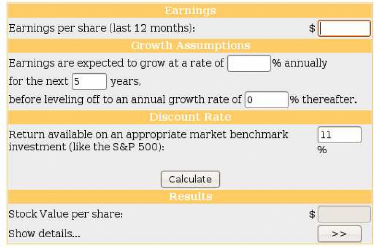
Source:
http://www.moneychimp.com/articles/valuation/dcf.htm
Some things here need to be explained. Earnings per share
should be put in here as the core earnings found from the S&P stock report.
The earnings growth projections can be found on a number of financial websites
as well as the Reuters Research Report. The investor should assume that the
earnings growth rate will level off to 0 after 5 years to give him or herself a
«margin of safety.» In addition, on average the S&P 500 is
usually growing by about 11% annually, but for additional safety the investor
may want to decrease that number. Then just click calculate and the calculator
will do all the complicated formula number crunching!
| 

